Market Overview:
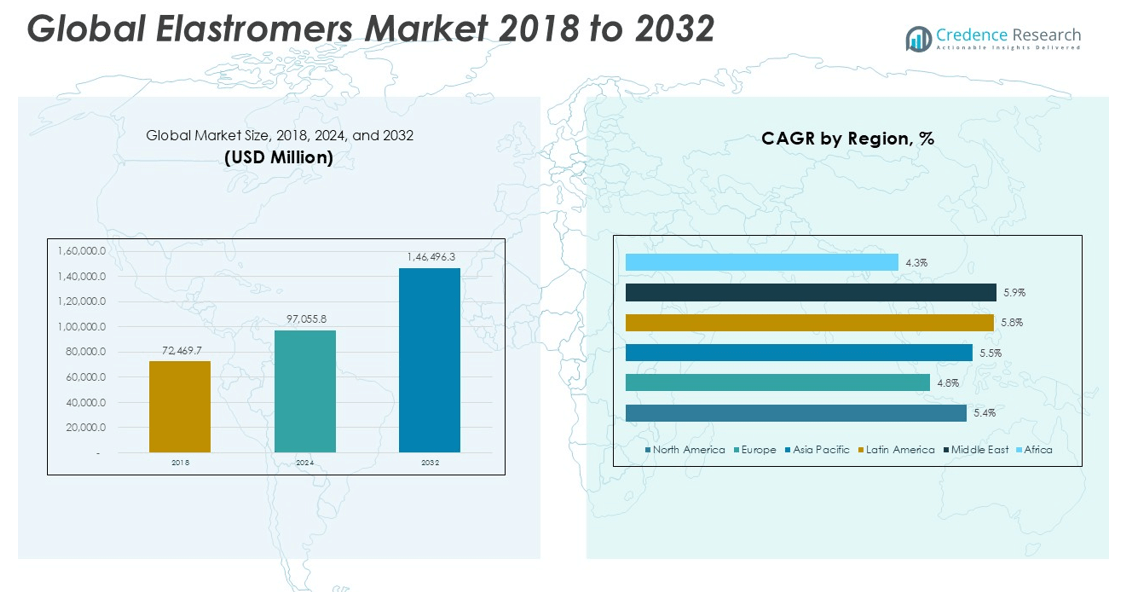
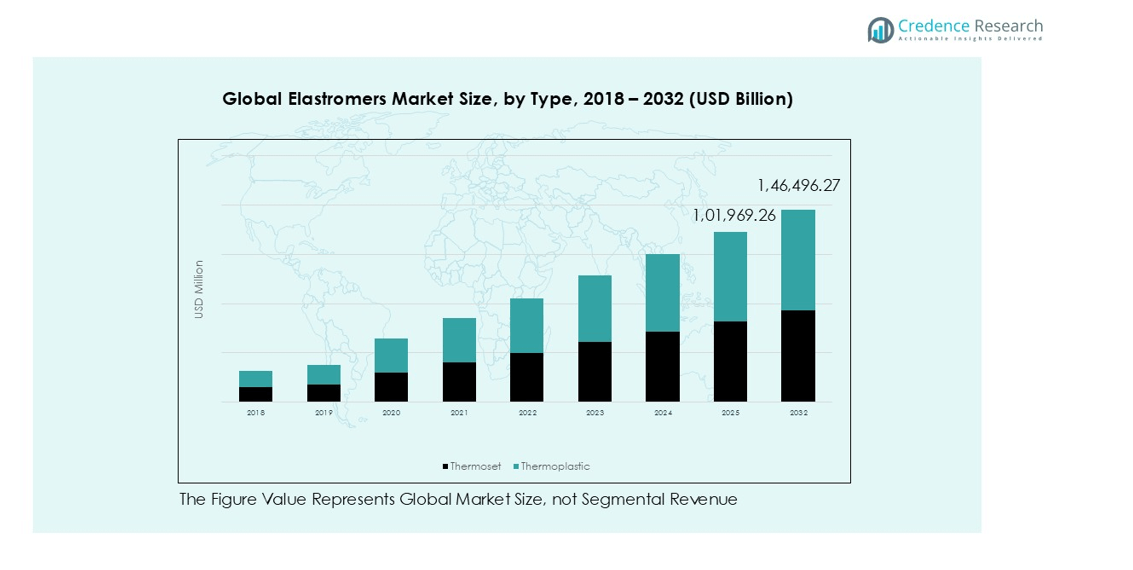
Elastomers Market size was valued at USD 72,469.7 Million in 2018 and is expected to reach USD 97,055.8 Million in 2024. The market is anticipated to grow further, reaching USD 1,46,496.3 Million by 2032, at a CAGR of 5.31% during the forecast period.
| REPORT ATTRIBUTE |
DETAILS |
| Historical Period |
2020-2023 |
| Base Year |
2024 |
| Forecast Period |
2025-2032 |
| Elastomers Market Size 2024 |
USD 97,055.8 Million |
| Elastomers Market, CAGR |
5.31% |
| Elastomers Market Size 2032 |
USD 1,46,496.3 Million |
The Elastomers Market is led by key players including BASF S.E., Covestro A.G., Huntsman Corporation, DowDupont Inc., Lanxess A.G., Zeon Chemicals L.P., Kuraray Co., Ltd., and Wacker Chemie AG, who drive growth through strategic initiatives such as product innovation, mergers and acquisitions, and regional expansions. These companies focus on developing high-performance thermoset and thermoplastic elastomers for automotive, medical, industrial, and consumer applications while emphasizing sustainability and lightweight solutions. Asia Pacific emerges as the leading region, commanding a 35% market share due to rapid industrialization, growing automotive production, and rising demand for consumer goods. Europe follows with 20% share, driven by established manufacturing, emission standards, and technological adoption, while North America holds 16% share, supported by EV adoption and advanced industrial infrastructure. Together, these regions and leading players shape the competitive dynamics and global growth trajectory of the Elastromers Market.
Market Insights
- The Elastomers Market was valued at USD 97,055.8 Million in 2024 and is projected to reach USD 1,46,496.3 Million by 2032, growing at a CAGR of 5.31%. Thermoset elastomers hold the largest segment share of 58%, while automotive leads end-use with 36% share.
- Growth is driven by rising demand from automotive and industrial sectors, including electric vehicles, lightweight components, and high-performance machinery applications.
- Market trends include the increasing adoption of thermoplastic elastomers for sustainability, integration of smart and functional materials, and demand for advanced elastomers in medical and consumer goods.
- The market is moderately consolidated with key players such as BASF S.E., Covestro A.G., Huntsman Corporation, DowDupont Inc., and Lanxess A.G., focusing on product innovation, collaborations, and regional expansions.
- Market restraints include raw material price volatility and stringent regulatory compliance. Regionally, Asia Pacific leads with 35% share, followed by Europe at 20% and North America at 16%, reflecting industrialization and automotive growth.
Access crucial information at unmatched prices!
Request your sample report today & start making informed decisions powered by Credence Research Inc.!
Download Sample
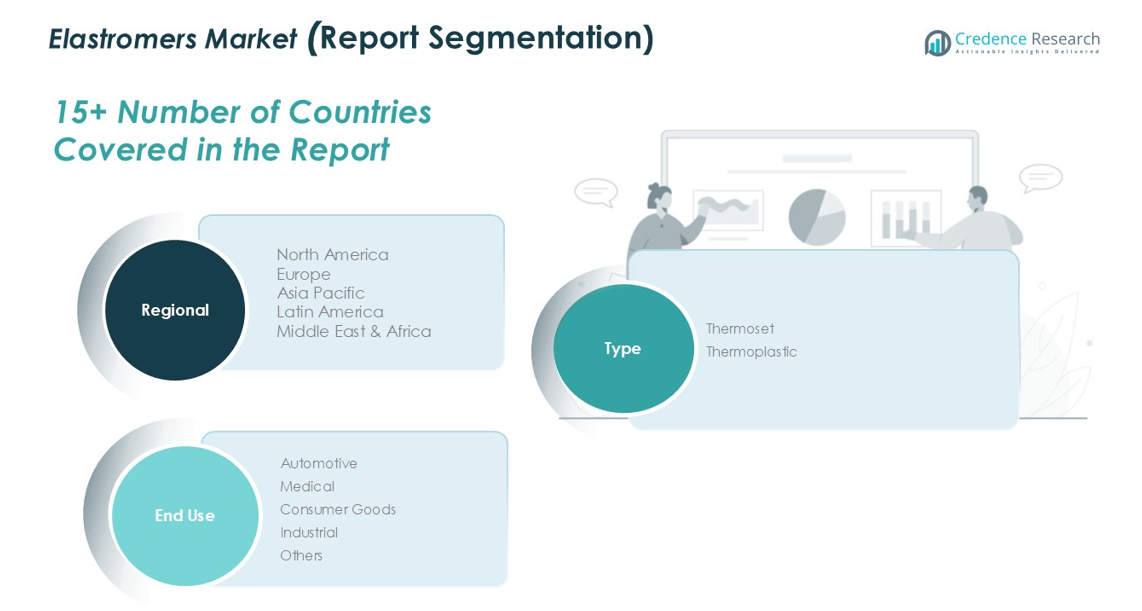
Market Segmentation Analysis:
By Type:
Thermoset elastomers dominate the market with a 58% revenue share, driven by their excellent thermal stability, chemical resistance, and durability in automotive and industrial applications. These materials are preferred for high-performance components such as seals, gaskets, and structural parts that must withstand extreme conditions. Thermoplastic elastomers hold around 42% market share, fueled by their lightweight, recyclable, and flexible properties. The increasing focus on sustainable materials, cost-efficient production, and applications in consumer goods and medical devices supports steady growth for thermoplastic elastomers globally.
- For instance, Kuraray’s styrenic block copolymer TPEs are used in consumer goods like toothbrush handles and soft-touch personal care products, offering softness and durability.
By End Use:
Automotive leads the end-use market with a 36% share, propelled by demand for fuel-efficient, durable vehicles and EV adoption. Elastomers provide vibration dampening, insulation, and component longevity. Industrial applications follow with 20% share, benefiting from thermoset elastomers’ strength and chemical resistance for machinery, gaskets, and protective coatings. Consumer goods account for 18%, supported by comfort, aesthetics, and durability in footwear, sporting goods, and appliances. Medical applications hold 15%, driven by biocompatible and sterilizable materials for devices and tubing, while the remaining 11% covers aerospace, defense, and electronics, where high-performance elastomers ensure reliability.
- For instance, nitrile rubber (Buna-N) and fluoroelastomers like Viton are widely used in hydraulic system seals and chemical processing equipment for their resistance to oils, fuels, and strong acids.
Key Growth Drivers
Rising Demand in Automotive and Industrial Applications
The growth of the automotive and industrial sectors is a primary driver for the elastomers market. Increasing demand for fuel-efficient, lightweight, and durable vehicle components encourages the adoption of thermoset and thermoplastic elastomers. In industrial applications, elastomers are crucial for machinery, seals, gaskets, and conveyor systems due to their strength, chemical resistance, and thermal stability. Expansion in manufacturing, stricter regulatory standards, and the adoption of electric vehicles further boost elastomer consumption, making these sectors key contributors to the market’s steady growth.
- For instance, Hutchinson developed a proprietary elastomer compound, 8EP3411, specifically for sealing components in electric vehicle heat pumps using the R744 (CO₂) refrigerant, which is gaining traction due to its low global warming potential (GWP of 1) and high efficiency in cold climates.
Advancements in Medical and Consumer Goods Applications
Medical and consumer goods industries are fueling elastomer market growth through rising requirements for biocompatible, sterilizable, and flexible materials. In healthcare, elastomers are used in surgical instruments, tubing, seals, and wearable devices, while in consumer products, they enhance comfort, durability, and aesthetics in footwear, sports equipment, and appliances. Increasing healthcare infrastructure, aging populations, and growing disposable incomes drive demand. The development of innovative thermoplastic elastomers with sustainable and versatile properties further accelerates adoption across these sectors, supporting robust market expansion.
- For instance, in healthcare, 3D printing advancements are enabling the use of medical-grade silicones and thermoplastic polyurethanes (TPU) to create custom prosthetics and implants with high tensile strength and biocompatibility, improving patient comfort and treatment precision.
Focus on Sustainability and Lightweight Materials
The push for sustainable and lightweight materials is propelling the elastomers market forward. Thermoplastic elastomers, with their recyclability and energy-efficient processing, are increasingly replacing traditional polymers in automotive, industrial, and consumer applications. Environmental regulations and corporate sustainability initiatives further encourage the use of eco-friendly elastomeric materials. Lightweight components reduce fuel consumption in vehicles and energy costs in machinery, creating a strong incentive for manufacturers to adopt advanced elastomers. This trend positions sustainability as a critical factor driving innovation and market growth.
Key Trends & Opportunities
Trend of Electric Vehicle and EV Component Adoption
The global shift toward electric vehicles presents a significant opportunity for elastomer manufacturers. Elastomers are vital in EV components such as battery seals, gaskets, and vibration-damping systems. As governments push for emission reduction and incentivize EV adoption, demand for high-performance elastomers that can withstand thermal and chemical stress is rising. Companies developing specialized elastomer formulations for EV applications can capture substantial market share, making this trend a lucrative growth avenue within the automotive segment.
- For instance, JBC Technologies produces custom die-cut seals and gaskets for EV batteries, using silicone foam rubbers and specialty elastomers to provide thermal insulation, fire protection, and chemical resistance critical for battery safety and durability.
Integration of Smart and Functional Materials
Integration of smart and functional elastomeric materials is emerging as a notable market trend. These materials offer properties like shape memory, conductivity, or enhanced flexibility, enabling applications in wearable electronics, medical devices, and industrial automation. The development of multifunctional elastomers supports innovation across sectors, allowing manufacturers to design high-value, customizable products. Growing R&D investments and technological collaborations drive the adoption of such advanced materials, creating opportunities for market expansion and differentiation among elastomer producers.
- For instance, Angst+Pfister Group has advanced smart sensing elastomers with embedded sensors that provide real-time monitoring of force, temperature, and vibration, boosting predictive maintenance across automotive, medical, and industrial sectors.
Key Challenges
Volatility in Raw Material Prices
Fluctuating raw material costs pose a significant challenge to the elastomers market. Key feedstocks, including petrochemical derivatives, are subject to price volatility due to supply-demand imbalances and geopolitical factors. Rising costs directly impact production expenses, potentially reducing profit margins and limiting market growth. Manufacturers are compelled to adopt cost-optimization strategies or seek alternative materials, which may affect product consistency or performance. Managing price volatility remains a critical hurdle for companies operating in the global elastomers market.
Stringent Regulatory and Environmental Compliance
Strict regulatory requirements for chemical usage, environmental impact, and product safety create challenges for elastomer manufacturers. Compliance with international standards and certifications often requires significant investment in R&D and manufacturing processes. Failure to meet regulations can result in fines, recalls, or market access restrictions. Additionally, increasing pressure for eco-friendly and low-emission products forces companies to innovate sustainable alternatives, which may involve higher costs or longer development cycles. Navigating these regulatory landscapes is a key challenge for market participants.
Regional Analysis
North America
North America holds a 16% share of the global elastomers market, driven by strong automotive and industrial sectors. The U.S. leads the region with high adoption of thermoset and thermoplastic elastomers for lightweight and durable components. Rising investments in electric vehicles and advanced manufacturing further support growth. The region’s market is projected to grow from USD 22,303.42 million in 2024 to USD 33,840.64 million by 2032 at a CAGR of 5.4%. Demand for high-performance elastomers in medical devices and consumer goods also contributes to North America’s stable expansion.
Europe
Europe captures 20% of the elastomers market, supported by well-established automotive, industrial, and consumer goods sectors. Germany, France, and Italy are key contributors, leveraging advanced manufacturing and strict emission standards to drive demand. The market is expected to increase from USD 25,223.42 million in 2024 to USD 36,624.07 million by 2032 at a CAGR of 4.8%. Adoption of sustainable thermoplastic elastomers and investments in research and innovation strengthen Europe’s position. Growth is further fueled by increasing demand for lightweight, durable components in automotive, medical, and industrial applications.
Asia Pacific
Asia Pacific dominates the elastomers market with a 35% share, driven by rapid industrialization, automotive expansion, and rising consumer goods demand. China, India, and Japan lead the region, investing heavily in electric vehicles and medical infrastructure. The market is projected to grow from USD 33,546.65 million in 2024 to USD 51,288.34 million by 2032 at a CAGR of 5.5%. Favorable government policies, rising disposable incomes, and increasing manufacturing of lightweight, durable products support the strong adoption of thermoset and thermoplastic elastomers across sectors.
Latin America
Latin America holds a 9% share of the global elastomers market, driven by automotive, industrial, and consumer goods applications in Brazil and Argentina. The market is expected to expand from USD 9,663.99 million in 2024 to USD 15,147.71 million by 2032 at a CAGR of 5.8%. Growth is fueled by rising infrastructure development, industrial automation, and increasing adoption of lightweight elastomeric components in vehicles. Thermoset elastomers dominate industrial and automotive applications, while thermoplastic variants are gaining traction in consumer products, supporting overall regional market expansion.
Middle East
The Middle East accounts for 4% of the elastomers market, led by GCC countries, Israel, and Turkey. The market is expected to rise from USD 4,349.49 million in 2024 to USD 6,841.38 million by 2032 at a CAGR of 5.9%. Growth is supported by industrial expansion, oil and gas infrastructure, and automotive components requiring durable elastomeric materials. Thermoset elastomers dominate in high-performance industrial applications, while thermoplastic elastomers are increasingly used in consumer goods and medical devices. Investments in technology and sustainable materials further enhance regional growth.
Africa
Africa holds a 2% share of the global elastomers market, with South Africa and Egypt being key contributors. The market is projected to grow from USD 1,968.85 million in 2024 to USD 2,754.13 million by 2032 at a CAGR of 4.3%. Growth is driven by industrial applications, infrastructure projects, and rising demand in automotive and consumer goods. Thermoset elastomers are preferred for heavy-duty industrial and automotive components, while thermoplastic variants support lighter consumer applications. Increasing urbanization and industrialization are expected to gradually expand elastomer adoption across the region.
Market Segmentations:
By Type:
By End Use:
- Automotive
- Medical
- Consumer Goods
- Industrial
- Others
By Region:
- North America
- Europe
- Germany
- France
- U.K.
- Italy
- Spain
- Rest of Europe
- Asia Pacific
- China
- Japan
- India
- South Korea
- South-east Asia
- Rest of Asia Pacific
- Latin America
- Brazil
- Argentina
- Rest of Latin America
- Middle East & Africa
- GCC Countries
- South Africa
- Rest of the Middle East and Africa
Competitive Landscape
The competitive landscape of the elastomers market is led by key players including BASF S.E., Covestro A.G., Huntsman Corporation, DowDupont Inc., Lanxess A.G., Zeon Chemicals L.P., Kuraray Co., Ltd., and Wacker Chemie AG. These companies focus on strategic initiatives such as product innovation, mergers and acquisitions, and regional expansions to strengthen their market presence. Investments in research and development enable the introduction of advanced thermoset and thermoplastic elastomers catering to automotive, medical, industrial, and consumer applications. Companies are increasingly emphasizing sustainable and lightweight materials to meet environmental regulations and evolving customer demands. Partnerships with end-use industries and technology collaborations further enhance their competitive positioning. The market remains moderately consolidated, with established players leveraging scale, technological expertise, and global distribution networks to maintain leadership, while emerging companies focus on niche applications and regional growth opportunities to capture market share.
Shape Your Report to Specific Countries or Regions & Enjoy 30% Off!
Key Player Analysis
- BASF S.E.
- Covestro A.G.
- Huntsman Corporation
- DowDupont Inc.
- Lanxess A.G.
- Zeon Chemicals L.P.
- Kuraray Co., Ltd.
- Wacker Chemie AG
- Other Key Players
Recent Developments
- In October 2024, Covestro announced a €14.7 billion acquisition by Abu Dhabi National Oil Company (ADNOC), marking ADNOC’s largest acquisition to date. The deal is expected to close in the second half of 2025, pending regulatory approvals.
- In September 2025, Angst+Pfister Group introduced smart elastomers with embedded sensors capable of real-time monitoring of force, temperature, and vibration, targeting automotive, medical, and industrial markets.
- In 2024, Dow launched a bio-based NORDEL REN EPDM elastomer produced using ISCC PLUS-certified mass-balance feedstocks, targeted for automotive seals and infrastructure gasket applications.
- In 2023, Avient Corporation launched at least two distinct recycled-content thermoplastic elastomers (TPEs) under its reSound REC product portfolio.
Report Coverage
The research report offers an in-depth analysis based on Type, End Use, and Region. It details leading market players, providing an overview of their business, product offerings, investments, revenue streams, and key applications. Additionally, the report includes insights into the competitive environment, SWOT analysis, current market trends, as well as the primary drivers and constraints. Furthermore, it discusses various factors that have driven market expansion in recent years. The report also explores market dynamics, regulatory scenarios, and technological advancements that are shaping the industry. It assesses the impact of external factors and global economic changes on market growth. Lastly, it provides strategic recommendations for new entrants and established companies to navigate the complexities of the market.
Future Outlook
- The market is expected to grow steadily due to increasing demand from automotive and industrial sectors.
- Electric vehicle adoption will drive the need for advanced elastomeric components.
- Thermoplastic elastomers will gain traction because of their recyclability and process flexibility.
- Demand in medical applications will rise with the expansion of healthcare infrastructure and biocompatible materials.
- Consumer goods will continue to drive growth through footwear, sports equipment, and household applications.
- Industrial applications will benefit from automation and infrastructure development requiring durable materials.
- Focus on lightweight and sustainable materials will shape product innovation and adoption.
- Smart and functional elastomers will create opportunities in electronics, wearables, and advanced devices.
- Emerging markets will see higher growth due to urbanization and rising disposable incomes.
- Strategic partnerships, technological collaborations, and R&D will strengthen market competitiveness and expansion.


