
Market Overview
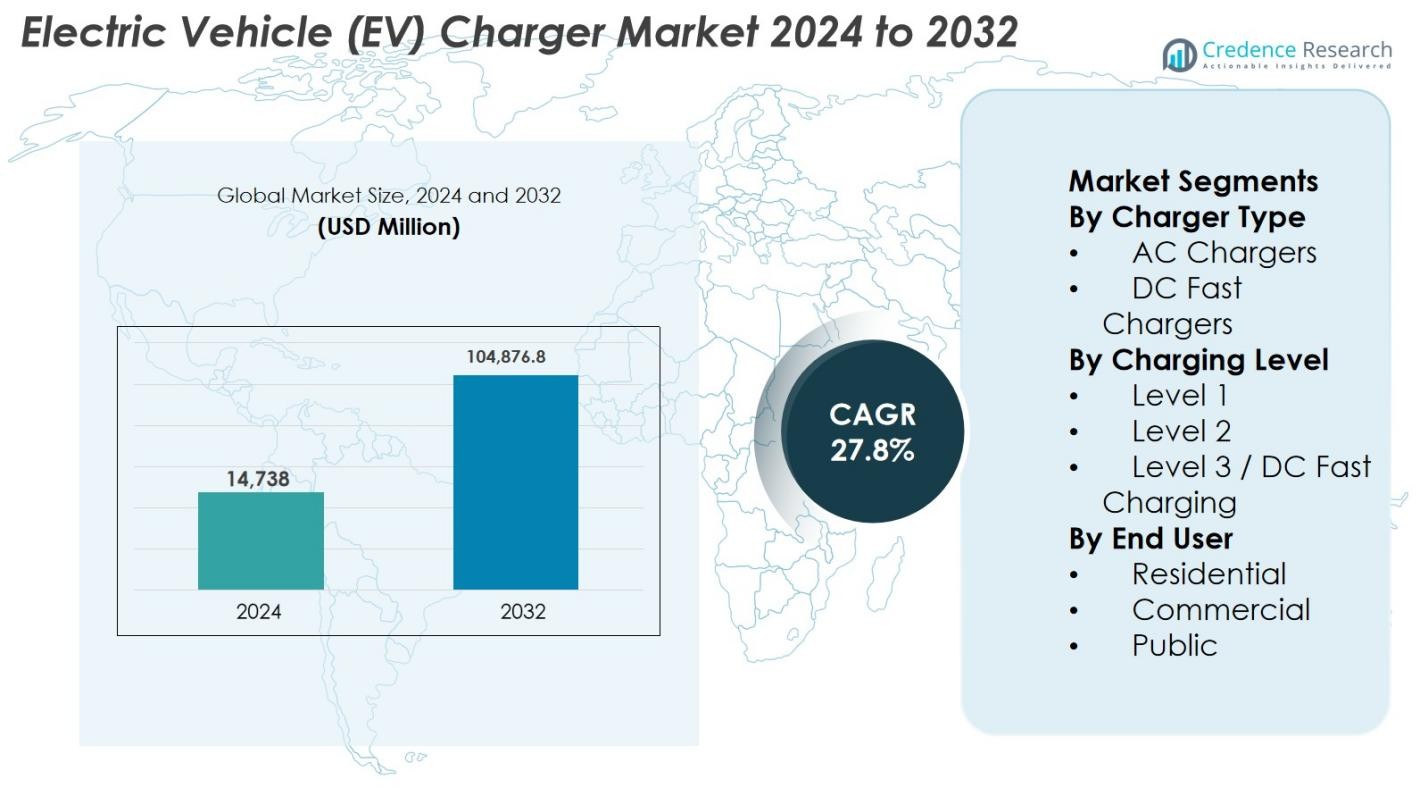
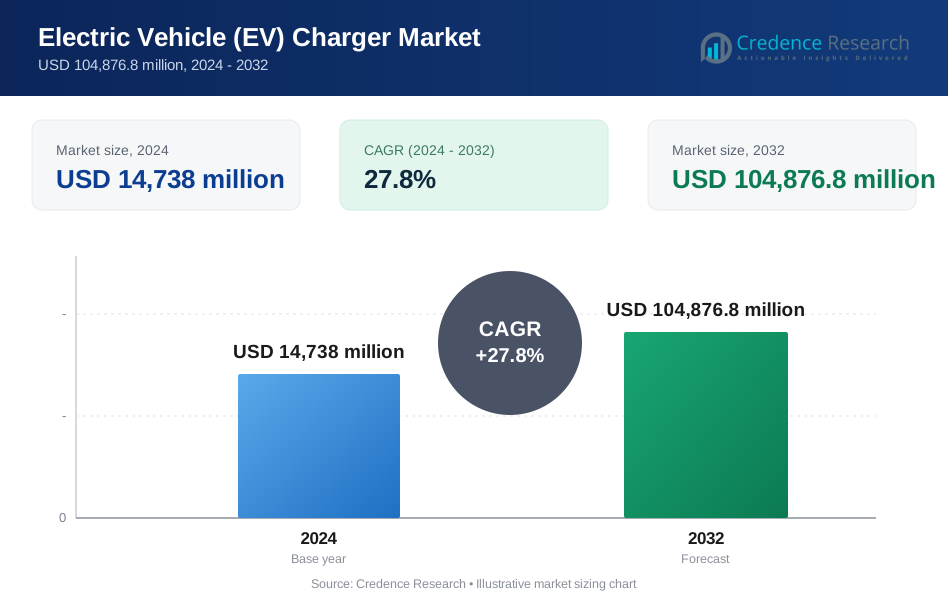
Electric Vehicle (EV) Charger Market size was valued at USD 14,738 million in 2024 and is anticipated to reach USD 104,876.8 million by 2032, growing at a CAGR of 27.8% during the forecast period.
| REPORT ATTRIBUTE | DETAILS |
|---|---|
| Historical Period | 2020-2023 |
| Base Year | 2024 |
| Forecast Period | 2025-2032 |
| Electric Vehicle (EV) Charger Market Size 2024 | USD 14,738 Million |
| Electric Vehicle (EV) Charger Market, CAGR | 27.8% |
| Electric Vehicle (EV) Charger Market Size 2032 | USD 104,876.8 Million |
Electric Vehicle (EV) Charger market is driven by the strong presence of established power technology providers and specialized charging network operators that focus on scalable, high-efficiency charging solutions. Leading players such as Tesla, ChargePoint, ABB, Siemens, Schneider Electric, EVBox, Blink Charging, Delta Electronics, Tritium, and Webasto compete through continuous innovation in AC and DC fast charging, smart charging software, and grid-integrated systems. The market demonstrates strong regional concentration, with North America leading at 34% market share, supported by large-scale public charging deployments, fleet electrification, and government-backed infrastructure programs. Europe follows with robust regulatory support and standardized charging frameworks, while Asia Pacific shows rapid expansion driven by mass EV adoption and public charging investments.
Market Insights
- Electric Vehicle (EV) Charger market was valued at USD 14,738 million in 2024 and is anticipated to reach USD 104,876.8 million by 2032, growing at a CAGR of 27.8% during the forecast period, supported by rapid electrification of transportation and large-scale charging infrastructure expansion.
- Rising electric vehicle adoption, government incentives, and large-scale investments in public and commercial charging networks are key drivers accelerating charger deployment across residential, fleet, and highway applications.
- Increasing focus on DC fast charging and smart charging solutions represents a major market trend, with Level 2 chargers holding around 55% segment share due to their cost efficiency and versatility.
- The market is moderately consolidated, with global players focusing on technology innovation, strategic partnerships, and geographic expansion to strengthen competitive positioning and network scale.
- North America leads the market with approximately 34% regional share, followed by Europe at 29% and Asia Pacific at 27%, reflecting strong policy support, EV adoption rates, and infrastructure investments across these regions.
 Market Segmentation Analysis:
By Charger Type
The Electric Vehicle (EV) Charger market by charger type is led by AC chargers, which account for 62% market share due to their widespread adoption in residential and workplace environments. AC chargers benefit from lower installation costs, grid compatibility, and suitability for overnight or long-duration charging. Their dominance is reinforced by increasing home EV ownership, government incentives for residential charging infrastructure, and growing deployment in offices and apartment complexes. Meanwhile, DC fast chargers continue to gain traction in highway corridors and urban hubs, driven by the need for rapid charging and reduced vehicle downtime.
- For instance, Tesla’s Wall Connector provides up to 11.5 kW (48 A) of AC charging power, adding up to 44 miles of range per hour on compatible vehicles, making it ideal for home charging environments.
By Charging Level
By charging level, Level 2 chargers dominate the market with 55% share, supported by their balanced charging speed, affordability, and versatility across residential, commercial, and public settings. Level 2 chargers offer significantly faster charging than Level 1 while avoiding the high infrastructure costs associated with Level 3 systems. Their adoption is driven by expanding workplace charging programs, retail installations, and municipal projects. Level 3/DC fast charging is growing rapidly, fueled by long-distance travel demand and fleet electrification, while Level 1 remains limited to basic residential use cases.
- For instance, ABB’s Terra 360 DC charger offers up to 360 kW of output, enabling rapid charging for highway corridors and high-utilization urban hubs.
By End Use
In terms of end use, the public charging segment holds the largest share at 48%, driven by large-scale investments in urban charging networks, highways, and transit corridors. Governments and private operators are accelerating public charger deployment to address range anxiety and support mass EV adoption. Commercial charging also shows strong growth, supported by fleet electrification, retail charging, and workplace installations. Residential charging remains essential, driven by home EV ownership, but its growth is comparatively moderate due to increasing reliance on shared and fast-charging infrastructure in densely populated regions.
Key Growth Drivers
Rapid Expansion of Electric Vehicle Adoption
The accelerating adoption of electric vehicles globally is a fundamental growth driver for the Electric Vehicle (EV) Charger market. Governments are enforcing stricter emission norms, fuel efficiency regulations, and ICE phase-out targets, encouraging consumers and fleets to transition toward EVs. Rising EV sales directly increase demand for dependable charging infrastructure across residential, commercial, and public locations. Automakers are expanding EV model offerings across multiple vehicle categories, further widening charging requirements. In addition, improvements in battery technology and increasing vehicle range are boosting daily charging needs, compelling utilities, municipalities, and private operators to accelerate charger deployment worldwide.
- For instance, the U.S. Environmental Protection Agency’s Multi-Pollutant Emissions Standards (2024), which tighten fleet emission limits and incentivize automakers and commercial fleets to transition toward electric vehicles, increasing demand for workplace and public chargers.
Strong Government Support and Infrastructure Investments
Government policies and large-scale infrastructure investments significantly accelerate EV charger market growth. Financial incentives such as subsidies, tax credits, and installation grants reduce upfront costs for charger deployment. Public–private partnerships support the rollout of highway fast-charging corridors, urban charging hubs, and transit-oriented infrastructure. Regulatory mandates increasingly require EV-ready provisions in new residential and commercial buildings. These initiatives create a favorable environment for charger manufacturers and network operators, ensuring sustained infrastructure expansion aligned with national electrification and decarbonization strategies.
- For instance, in December 2024, Texas opened its first NEVI site with four ABB Terra 184 chargers delivering up to 180 kW per port and offering CCS + J3400 (NACS) connectors to support broad vehicle compatibility.
Growth of Fleet Electrification and Commercial Charging
The rapid electrification of commercial and public fleets is a major driver of EV charger demand. Logistics companies, ride-hailing platforms, public transport agencies, and corporate fleets are shifting to EVs to reduce operating costs and meet sustainability targets. This transition requires high-capacity, reliable charging solutions, particularly Level 2 and DC fast chargers. Fleet depots, warehouses, and workplace charging installations are expanding rapidly to support structured charging cycles. Demand for uptime optimization, scalability, and energy management further strengthens market growth.
Key Trends & Opportunities
Expansion of DC Fast Charging Networks
The expansion of DC fast charging infrastructure is a prominent trend creating strong market opportunities. Increasing EV penetration heightens demand for rapid charging solutions that minimize vehicle downtime and support long-distance travel. Governments and private players are prioritizing high-power chargers along highways and in urban centers. Technological advancements in power electronics and cooling systems enable higher charging capacities. This trend offers growth opportunities for manufacturers providing high-performance, modular, and grid-integrated fast-charging solutions.
- For instance, Siemens’ Sicharge D, which supports scalable charging up to 300 kW with advanced power electronics and dynamic load management, enabling efficient deployment in city charging depots and transit centers.
Integration of Smart Charging and Energy Management
Smart charging solutions are emerging as a key opportunity in the EV charger market. Advanced software platforms enable real-time monitoring, load balancing, dynamic pricing, and demand response capabilities. These features help utilities manage grid loads while reducing energy costs for users. Integration with renewable energy sources and energy storage systems enhances grid resilience and sustainability. Vendors offering interoperable, software-driven charging ecosystems are positioned to benefit from long-term value creation.
- For instance, Schneider Electric’s EcoStruxure EV Charging Expert, which dynamically allocates available power across multiple chargers and integrates with on-site solar and building energy management systems to reduce energy costs.
Key Challenges
High Infrastructure Costs and Grid Limitations
High infrastructure and installation costs pose a major challenge to EV charger deployment. DC fast charging systems require significant investments in electrical upgrades, transformers, and grid connections. In many regions, existing grid infrastructure struggles to support high-power loads, causing delays and cost escalations. Complex permitting processes and site preparation further extend deployment timelines. These factors can slow network expansion, particularly in emerging and rural markets.
Interoperability, Standardization, and Utilization Issues
Interoperability and standardization challenges continue to impact the EV charger market. Multiple connector types, charging protocols, and software platforms create compatibility issues and fragmented user experiences. Inconsistent network access and payment systems reduce charger utilization efficiency. Additionally, uneven charger distribution leads to congestion in high-demand areas and underutilization elsewhere. Addressing these challenges requires industry-wide collaboration, regulatory alignment, and harmonized technical standards to support scalable and user-friendly charging networks.
Regional Analysis
North America
North America holds a leading position in the Electric Vehicle (EV) Charger market with an 34% market share, driven by strong EV adoption, supportive federal and state policies, and large-scale infrastructure investments. The United States dominates regional demand due to extensive deployment of public and commercial charging networks, supported by government funding programs and private investments. Fleet electrification across logistics, transit, and corporate mobility further boosts charger installations. High consumer awareness, expanding fast-charging corridors, and the presence of major charging network operators continue to strengthen North America’s market leadership.
Europe
Europe accounts for 29% of the global EV charger market share, supported by stringent emission regulations and aggressive decarbonization targets. Countries such as Germany, the Netherlands, France, and the Nordic region are leading charger deployment across residential, commercial, and public segments. Strong policy frameworks, incentives for EV purchases, and mandates for EV-ready buildings drive infrastructure expansion. Europe’s focus on interoperability, standardized connectors, and cross-border charging networks enhances user convenience and supports steady market growth.
Asia Pacific
Asia Pacific represents the fastest-growing region, capturing 27% market share, driven by large-scale EV adoption in China, Japan, South Korea, and emerging Southeast Asian markets. China leads regional charger installations through strong government mandates and extensive public charging programs. Rapid urbanization, expanding electric two-wheeler adoption, and growing passenger EV sales increase charging demand. Strong domestic manufacturing capabilities and investments in fast-charging and smart infrastructure position the region as a key growth engine.
Latin America
Latin America holds 6% of the Electric Vehicle (EV) Charger market share, supported by gradual EV adoption and increasing focus on sustainable mobility. Brazil, Mexico, and Chile are leading infrastructure development through public transport electrification and urban charging projects. Although deployment remains limited, rising fuel costs and environmental policies are encouraging EV usage. Public–private partnerships and pilot charging corridors continue to expand regional networks and improve market penetration.
Middle East & Africa
The Middle East & Africa region accounts for about 4% market share, driven by early-stage EV adoption and sustainability initiatives. Gulf countries are investing in smart city projects and public charging hubs to support clean mobility goals. Government-led diversification strategies and renewable energy integration support infrastructure deployment. In Africa, EV charger adoption remains nascent but is gradually emerging through pilot programs and urban electrification initiatives, indicating long-term growth potential.
Market Segmentations:
By Charger Type
- AC Chargers
- DC Fast Chargers
By Charging Level
- Level 1
- Level 2
- Level 3 / DC Fast Charging
By End User
- Residential
- Commercial
- Public
By Geography
- North America
- U.S.
- Canada
- Mexico
- Europe
- Germany
- France
- U.K.
- Italy
- Spain
- Rest of Europe
- Asia Pacific
- China
- Japan
- India
- South Korea
- South-east Asia
- Rest of Asia Pacific
- Latin America
- Brazil
- Argentina
- Rest of Latin America
- Middle East & Africa
- GCC Countries
- South Africa
- Rest of the Middle East and Africa
Competitive Landscape
The Electric Vehicle (EV) Charger market features a dynamic competitive landscape characterized by strong competition among global technology providers, power equipment manufacturers, and specialized charging network operators. Key players such as Tesla, ChargePoint, ABB, Siemens, Schneider Electric, EVBox, Blink Charging, Delta Electronics, Tritium, and Webasto focus on expanding product portfolios across AC and DC fast charging segments to address diverse end-use requirements. Companies emphasize innovation in high-power charging, smart energy management, and software-driven platforms to improve charger efficiency, uptime, and user experience. Strategic partnerships with utilities, automakers, and governments are widely adopted to accelerate network deployment and secure long-term contracts. Players are also investing in regional expansion, particularly in high-growth markets, while strengthening after-sales service and interoperability capabilities. Continuous advancements in fast-charging technologies and grid-integrated solutions remain central to sustaining competitive positioning.
Key Player Analysis
- Tesla, Inc.
- ChargePoint Holdings, Inc.
- ABB Ltd.
- Siemens AG
- Schneider Electric SE
- EVBox Group
- Blink Charging Co.
- Tritium DCFC Limited
- Delta Electronics, Inc.
- Webasto Group
Recent Developments
- In December 2025, ChargePoint announced that all new hardware now supports the “Plug & Charge” seamless EV charging standard, improving user experience and interoperability across EV chargers.
- In May 2025, Eaton and ChargePoint entered a strategic partnership to streamline design, deployment, and management of EV charging infrastructure projects, aimed at reducing cost and enhancing reliability for customers
- In August 2024, Exicom Tele-Systems acquired EV charging manufacturer Tritium, preserving jobs and expanding global manufacturing capacity for DC fast chargers.
Report Coverage
The research report offers an in-depth analysis based on Charger Type, Charging Level, End-User and Geography. It details leading market players, providing an overview of their business, product offerings, investments, revenue streams, and key applications. Additionally, the report includes insights into the competitive environment, SWOT analysis, current market trends, as well as the primary drivers and constraints. Furthermore, it discusses various factors that have driven market expansion in recent years. The report also explores market dynamics, regulatory scenarios, and technological advancements that are shaping the industry. It assesses the impact of external factors and global economic changes on market growth. Lastly, it provides strategic recommendations for new entrants and established companies to navigate the complexities of the market.
Future Outlook
- Electric vehicle adoption will continue to accelerate, driving sustained demand for residential, commercial, and public charging infrastructure.
- Expansion of DC fast charging networks will remain a priority to support long-distance travel and high-utilization applications.
- Level 2 chargers will maintain strong adoption due to their balance of charging speed, cost efficiency, and installation flexibility.
- Smart charging and software integration will increasingly optimize energy management, grid stability, and user experience.
- Governments will strengthen policies and incentives to accelerate charger deployment and meet decarbonization targets.
- Fleet electrification will create consistent demand for high-capacity and reliable charging solutions.
- Integration of renewable energy and energy storage with charging infrastructure will improve sustainability and grid resilience.
- Standardization and interoperability efforts will enhance network accessibility and charger utilization.
- Urbanization and smart city initiatives will support dense public charging installations in metropolitan areas.
- Emerging markets will witness faster infrastructure development as EV affordability and policy support improve.
Request a Free Sample
Fill in your details and we'll send you a free sample report.
- Sample data tables & charts
- Research methodology
Need a Custom Version of This Report?
Tailor the scope, geography, or segments to your exact requirements.
- Custom geography or segment scope
- Direct access to our analyst team
Frequently Asked Questions
What is the current market size for Electric Vehicle (EV) Charger market, and what is its projected size in 2032?
At what Compound Annual Growth Rate is the Electric Vehicle (EV) Charger market projected to grow between 2024 and 2032?
Which Electric Vehicle (EV) Charger market segment held the largest share in 2024?
What are the primary factors fueling the growth of the Electric Vehicle (EV) Charger market?
Who are the leading companies in the Electric Vehicle (EV) Charger market?
Which region commanded the largest share of the Electric Vehicle (EV) Charger market in 2024?
Table of Content
Chapter 1. Report Introduction
- 1.1 Report Description & Purpose
- 1.1.1 Report Title & Market Definition
- 1.1.2 Unique Selling Propositions (USP) & Key Differentiators
- 1.1.3 Value Proposition for Stakeholders
- 1.2 Research Objectives
- 1.2.1 Market Sizing Objectives (Volume & Revenue)
- 1.2.2 Segmentation Objectives
- 1.2.3 Competitive Intelligence Objectives
- 1.2.4 Forecast & Scenario Objectives
- 1.3 Report Scope
- 1.3.1 Electric Vehicle (EV) Charger Scope – Types & Subtypes Covered
- 1.3.2 Geographic Scope – Regions & Countries Covered
- 1.3.3 Historical Period, Base Year & Forecast Period (2024; forecast to 2032)
- 1.3.4 Inclusions & Exclusions
- 1.4 HS Code & Classification Framework
- 1.5 Currency, Units & Pricing Basis
- 1.6 Target Stakeholders
- 1.7 Limitations & Assumptions
Chapter 2. Executive Summary
- 2.1 Global Electric Vehicle (EV) Charger Market Snapshot
- 2.1.1 Market Size – Historical (2024) & Forecast (2024-2032) (2024: USD 14,738 million → 2032: USD 104,876.8 million)
- 2.1.2 Volume & Revenue – Global Totals
- 2.1.3 Key Market Highlights – Top Five Facts
- 2.2 Electric Vehicle (EV) Charger Market Segmentation Snapshot
- 2.2.1 Market Split by Region – 2024 vs. 2032
- 2.3 Competitive Snapshot
- 2.3.1 Top 10 Players by Revenue Share – 2024
- 2.3.2 Top 10 Players by Volume Share – 2024
- 2.3.3 Recent Strategic Developments (18-Month Summary)
- 2.4 Key Investment Highlights & Strategic Conclusions
Chapter 3. Electric Vehicle (EV) Charger Market Dynamics & Industry Analysis
- 3.1 Market Overview & Context
- 3.1.1 Electric Vehicle (EV) Charger Market Position in the Broader Automotive Value Chain
- 3.1.2 OEM vs. Replacement Market Dynamics
- 3.1.3 Market Maturity & Development Stage by Region
- 3.2 Electric Vehicle (EV) Charger Market Drivers
- 3.3 Electric Vehicle (EV) Charger Market Restraints & Challenges
- 3.4 Electric Vehicle (EV) Charger Market Opportunities
- 3.5 Porter's Five Forces Analysis
- 3.5.1 Threat of New Entrants
- 3.5.2 Bargaining Power of Suppliers
- 3.5.3 Bargaining Power of Buyers
- 3.5.4 Threat of Substitutes
- 3.5.5 Competitive Rivalry – Intensity Assessment
- 3.6 Electric Vehicle (EV) Charger Value Chain Analysis
- 3.6.1 Upstream – Raw Material/Input Suppliers
- 3.6.1.1 Raw Material/Input 1
- 3.6.1.2 Raw Material/Input 2
- 3.6.1.3 Raw Material/Input 3
- 3.6.2 Midstream – Production/Manufacturing/Service Delivery
- 3.6.2.1 Production/Process Overview
- 3.6.2.2 Key Facility Locations & Capacity by Manufacturer
- 3.6.3 Downstream – Distribution & End Consumer
- 3.6.3.1 Primary Channel – B2B/OEM
- 3.6.3.2 Secondary Channels – Dealer, Retail, Online, Direct
- 3.6.4 Value Chain Profitability Analysis
- 3.6.1 Upstream – Raw Material/Input Suppliers
- 3.7 PESTEL Analysis
- 3.7.1 Political Factors
- 3.7.2 Economic Factors
- 3.7.3 Social Factors
- 3.7.4 Technological Factors
- 3.7.5 Environmental Factors
- 3.7.6 Legal Factors
- 3.8 Electric Vehicle (EV) Charger Supply Chain Analysis
- 3.8.1 Raw Material/Input Supply Risk Assessment
- 3.8.2 Manufacturing Concentration Risk (Geographic Exposure)
- 3.8.3 Trade Disruption Impact Analysis
- 3.9 Regulatory & Policy Landscape
Note: The regulatory and policy landscape section covers regulations based on their applicability to the market, Electric Vehicle (EV) Charger category, geography, and scope of the study. Only regulatory frameworks with a material impact on operations, compliance, trade, sustainability, or market access are analyzed in detail.
Chapter 4. Key Investment Pockets & Opportunity Analysis
- 4.1 Electric Vehicle (EV) Charger Market Attractiveness Analysis
- 4.1.1 By Region – Investment Attractiveness Matrix (Volume × CAGR)
- 4.2 Absolute Revenue Growth Opportunity
- 4.2.1 By Region – Absolute USD Growth Through 2032
- 4.3 Incremental Volume Opportunity
- 4.3.1 By Region – Incremental Volume Through 2032
- 4.3.2 Segment – Incremental Volume
- 4.4 Emerging Submarket Opportunity Deep Dive (Subject to Applicability)
- 4.5 Emerging Market Opportunity Scorecards
- 4.5.1 United States
- 4.5.2 Europe
- 4.5.3 Asia
- 4.5.4 Middle East & Africa
Note: Emerging Market Opportunity Scorecards will be included based on relevance and strategic importance. Regions listed are indicative and may vary depending on data availability and market dynamics.
Chapter 5. Electric Vehicle (EV) Charger Import-Export Analysis & Trade Flows
- 5.1 Global Trade Overview
- 5.1.1 Global Export Value by Country (2024)
- 5.1.2 Global Export Volume by Country (2024)
- 5.1.3 Global Import Value by Country (2024)
- 5.1.4 Global Import Volume by Country (2024)
- 5.1.5 Net Trade Balance by Country (2024)
- 5.2 Export Analysis – Segment
- 5.2.1 Type 1 (HS Code)
- 5.2.2 Type 2 (HS Code)
- 5.2.3 Type 3 (HS Code)
- 5.2.4 Type 4 (HS Code)
- 5.2.5 Type 5 (HS Code)
- 5.3 Import Analysis – Segment
- 5.3.1 Type 1 (HS Code)
- 5.3.2 Type 2 (HS Code)
- 5.3.3 Type 3 (HS Code)
- 5.3.4 Type 4 (HS Code)
- 5.3.5 Type 5 (HS Code)
- 5.4 Average Unit Trade Prices
- 5.4.1 Average Export Price – Segment & Country
- 5.4.2 Average Import Price – Segment & Source Country
- 5.4.3 Price Trends (2024)
- 5.5 Key Trade Route Analysis
- 5.5.1 Trade Route 1
- 5.5.2 Trade Route 2
- 5.5.3 Trade Route 3
- 5.5.4 Trade Route 4
- 5.5.5 Trade Route 5
- 5.6 Trade Policy Impact Assessment
- 5.6.1 US Anti-Dumping & Section 301 Tariffs
- 5.6.2 EU Customs Union Impact
- 5.6.3 Major Free Trade Agreements
- 5.6.4 USMCA Rules of Origin
Note: Trade policy analysis will be included only where relevant to the Electric Vehicle (EV) Charger market.
Chapter 6. Competitive Landscape & Company Benchmarking
- 6.1 Electric Vehicle (EV) Charger Market Concentration & Structure
- 6.1.1 Herfindahl-Hirschman Index (HHI) – vs. 2024
- 6.1.2 Tier 1, Tier 2 & Tier 3 Market Structure
- 6.1.3 Global, Regional & Local Player Dynamics
- 6.2 Electric Vehicle (EV) Charger Market Share Analysis – 2024
- 6.2.1 Global Revenue Share by Company
- 6.2.2 Global Volume Share by Company
- 6.2.3 Regional Revenue Share
- 6.2.4 Market Share Evolution ( vs. 2024)
- 6.2.5 OEM Segment Share by Company
- 6.2.6 Replacement Segment Share by Company
- 6.3 Production/Delivery Capacity & Facility Analysis
- 6.3.1 Global Installed Capacity
- 6.3.2 Capacity Utilization Rates
- 6.3.3 Production/Output Volume
- 6.3.4 Facility Locations & Capacity Map
- 6.3.5 Planned Capacity Additions
- 6.4 Electric Vehicle (EV) Charger Competitive Benchmarking Matrix
- 6.4.1 Revenue, Volume, CAGR & Profitability Comparison
- 6.4.2 Channel Revenue Mix
- 6.4.3 Geographic Revenue Exposure
- 6.4.4 R&D Intensity
- 6.4.5 Sustainability Maturity
- 6.5 Strategic Developments in Electric Vehicle (EV) Charger (Last 24 Months)
- 6.5.1 Mergers, Acquisitions & Divestments
- 6.5.2 New Electric Vehicle (EV) Charger Launches
- 6.5.3 Facility Expansions
- 6.5.4 Strategic Alliances, Joint Ventures & Partnerships
- 6.5.5 Distribution Expansion & Market Entry
- 6.5.6 Sustainability & ESG Initiatives
- 6.6 Competitive Strategy Mapping
- 6.6.1 Leader, Challenger, Follower & Niche Classification
- 6.6.2 Pricing Strategy Comparison
- 6.6.3 Channel Strategy Matrix
Note: Strategic developments are included based on their materiality and the availability of reliable information.
Chapter 7. Global Electric Vehicle (EV) Charger Market – By Distribution Channel
- 7.1 Segment Overview
- 7.1.1 Volume & Revenue Split by Channel (2024 & 2032)
- 7.1.2 Channel Mix Evolution (2024-2032)
Chapter 8. Regional Market Analysis – Global Overview
- 8.1 Global Regional Overview
- 8.1.1 Regional Volume Share
- 8.1.2 Regional Revenue Share
- 8.1.3 Regional Volume by Region
- 8.1.4 Regional Revenue by Region
- 8.1.5 Regional Forecast Through 2032
- 8.2 Cross-Regional Segment Analysis
- 8.2.1 By Distribution Channel
- 8.2.2 By Brand/Price Tier
Chapter 9. North America Electric Vehicle (EV) Charger Market
- 9.1 United States
- 9.2 Canada
- 9.3 Mexico
Chapter 10. Europe Electric Vehicle (EV) Charger Market
- 10.1 Germany
- 10.2 France
- 10.3 Italy
- 10.4 United Kingdom
- 10.5 Spain
- 10.6 Poland
- 10.7 Russia
- 10.8 Netherlands
- 10.9 Belgium
- 10.10 Sweden
- 10.11 Denmark
- 10.12 Norway
- 10.13 Rest of Europe
Chapter 11. Asia Pacific Electric Vehicle (EV) Charger Market
- 11.1 China
- 11.2 India
- 11.3 Japan
- 11.4 South Korea
- 11.5 Thailand
- 11.6 Indonesia
- 11.7 Vietnam
- 11.8 Malaysia
- 11.9 Australia
- 11.10 Rest of Asia Pacific
Chapter 12. Latin America Electric Vehicle (EV) Charger Market
- 12.1 Brazil
- 12.2 Argentina
- 12.3 Colombia
- 12.4 Chile
- 12.5 Rest of Latin America
Chapter 13. Middle East Electric Vehicle (EV) Charger Market
- 13.1 Saudi Arabia
- 13.2 United Arab Emirates
- 13.3 Turkey
- 13.4 Israel
- 13.5 Iran
- 13.6 Rest of the Middle East
Chapter 14. Africa Electric Vehicle (EV) Charger Market
- 14.1 South Africa
- 14.2 Egypt
- 14.3 Nigeria
- 14.4 Morocco
- 14.5 Rest of Africa
Chapter 15. Electric Vehicle (EV) Charger Company Profiles
- 15.1 [Company 01]
- 15.1.1 Company Overview
- 15.1.2 Key Management Personnel
- 15.1.3 Products & Services Portfolio
- 15.1.4 Financial Performance
- 15.1.5 Key Market Focus & Geographic Presence
- 15.1.6 Recent Developments & Strategic Initiatives
Note: The company profile list is preliminary and may change based on research findings, market developments, data availability, and client requirements.
Chapter 16. Appendices
- Appendix A – List of Abbreviations & Acronyms
- Appendix B – Industry Classification Code Reference – Full Series
- Appendix C – Production & Capacity Data Tables
- Appendix D – End-Use & Demand Base Tables
- Appendix E – Consumption & Replacement Rate Assumptions
- Appendix F – ASP Reference Tables
- Appendix G – Manufacturing & Facility Database
- Appendix H – Import-Export Data Tables
- Appendix I – Regulatory Summary Tables
- Appendix J – Primary Research Participant List (Anonymized)
- Appendix K – Primary Research Questionnaire Framework
- Appendix L – Data Sources & Bibliography
- Appendix M – Market Size Divergence & Source Comparison
Chapter 17. Research Methodology
- 17.1 Research Framework & Philosophy
- 17.2 Secondary Research – Sources, Hierarchy & Data Extraction
- 17.3 Data Modeling – Bottom-Up & Top-Down Market Sizing
- 17.4 Primary Research – Stakeholder Framework, LOI & Sample Sizes
- 17.5 Forecast Methodology – Regression, Scenario & Sensitivity Analysis
- 17.6 Quality Control – Four-Layer Validation Framework
- 17.7 Limitations & Standard Assumptions
- 17.8 Disclaimer
