
Market Overview
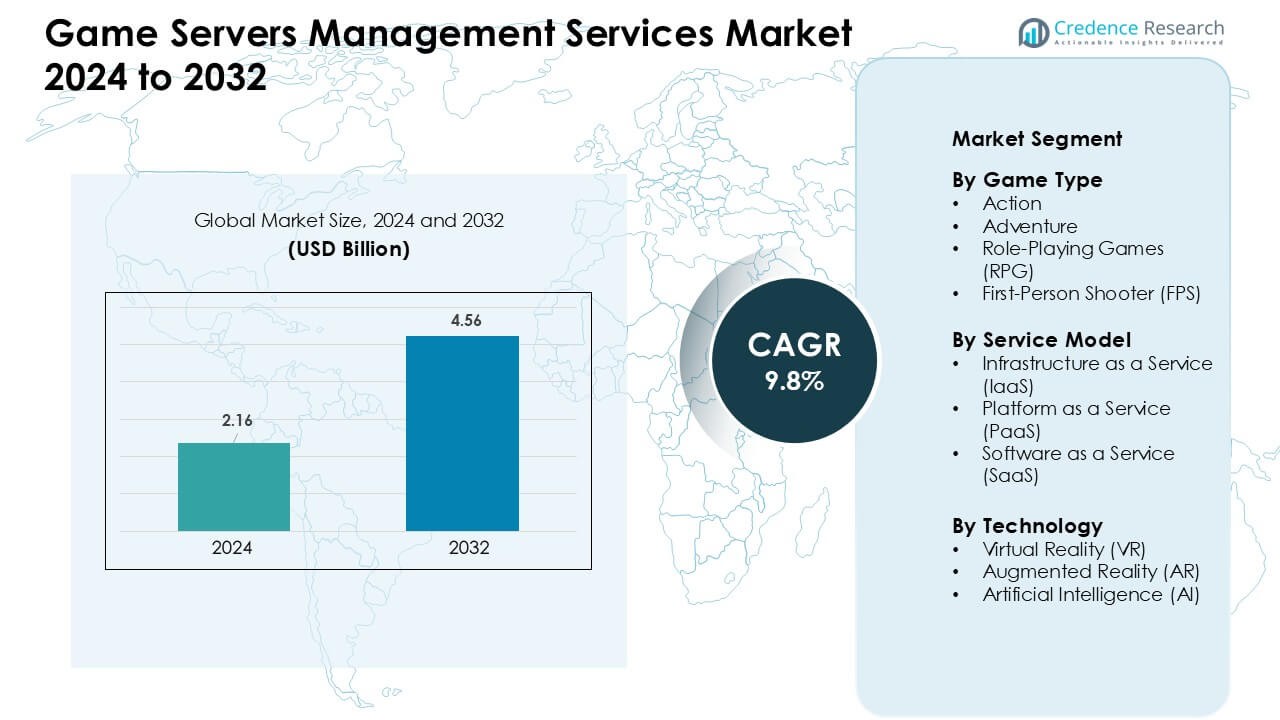
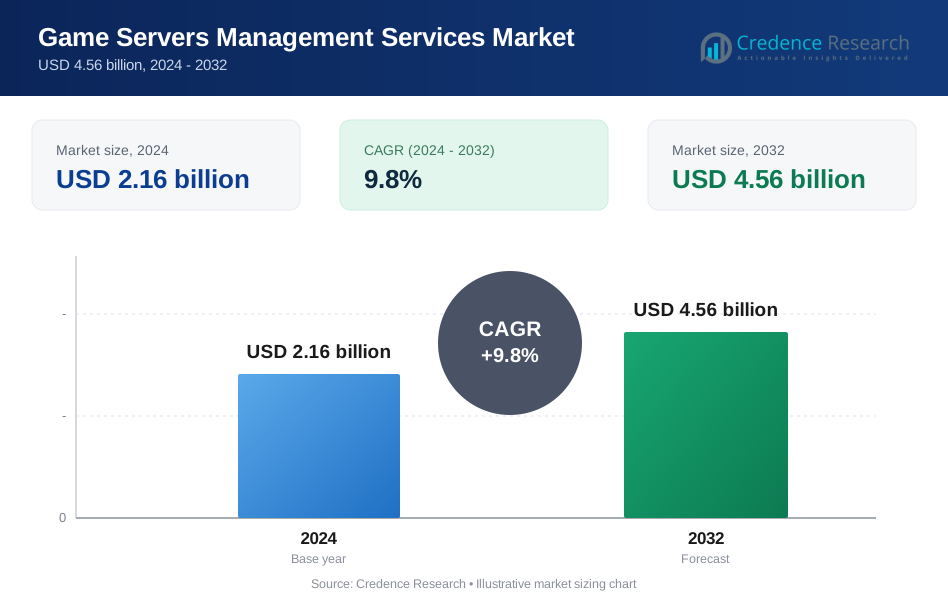
Game Servers Management Services Market was valued at USD 2.16 billion in 2024 and is anticipated to reach USD 4.56 billion by 2032, growing at a CAGR of 9.8 % during the forecast period.
| REPORT ATTRIBUTE | DETAILS |
|---|---|
| Historical Period | 2020-2023 |
| Base Year | 2024 |
| Forecast Period | 2025-2032 |
| Game Servers Management Services Market Size 2024 | USD 2.16 Billion |
| Game Servers Management Services Market, CAGR | 9.8 % |
| Game Servers Management Services Market Size 2032 | USD 4.56 Billion |
The Game Servers Management Services Market is shaped by key players such as Tencent Holdings Limited, Microsoft Corporation, NVIDIA Corporation, Amazon Web Services, Google Inc., Sony Corporation, Intel Corporation, Ubitus K.K., Utomik B.V., and Shadow SAS. These companies advanced their positions by expanding global server capacity, improving automated scaling, and supporting real-time gaming demand across multiplayer and cloud-based ecosystems. Their focus on low-latency infrastructure and AI-driven optimization strengthened service reliability for large online communities. North America remained the leading region with a 38% share, supported by strong esports activity, widespread cloud adoption, and high developer concentration.
Market Insights
- The market was valued at USD 2.16 billion in 2024 and is expected to reach USD 4.56 billion by 2032, growing at a CAGR of 9.8%. • Growth increased as users demanded low-latency cloud access and broader multi-device gaming support. Rising adoption of 5G networks also boosted workloads that relied on high-speed, stable streaming. • Trends showed higher use of AI-based upscaling, cross-platform sync, and edge delivery. Providers added more real-time rendering features as subscription models gained steady traction across casual and core players. • Competition intensified as Tencent Holdings Limited, Intel Corporation, Shadow SAS, Amazon Web Services, Inc., Sony Corporation, Ubitus K.K., Google Inc., Utomik B.V., Microsoft Corporation, and NVIDIA Corporation expanded cloud infrastructure and optimized GPU clusters to strengthen streaming performance. • North America held about 41% share in 2024 due to strong broadband access, while gaming services led the segment with nearly 55% share thanks to high adoption across online and console-linked platforms.
Market Segmentation Analysis:
By Game Type
Action games dominated the Game Servers Management Services Market in 2024 with nearly 41% share. These titles required fast response times, stable matchmaking, and high-capacity load balancing. Service providers focused on low-latency server clusters to support real-time combat, open-world action, and competitive multiplayer formats. First-person shooters also expanded as esports events increased global traffic. Role-playing and adventure games grew at a steady pace due to larger story-driven communities and rising demand for persistent worlds.
- For instance, , a 2025 academic study demonstrated that using a hybrid fog-and-edge load‑balancing architecture for MMO‑style games can cut average latency by 67.5%, peak latency by 60.3%, and reduce latency variability by 65.8% benchmarks that significantly improve real‑time action game performance under heavy load.
By Service Model
Infrastructure as a Service (IaaS) held the leading share in 2024 with about 47%. Game studios adopted IaaS for scalable computing, global server placement, and reliable uptime during peak player loads. The model reduced hardware ownership costs and enabled faster deployments for live operations. Platform as a Service (PaaS) gained traction as developers embraced built-in analytics and matchmaking tools. Software as a Service (SaaS) advanced through automated monitoring and security capabilities suited for small and mid-sized studios.
- For instance, Epic Games the developer behind Fortnite runs almost its entire global game‑server fleet on Amazon Web Services (AWS) infrastructure. At peak times, Epic scales compute capacity by up to 30 times the baseline load using AWS EC2 instances.
By Technology
Artificial Intelligence (AI) led the technology segment with nearly 44% share in 2024. AI-supported load prediction, automated scaling, and advanced anti-cheat systems improved stability across high-traffic multiplayer games. VR platforms expanded as immersive titles required optimized network throughput and synchronized gameplay. AR titles benefited from edge servers that enhanced real-time interactions for location-based gaming. Providers invested in AI-driven orchestration tools to enhance performance consistency and maintain smooth gameplay during global events.
Key Growth Drivers:
Growing Multiplayer Adoption and Real-Time Gaming Demand
Multiplayer games continued to expand, which increased the need for stable and scalable server management services. Gamers expected fast matchmaking, smooth gameplay, and minimal lag across regions. Providers optimized global server clusters to support competitive play, cross-platform titles, and seasonal content drops. The rise of battle-royale formats and large open-world games added pressure on developers to manage fluctuating traffic. Real-time game updates and frequent content patches also pushed firms to adopt automated load balancing. As global internet access improved, more players entered online ecosystems, which further increased demand for reliable server orchestration.
- For instance, as of end‑2023 there were over 1.5 billion players worldwide regularly engaging in online multiplayer formats.
Expansion of Esports and Competitive Gaming Ecosystems
Esports tournaments grew in size and frequency, which expanded the demand for high-performance server capabilities. Competitive matches required strict latency control, stable synchronization, and strong anti-cheat systems. Game publishers invested in specialized server nodes to support official leagues and community-led events. The rise of live-streaming platforms amplified traffic spikes, forcing providers to enhance bandwidth management. Many studios partnered with managed service vendors to guarantee smooth experiences for large-scale competitions. As event organizers expanded to more regions, server deployments became more distributed, boosting long-term demand for end-to-end server management.
- For instance, the 2024 League of Legends World Championship a hallmark of competitive gaming set a record by attracting 6.94 million peak concurrent viewers globally, making it the most‑watched single esports event in history.
Shift Toward Cloud-Native Deployment and Automation
Studios adopted cloud-native architectures to simplify operations, reduce costs, and accelerate launches. Developers relied on containerized environments, microservices, and orchestration tools to improve resilience. Automated scaling helped manage unpredictable player surges during new releases or major updates. Continuous delivery pipelines also pushed providers to support rapid server configuration and patch deployment. Cloud-native adoption allowed smaller studios to compete with larger publishers by accessing strong computing resources. This shift encouraged service providers to invest in flexible, automation-driven platforms that supported long-term performance and global user reach.
Key Trends & Opportunities:
Growth of AI-Driven Server Optimization
AI integration became a major trend as studios sought automated solutions for predicting traffic and preventing outages. AI models identified latency risks, optimized routing paths, and helped maintain balanced workloads across regions. Predictive tools supported smoother player experiences during peak hours and large content launches. Providers also used AI to strengthen security, detect cheating patterns, and flag suspicious server behavior. As more publishers adopted live services, AI-enabled orchestration reduced downtime and improved cost efficiency.
- For instance, Cast AI a cloud‑infrastructure optimization firm now serves about 2,100 customers worldwide as of April 2025.
Rising Opportunities in VR, AR, and Cross-Platform Gaming
VR and AR titles increased demand for low-latency server systems that supported synchronized, immersive interactions. Cross-platform gaming also expanded as players expected seamless performance across PC, console, and mobile devices. These formats needed advanced load distribution and edge computing deployments to support real-time rendering and player tracking. Growth in multiplayer VR arenas and social AR environments created fresh service opportunities. Providers introduced new frameworks to maintain consistent gameplay across various device types and network conditions.
- For instance, Edgegap a game‑server orchestration and hosting platform claims that by using its regionless edge‑network deployment across 615+ server locations, latency for VR / multiplayer games can be reduced by up to 58% compared to traditional public cloud hosting.
Key Challenges:
High Infrastructure Costs and Complex Scalability Needs
Many studios faced high infrastructure expenses, especially when supporting unexpected player spikes. Server scaling required strong planning, reliable cloud partnerships, and advanced automation. Smaller developers struggled with resource limitations, which restricted their ability to handle global deployment. Maintaining performance across multiple regions also demanded continuous monitoring and optimization. These factors increased reliance on external management providers but added long-term operational costs.
Increasing Cybersecurity Risks and Reliance on Anti-Cheat Tools
Cyberattacks, DDoS attempts, and cheating tools continued to threaten game stability. Publishers depended on server management services to implement security layers and maintain fair player environments. As more games used live service models, the risk of server breaches grew. Providers invested in real-time protection and advanced detection systems, but maintaining these defenses raised expenses. Stronger authentication, encrypted traffic routing, and continuous monitoring became essential yet resource-intensive.
Regional Analysis
North America
North America held the leading position with about 38% share in the Game Servers Management Services Market. Strong adoption of multiplayer titles, mature cloud infrastructure, and large esports networks supported steady growth. Major studios in the United States and Canada relied on scalable hosting, automated load balancing, and strong anti-cheat systems. High spending on online gaming and rapid upgrades in data-center technology further strengthened the region’s dominance. Expanding cross-platform gaming and VR testing environments also pushed providers to deploy more distributed server clusters across major cities.
Europe
Europe captured nearly 27% share due to strong adoption of competitive gaming and widespread fiber connectivity. Countries like Germany, the U.K., France, and the Nordics supported advanced game development and large online communities. Regional studios invested in cloud-native deployment models to improve server orchestration and reduce launch bottlenecks. Rising esports participation and stricter data regulations increased demand for localized server hosting. Providers expanded edge computing nodes to support lower latency across Western and Eastern European gaming hubs.
Asia-Pacific
Asia-Pacific accounted for about 29% share and remained the fastest-growing region. High player density in China, Japan, South Korea, and India created heavy demand for real-time hosting at scale. Mobile-first gaming trends and stronger broadband access boosted the need for distributed server grids. Esports expansion in South Korea and China increased the requirement for stable, low-latency infrastructure. Regional developers adopted AI-based optimization tools to handle large traffic spikes during game launches and seasonal updates.
Latin America
Latin America held close to 4% share, driven by rising multiplayer participation and improving connectivity in Brazil, Mexico, Argentina, and Chile. Growth in mobile gaming and emerging esports leagues encouraged developers to adopt outsourced server management. Providers expanded local data centers to lower latency and improve matchmaking quality. Cloud adoption increased as studios sought cost-effective infrastructure to support real-time gameplay. Despite progress, uneven broadband quality and higher infrastructure costs slowed wider market penetration.
Middle East & Africa
The Middle East & Africa region accounted for around 2% share, supported by expanding gaming communities in the UAE, Saudi Arabia, South Africa, and Nigeria. Investments in data-center capacity and improved 5G networks helped reduce latency issues. Regional developers used managed services to support competitive gaming events and cross-platform launches. Growth remained gradual due to infrastructure gaps across several countries, but government-led digital initiatives encouraged broader adoption. Rising interest in VR and mobile esports offered future growth opportunities for server providers.
Market Segmentations:
By Game Type
- Action
- Adventure
- Role-Playing Games (RPG)
- First-Person Shooter (FPS)
By Service Model
- Infrastructure as a Service (IaaS)
- Platform as a Service (PaaS)
- Software as a Service (SaaS)
By Technology
- Virtual Reality (VR)
- Augmented Reality (AR)
- Artificial Intelligence (AI)
By Geography
- North America
- U.S.
- Canada
- Mexico
- Europe
- Germany
- France
- U.K.
- Italy
- Spain
- Rest of Europe
- Asia Pacific
- China
- Japan
- India
- South Korea
- South-east Asia
- Rest of Asia Pacific
- Latin America
- Brazil
- Argentina
- Rest of Latin America
- Middle East & Africa
- GCC Countries
- South Africa
- Rest of the Middle East and Africa
Competitive Landscape
The competitive landscape of the Game Servers Management Services Market features major companies such as Tencent Holdings Limited, Microsoft Corporation, NVIDIA Corporation, Google Inc., Sony Corporation, Amazon Web Services, Intel Corporation, Ubitus K.K., Utomik B.V., and Shadow SAS. These firms strengthened their positions by expanding global data-center networks, improving orchestration tools, and supporting scalable game hosting for multiplayer and cross-platform titles. Leading providers focused on low-latency infrastructure, AI-driven load management, and enhanced anti-cheat systems to meet rising demand for real-time gameplay. Many players invested in cloud-native platforms that enabled automated scaling, continuous deployment, and strong security layers. Strategic partnerships with game publishers and esports organizers helped widen service footprints, while edge computing nodes improved responsiveness across key gaming regions.
Key Player Analysis
- Tencent Holdings Limited
- Intel Corporation
- Shadow SAS
- Amazon Web Services, Inc.
- Sony Corporation
- Ubitus K.K.
- Google Inc.
- Utomik B.V.
- Microsoft Corporation
- NVIDIA Corporation
Recent Developments
- In November 2025, Microsoft Corporation (Azure PlayFab): PlayFab announced Game Saves (cross-platform progression) as generally available and released recent PlayFab feature digests (Oct/Sep 2025) with improvements to Game Manager, API rate-limit views, and the Unified SDK all strengthening PlayFab’s game-server and live-operations capabilities.
- In January 2025, Utomik B.V.: Utomik announced the immediate shutdown of its cloud gaming / subscription platform (Utomik Cloud), closing the service and cancelling subscriptions amid strong competition in the cloud-gaming and game-server space.
- In April 2024, Microsoft Corporation (Azure PlayFab): Azure PlayFab highlighted multiplayer and live-ops enhancements at GDC 2024 including new PlayFab features and tooling to scale dedicated multiplayer servers, matchmaking and live operations for game-server management.
Report Coverage
The research report offers an in-depth analysis based on Game Type, Service Model, Technology and Geography. It details leading market players, providing an overview of their business, product offerings, investments, revenue streams, and key applications. Additionally, the report includes insights into the competitive environment, SWOT analysis, current market trends, as well as the primary drivers and constraints. Furthermore, it discusses various factors that have driven market expansion in recent years. The report also explores market dynamics, regulatory scenarios, and technological advancements that are shaping the industry. It assesses the impact of external factors and global economic changes on market growth. Lastly, it provides strategic recommendations for new entrants and established companies to navigate the complexities of the market.
Future Outlook
- Demand will rise as more studios shift to always-online and live-service game models.
- Providers will add stronger automation to reduce server downtime and improve scaling.
- AI-based load prediction will help manage traffic spikes during launches and events.
- Edge servers will expand to cut latency and support smoother global multiplayer play.
- Security layers will grow as firms counter DDoS attacks and account breaches.
- Hybrid cloud setups will gain traction as publishers balance cost and performance.
- Real-time analytics will support faster updates and better player-behavior insights.
- Cross-platform adoption will push providers to deliver unified backend management.
- Energy-efficient data centers will become a priority as companies pursue greener targets.
- Partnerships between game studios and cloud giants will strengthen long-term service stability.
Request a Free Sample
Fill in your details and we'll send you a free sample report.
- Sample data tables & charts
- Research methodology
Need a Custom Version of This Report?
Tailor the scope, geography, or segments to your exact requirements.
- Custom geography or segment scope
- Direct access to our analyst team
Frequently Asked Questions
What is the current market size for Game Servers Management Services Market, and what is its projected size in 2032?
At what Compound Annual Growth Rate is Game Servers Management Services Market projected to grow between 2024 and 2032?
Which Game Servers Management Services Market segment held the largest share in 2024?
What are the primary factors fueling the growth of Game Servers Management Services Market?
Who are the leading companies in Game Servers Management Services Market?
Which region commanded the largest share of Game Servers Management Services Market?
Table of Content
Chapter 1. Report Introduction
- 1.1 Report Description & Purpose
- 1.1.1 Report Title & Market Definition
- 1.1.2 Unique Selling Propositions (USP) & Key Differentiators
- 1.1.3 Value Proposition for Stakeholders
- 1.2 Research Objectives
- 1.2.1 Market Sizing Objectives (Volume & Revenue)
- 1.2.2 Segmentation Objectives
- 1.2.3 Competitive Intelligence Objectives
- 1.2.4 Forecast & Scenario Objectives
- 1.3 Report Scope
- 1.3.1 Game Servers Management Services Scope – Types & Subtypes Covered
- 1.3.2 Geographic Scope – Regions & Countries Covered
- 1.3.3 Historical Period, Base Year & Forecast Period (2024; forecast to 2032)
- 1.3.4 Inclusions & Exclusions
- 1.4 HS Code & Classification Framework
- 1.5 Currency, Units & Pricing Basis
- 1.6 Target Stakeholders
- 1.7 Limitations & Assumptions
Chapter 2. Executive Summary
- 2.1 Global Game Servers Management Services Market Snapshot
- 2.1.1 Market Size – Historical (2024) & Forecast (2024-2032) (2024: USD 2.16 billion → 2032: USD 4.56 billion)
- 2.1.2 Volume & Revenue – Global Totals
- 2.1.3 Key Market Highlights – Top Five Facts
- 2.2 Game Servers Management Services Market Segmentation Snapshot
- 2.2.1 Market Split by Region – 2024 vs. 2032
- 2.3 Competitive Snapshot
- 2.3.1 Top 10 Players by Revenue Share – 2024
- 2.3.2 Top 10 Players by Volume Share – 2024
- 2.3.3 Recent Strategic Developments (18-Month Summary)
- 2.4 Key Investment Highlights & Strategic Conclusions
Chapter 3. Game Servers Management Services Market Dynamics & Industry Analysis
- 3.1 Market Overview & Context
- 3.1.1 Game Servers Management Services Market Position in the Broader Automotive Value Chain
- 3.1.2 OEM vs. Replacement Market Dynamics
- 3.1.3 Market Maturity & Development Stage by Region
- 3.2 Game Servers Management Services Market Drivers
- 3.3 Game Servers Management Services Market Restraints & Challenges
- 3.4 Game Servers Management Services Market Opportunities
- 3.5 Porter's Five Forces Analysis
- 3.5.1 Threat of New Entrants
- 3.5.2 Bargaining Power of Suppliers
- 3.5.3 Bargaining Power of Buyers
- 3.5.4 Threat of Substitutes
- 3.5.5 Competitive Rivalry – Intensity Assessment
- 3.6 Game Servers Management Services Value Chain Analysis
- 3.6.1 Upstream – Raw Material/Input Suppliers
- 3.6.1.1 Raw Material/Input 1
- 3.6.1.2 Raw Material/Input 2
- 3.6.1.3 Raw Material/Input 3
- 3.6.2 Midstream – Production/Manufacturing/Service Delivery
- 3.6.2.1 Production/Process Overview
- 3.6.2.2 Key Facility Locations & Capacity by Manufacturer
- 3.6.3 Downstream – Distribution & End Consumer
- 3.6.3.1 Primary Channel – B2B/OEM
- 3.6.3.2 Secondary Channels – Dealer, Retail, Online, Direct
- 3.6.4 Value Chain Profitability Analysis
- 3.6.1 Upstream – Raw Material/Input Suppliers
- 3.7 PESTEL Analysis
- 3.7.1 Political Factors
- 3.7.2 Economic Factors
- 3.7.3 Social Factors
- 3.7.4 Technological Factors
- 3.7.5 Environmental Factors
- 3.7.6 Legal Factors
- 3.8 Game Servers Management Services Supply Chain Analysis
- 3.8.1 Raw Material/Input Supply Risk Assessment
- 3.8.2 Manufacturing Concentration Risk (Geographic Exposure)
- 3.8.3 Trade Disruption Impact Analysis
- 3.9 Regulatory & Policy Landscape
Note: The regulatory and policy landscape section covers regulations based on their applicability to the market, Game Servers Management Services category, geography, and scope of the study. Only regulatory frameworks with a material impact on operations, compliance, trade, sustainability, or market access are analyzed in detail.
Chapter 4. Key Investment Pockets & Opportunity Analysis
- 4.1 Game Servers Management Services Market Attractiveness Analysis
- 4.1.1 By Region – Investment Attractiveness Matrix (Volume × CAGR)
- 4.2 Absolute Revenue Growth Opportunity
- 4.2.1 By Region – Absolute USD Growth Through 2032
- 4.3 Incremental Volume Opportunity
- 4.3.1 By Region – Incremental Volume Through 2032
- 4.3.2 Segment – Incremental Volume
- 4.4 Emerging Submarket Opportunity Deep Dive (Subject to Applicability)
- 4.5 Emerging Market Opportunity Scorecards
- 4.5.1 United States
- 4.5.2 Europe
- 4.5.3 Asia
- 4.5.4 Middle East & Africa
Note: Emerging Market Opportunity Scorecards will be included based on relevance and strategic importance. Regions listed are indicative and may vary depending on data availability and market dynamics.
Chapter 5. Game Servers Management Services Import-Export Analysis & Trade Flows
- 5.1 Global Trade Overview
- 5.1.1 Global Export Value by Country (2024)
- 5.1.2 Global Export Volume by Country (2024)
- 5.1.3 Global Import Value by Country (2024)
- 5.1.4 Global Import Volume by Country (2024)
- 5.1.5 Net Trade Balance by Country (2024)
- 5.2 Export Analysis – Segment
- 5.2.1 Type 1 (HS Code)
- 5.2.2 Type 2 (HS Code)
- 5.2.3 Type 3 (HS Code)
- 5.2.4 Type 4 (HS Code)
- 5.2.5 Type 5 (HS Code)
- 5.3 Import Analysis – Segment
- 5.3.1 Type 1 (HS Code)
- 5.3.2 Type 2 (HS Code)
- 5.3.3 Type 3 (HS Code)
- 5.3.4 Type 4 (HS Code)
- 5.3.5 Type 5 (HS Code)
- 5.4 Average Unit Trade Prices
- 5.4.1 Average Export Price – Segment & Country
- 5.4.2 Average Import Price – Segment & Source Country
- 5.4.3 Price Trends (2024)
- 5.5 Key Trade Route Analysis
- 5.5.1 Trade Route 1
- 5.5.2 Trade Route 2
- 5.5.3 Trade Route 3
- 5.5.4 Trade Route 4
- 5.5.5 Trade Route 5
- 5.6 Trade Policy Impact Assessment
- 5.6.1 US Anti-Dumping & Section 301 Tariffs
- 5.6.2 EU Customs Union Impact
- 5.6.3 Major Free Trade Agreements
- 5.6.4 USMCA Rules of Origin
Note: Trade policy analysis will be included only where relevant to the Game Servers Management Services market.
Chapter 6. Competitive Landscape & Company Benchmarking
- 6.1 Game Servers Management Services Market Concentration & Structure
- 6.1.1 Herfindahl-Hirschman Index (HHI) – vs. 2024
- 6.1.2 Tier 1, Tier 2 & Tier 3 Market Structure
- 6.1.3 Global, Regional & Local Player Dynamics
- 6.2 Game Servers Management Services Market Share Analysis – 2024
- 6.2.1 Global Revenue Share by Company
- 6.2.2 Global Volume Share by Company
- 6.2.3 Regional Revenue Share
- 6.2.4 Market Share Evolution ( vs. 2024)
- 6.2.5 OEM Segment Share by Company
- 6.2.6 Replacement Segment Share by Company
- 6.3 Production/Delivery Capacity & Facility Analysis
- 6.3.1 Global Installed Capacity
- 6.3.2 Capacity Utilization Rates
- 6.3.3 Production/Output Volume
- 6.3.4 Facility Locations & Capacity Map
- 6.3.5 Planned Capacity Additions
- 6.4 Game Servers Management Services Competitive Benchmarking Matrix
- 6.4.1 Revenue, Volume, CAGR & Profitability Comparison
- 6.4.2 Channel Revenue Mix
- 6.4.3 Geographic Revenue Exposure
- 6.4.4 R&D Intensity
- 6.4.5 Sustainability Maturity
- 6.5 Strategic Developments in Game Servers Management Services (Last 24 Months)
- 6.5.1 Mergers, Acquisitions & Divestments
- 6.5.2 New Game Servers Management Services Launches
- 6.5.3 Facility Expansions
- 6.5.4 Strategic Alliances, Joint Ventures & Partnerships
- 6.5.5 Distribution Expansion & Market Entry
- 6.5.6 Sustainability & ESG Initiatives
- 6.6 Competitive Strategy Mapping
- 6.6.1 Leader, Challenger, Follower & Niche Classification
- 6.6.2 Pricing Strategy Comparison
- 6.6.3 Channel Strategy Matrix
Note: Strategic developments are included based on their materiality and the availability of reliable information.
Chapter 7. Global Game Servers Management Services Market – By Distribution Channel
- 7.1 Segment Overview
- 7.1.1 Volume & Revenue Split by Channel (2024 & 2032)
- 7.1.2 Channel Mix Evolution (2024-2032)
Chapter 8. Regional Market Analysis – Global Overview
- 8.1 Global Regional Overview
- 8.1.1 Regional Volume Share
- 8.1.2 Regional Revenue Share
- 8.1.3 Regional Volume by Region
- 8.1.4 Regional Revenue by Region
- 8.1.5 Regional Forecast Through 2032
- 8.2 Cross-Regional Segment Analysis
- 8.2.1 By Distribution Channel
- 8.2.2 By Brand/Price Tier
Chapter 9. North America Game Servers Management Services Market
- 9.1 United States
- 9.2 Canada
- 9.3 Mexico
Chapter 10. Europe Game Servers Management Services Market
- 10.1 Germany
- 10.2 France
- 10.3 Italy
- 10.4 United Kingdom
- 10.5 Spain
- 10.6 Poland
- 10.7 Russia
- 10.8 Netherlands
- 10.9 Belgium
- 10.10 Sweden
- 10.11 Denmark
- 10.12 Norway
- 10.13 Rest of Europe
Chapter 11. Asia Pacific Game Servers Management Services Market
- 11.1 China
- 11.2 India
- 11.3 Japan
- 11.4 South Korea
- 11.5 Thailand
- 11.6 Indonesia
- 11.7 Vietnam
- 11.8 Malaysia
- 11.9 Australia
- 11.10 Rest of Asia Pacific
Chapter 12. Latin America Game Servers Management Services Market
- 12.1 Brazil
- 12.2 Argentina
- 12.3 Colombia
- 12.4 Chile
- 12.5 Rest of Latin America
Chapter 13. Middle East Game Servers Management Services Market
- 13.1 Saudi Arabia
- 13.2 United Arab Emirates
- 13.3 Turkey
- 13.4 Israel
- 13.5 Iran
- 13.6 Rest of the Middle East
Chapter 14. Africa Game Servers Management Services Market
- 14.1 South Africa
- 14.2 Egypt
- 14.3 Nigeria
- 14.4 Morocco
- 14.5 Rest of Africa
Chapter 15. Game Servers Management Services Company Profiles
- 15.1 [Company 01]
- 15.1.1 Company Overview
- 15.1.2 Key Management Personnel
- 15.1.3 Products & Services Portfolio
- 15.1.4 Financial Performance
- 15.1.5 Key Market Focus & Geographic Presence
- 15.1.6 Recent Developments & Strategic Initiatives
Note: The company profile list is preliminary and may change based on research findings, market developments, data availability, and client requirements.
Chapter 16. Appendices
- Appendix A – List of Abbreviations & Acronyms
- Appendix B – Industry Classification Code Reference – Full Series
- Appendix C – Production & Capacity Data Tables
- Appendix D – End-Use & Demand Base Tables
- Appendix E – Consumption & Replacement Rate Assumptions
- Appendix F – ASP Reference Tables
- Appendix G – Manufacturing & Facility Database
- Appendix H – Import-Export Data Tables
- Appendix I – Regulatory Summary Tables
- Appendix J – Primary Research Participant List (Anonymized)
- Appendix K – Primary Research Questionnaire Framework
- Appendix L – Data Sources & Bibliography
- Appendix M – Market Size Divergence & Source Comparison
Chapter 17. Research Methodology
- 17.1 Research Framework & Philosophy
- 17.2 Secondary Research – Sources, Hierarchy & Data Extraction
- 17.3 Data Modeling – Bottom-Up & Top-Down Market Sizing
- 17.4 Primary Research – Stakeholder Framework, LOI & Sample Sizes
- 17.5 Forecast Methodology – Regression, Scenario & Sensitivity Analysis
- 17.6 Quality Control – Four-Layer Validation Framework
- 17.7 Limitations & Standard Assumptions
- 17.8 Disclaimer
