Home » Medical Devices » Artificial Tendons And Ligaments Market

Artificial Tendons And Ligaments Market By Application (Knee Injuries, Foot & Ankle Injuries, Shoulder Injuries, Others), By Usage Area (Hospitals, Ambulatory Surgery Centers) – Growth, Share, Opportunities & Competitive Analysis, 2018 – 2026

Price: $4999

Published: | Report ID: 2060 | Report Format : PDF

Market Insights

Despite their introduction several years ago, the use of artificial tendons and ligaments has only recently received prominent attention and has opened new treatment options for patients seeking rapid recovery and restoration of normal movements. Artificial ligaments are commonly used in knee, ankle, and shoulder treatments where tissue rupture is often observed. These are in high demand for patellar ligament reconstruction and anterior cruciate ligament reconstruction procedures.

Artificial ligaments and tendons are being increasingly preferred over allografts and autografts due to their prominent advantages, such as rapid recovery, a lower requirement for repeat procedures, and obviously better availability in the market. Over the years, a large amount of clinical evidence has been established, recording the efficacy and safety of artificial ligaments and tendons, which, too, is augmenting market growth and attracting the interest of both new manufacturers and surgeons alike.

Design Element 2

Access crucial information at unmatched prices!

Request your free sample report today & start making informed decisions powered by Credence Research!

Download Free Sample
CTA Design Element 3

Market Synopsis

Artificial ligaments find the largest application in procedures for knee injuries.

Based on the applications of artificial tendons and ligaments, this market is segmented into knee injuries, foot, and ankle injuries, shoulder injuries, and others (hip and spine injuries). Among these, the application of artificial ligaments is the most common in the knee injury segment.

A higher incidence of knee trauma and a significantly high impact on daily life positively influence the market position of the knee injury segment. Furthermore, increased youth participation in sports and athletic activities and the resultant growth in the incidence of knee injuries have also driven market growth.

The same trend is anticipated to continue through the forecast period, making knee injury applications the fastest-growing segment throughout the forecast period. The evolution of surgical techniques will also be instrumental in augmenting the growth of this segment.

Growing awareness regarding minimally invasive surgeries will augment the position of ambulatory surgery centers.

Hospitals are the largest area where surgeries with artificial tendons and ligaments are performed. Greater patient footfall seeking advanced healthcare, a higher rate of readmissions arising from prior complications from surgeries, the presence of supportive and advanced infrastructure, and a greater presence of hospitals across all geographies drive the dominance of this segment.

The ambulatory surgery centers segment, on the other hand, is expected to grow rapidly during the forecast period. Because of the decentralization of healthcare infrastructure, large hospitals have established independent ambulatory centers in remote locations. Procedures at these locations are often performed at lower costs than those in hospitals. This has also, in turn, led to a growing preference among patients to opt for procedures at ambulatory surgery centers, thereby driving the swift growth of this segment.

Europe’s global market dominance was aided by widespread awareness.

The presence of a large patient pool and wide availability of skilled personnel for performing minimally invasive orthopedic procedures in Germany, the U.K., and France drive the dominance of the European market. Higher healthcare expenditure, greater awareness, and the higher purchasing power of the geriatric population also contribute to the prominent position of the European market.

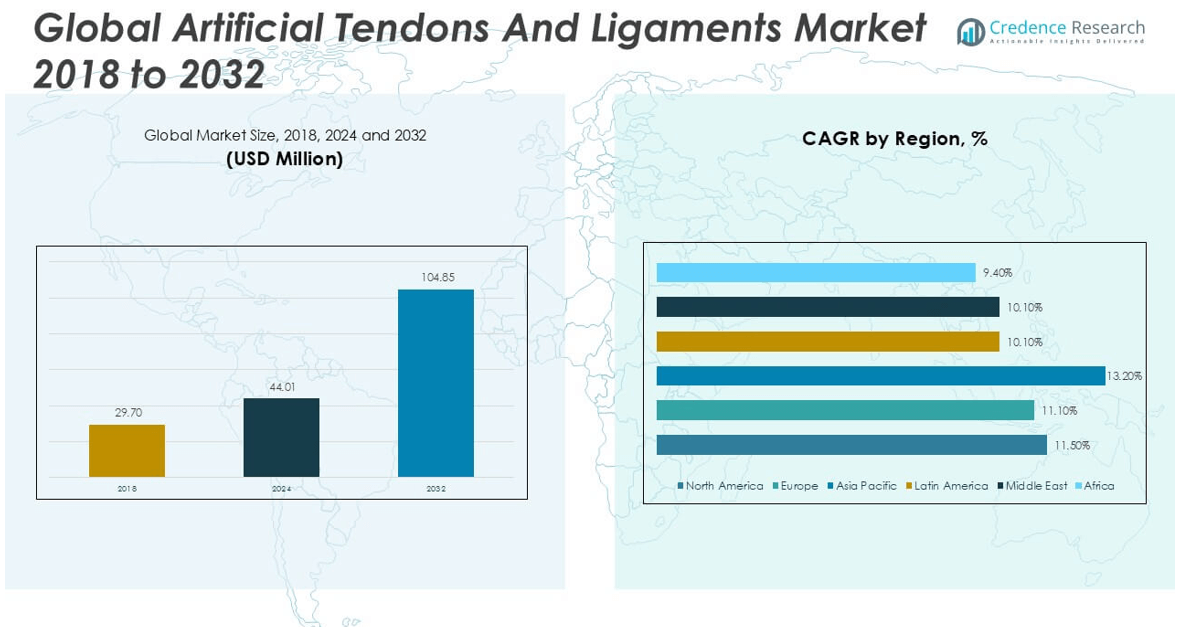
Asia Pacific will witness faster market growth during the forecast period. The region houses the largest population globally and therefore presents a significant potential patient pool. The general population in the region is also increasingly participating in athletic and sports activities, therefore increasing the incidence of ligament injuries. All of these factors, along with evolving healthcare infrastructure and increasing hospital penetration in rural areas, will drive the Asia-Pacific market’s growth.

Periods of History and Forecast

This research report presents the analysis of each considered segment for the period from 2016 to 2026, using 2017 as the base year for estimations. Compounded annual growth rates (CAGRs) for each segment are calculated for the forecast period from 2018 to 2026.Report Scope by Segments

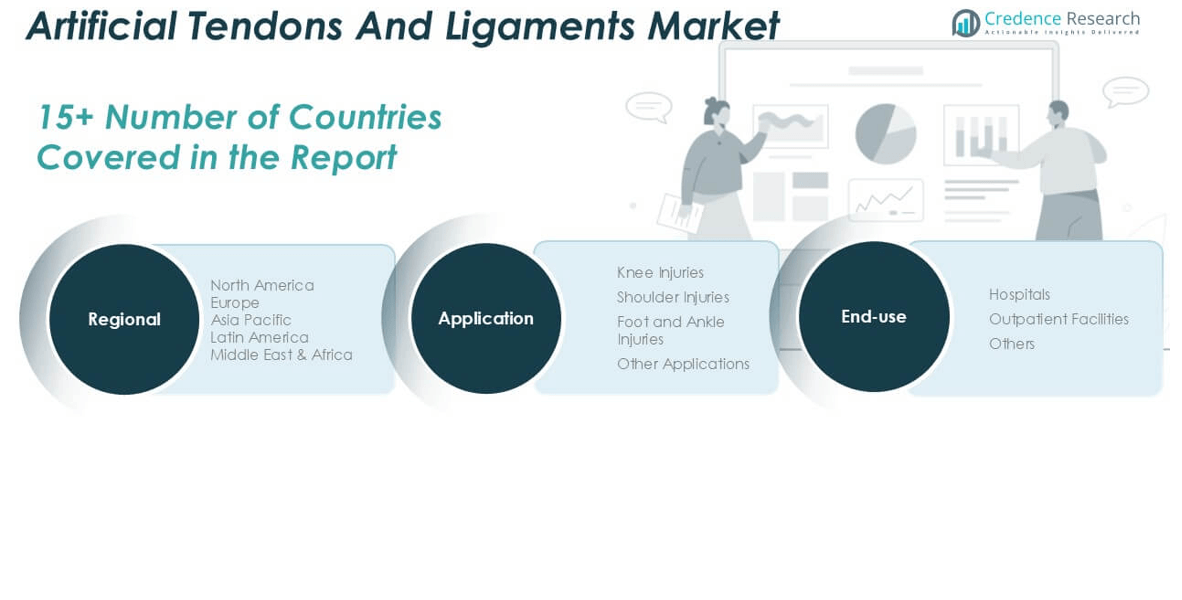
The artificial tendons and ligaments market report provide a quantitative assessment of the industry in terms of current and forecasted market size while also presenting the market dynamics. This market is segmented based on applications, usage areas, and geography.

This report also includes a company profiles section that gives insights into the company overview, product portfolio, financial information, and key developments of major market players. The major players profiled in this report include Artelon, FX Solutions S.A.S., Corin Group, Xiros Ltd., GROUP FH ORTHO, Shanghai Pine & Power Biotech Co., Ltd., Cousin Biotech, and Orteq Sports Medicine.

Shape Your Report to Specific Countries or Regions & Enjoy 30% Off!

Key questions are answered in this report.

  • What is the growth projection for the global artificial tendons and ligaments market for the period 2018–2026?
  • Which application area has the highest rate of the procedure with artificial ligaments and tendons?
  • What is the impact of minimally invasive surgeries on market growth?
  • What are the key factors supporting the dominance of knee injuries in this segment?
  • What are the key strategies observed by the top players for augmenting their hold on the industry?

Chapter 1. Preface
1.1. Report Description
1.1.1. Study Purpose
1.1.2. Target Audience
1.1.3. USP and Key Offerings
1.2. Research Scope
1.3. Research Methodology
1.3.1. Phase I – Secondary Research
1.3.2. Phase II – Primary Research
1.3.3. Approach Adopted
1.3.4. Top Down Approach
1.3.5. Bottom Up Approach
1.3.6. Phase III – Expert Panel Review
1.3.7. Assumptions
1.4. Market Segmentation

Chapter 2. Executive Summary
2.1. Global ATL Market Portraiture
2.2. Global ATL Market, by Application, 2017 (US$ Mn)
2.3. Global ATL Market, by Usage Area, 2017 (US$ Mn)
2.4. Global ATL Market, by Geography, 2017 (US$ Mn)

Chapter 3. Global Artificial Tendons and Ligaments (ATL) Market: Dynamics and Future Outlook
3.1. Overview
3.2. Drivers
3.3. Challenges
3.4. Opportunities
3.5. Attractive Investment Proposition, by Geography, 2017
3.6. Competitive Analysis: Global ATL Market, by Key Players, 2017

Chapter 4. Global Artificial Tendons and Ligaments (ATL) Market, by Application, 2016 – 2026 (US$ Mn)
4.1. Overview
4.2. Knee Injuries
4.3. Foot & Ankle Injuries
4.4. Shoulder Injuries
4.5. Others

Chapter 5. Global Artificial Tendons and Ligaments (ATL) Market, by Usage Area, 2016 – 2026 (US$ Mn)
5.1. Overview
5.2. Hospitals
5.3. Ambulatory Surgery Centers

Chapter 6. Global Artificial Tendons and Ligaments (ATL) Market, by Geography, 2016 – 2026 (US$ Mn)
6.1. Overview
6.2. North America ATL Market, 2016 – 2026 (US$ Mn)
6.2.1. North America ATL Market, by Application, 2016 – 2026 (US$ Mn)
6.2.2. North America ATL Market, by Usage Area, 2016 – 2026 (US$ Mn)
6.2.3. North America ATL Market, by Country, 2016 – 2026 (US$ Mn)
6.2.3.1. U.S.
6.2.3.2. Canada
6.3. Europe ATL Market, 2016 – 2026 (US$ Mn)
6.3.1. Europe ATL Market, by Application, 2016 – 2026 (US$ Mn)
6.3.2. Europe ATL Market, by Usage Area, 2016 – 2026 (US$ Mn)
6.3.3. Europe ATL Market, by Country/Region, 2016 – 2026 (US$ Mn)
6.3.3.1. U.K.
6.3.3.2. Germany
6.3.3.3. Italy
6.3.3.4. France
6.3.3.5. Spain
6.3.3.6. Rest of Europe
6.4. Asia Pacific ATL Market, 2016 – 2026 (US$ Mn)
6.4.1. Asia Pacific ATL Market, by Application, 2016 – 2026 (US$ Mn)
6.4.2. Asia Pacific ATL Market, by Usage Area, 2016 – 2026 (US$ Mn)
6.4.3. Asia Pacific ATL Market, by Country/Region, 2016 – 2026 (US$ Mn)
6.4.3.1. China
6.4.3.2. Japan
6.4.3.3. Australia
6.4.3.4. Rest of Asia Pacific
6.5. Latin America ATL Market, 2016 – 2026 (US$ Mn)
6.5.1. Latin America ATL Market, by Application, 2016 – 2026 (US$ Mn)
6.5.2. Latin America ATL Market, by Usage Area, 2016 – 2026 (US$ Mn)
6.5.3. Latin America ATL Market, by Country/Region, 2016 – 2026 (US$ Mn)
6.5.3.1. Brazil
6.5.3.2. Mexico
6.5.3.3. Rest of Latin America
6.6. Middle East & Africa ATL Market, 2016 – 2026 (US$ Mn)
6.6.1. Middle East & Africa ATL Market, by Application, 2016 – 2026 (US$ Mn)
6.6.2. Middle East & Africa ATL Market, by Usage Area, 2016 – 2026 (US$ Mn)
6.6.3. Middle East & Africa ATL Market, by Region, 2016 – 2026 (US$ Mn)
6.6.3.1. GCC
6.6.3.2. South Africa
6.6.3.3. Rest of Middle East & Africa

Chapter 7. Company Profiles
7.1. Artelon
7.1.1. Company Overview
7.1.2. Financial Information (Subject to Data Availability)
7.1.3. Product Portfolio
7.1.4. Key Developments
7.2. FX Solutions S.A.S.
7.3. Corin Group
7.4. Xiros Ltd.
7.5. GROUP FH ORTHO
7.6. Shanghai Pine & Power Biotech Co., Ltd.
7.7. Cousin Biotech
7.8. Orteq Sports Medicine

List of Figures

FIG 1. Artificial Tendons and Ligaments (ATL) Market: Research Methodology
FIG 2. Market Size Estimation – Top Down & Bottom up Approach
FIG 3. ATL: Market Segmentation
FIG 4. Global ATL Market, by Application, 2017 (US$ Mn)
FIG 5. Global ATL Market, by Usage Area, 2017 (US$ Mn)
FIG 6. Global ATL Market, by Geography, 2017 (US$ Mn)
FIG 7. Attractive Investment Proposition, by Geography, 2017
FIG 8. Competitive Analysis: Global ATL Market, by Key Players, 2017
FIG 9. Global ATL Market for Knee Injuries, 2016 – 2026 (US$ Mn)
FIG 10. Global ATL Market for Foot & Ankle Injuries, 2016 – 2026 (US$ Mn)
FIG 11. Global ATL Market for Shoulder Injuries, 2016 – 2026 (US$ Mn)
FIG 12. Global ATL Market for Other Applications, 2016 – 2026 (US$ Mn)
FIG 13. Global ATL Market in Hospitals, 2016 – 2026 (US$ Mn)
FIG 14. Global ATL Market in Ambulatory Surgery Centers, 2016 – 2026 (US$ Mn)
FIG 15. U.S. ATL Market, 2016 – 2026 (US$ Mn)
FIG 16. Canada ATL Market, 2016 – 2026 (US$ Mn)
FIG 17. U.K. ATL Market, 2016 – 2026 (US$ Mn)
FIG 18. Germany ATL Market, 2016 – 2026 (US$ Mn)
FIG 19. Italy ATL Market, 2016 – 2026 (US$ Mn)
FIG 20. France ATL Market, 2016 – 2026 (US$ Mn)
FIG 21. Spain ATL Market, 2016 – 2026 (US$ Mn)
FIG 22. Rest of Europe ATL Market, 2016 – 2026 (US$ Mn)
FIG 23. China ATL Market, 2016 – 2026 (US$ Mn)
FIG 24. Japan ATL Market, 2016 – 2026 (US$ Mn)
FIG 25. Australia ATL Market, 2016 – 2026 (US$ Mn)
FIG 26. Rest of Asia Pacific ATL Market, 2016 – 2026 (US$ Mn)
FIG 27. Brazil ATL Market, 2016 – 2026 (US$ Mn)
FIG 28. Mexico ATL Market, 2016 – 2026 (US$ Mn)
FIG 29. Rest of Latin America ATL Market, 2016 – 2026 (US$ Mn)
FIG 30. GCC ATL Market, 2016 – 2026 (US$ Mn)
FIG 31. South Africa ATL Market, 2016 – 2026 (US$ Mn)
FIG 32. Rest of Middle East and Africa ATL Market, 2016 – 2026 (US$ Mn)

List of Tables

TABLE 1 Global Artificial Tendons and Ligaments (ATL) Market Portraiture
TABLE 2 Global ATL Market, by Application, 2016 – 2026 (US$ Mn)
TABLE 3 Global ATL Market, by Usage Area, 2016 – 2026 (US$ Mn)
TABLE 4 Global ATL Market, by Geography, 2016 – 2026 (US$ Mn)
TABLE 5 North America ATL Market, by Application, 2016 – 2026 (US$ Mn)
TABLE 6 North America ATL Market, by Usage Area, 2016 – 2026 (US$ Mn)
TABLE 7 North America ATL Market, by Country, 2016 – 2026 (US$ Mn)
TABLE 8 Europe ATL Market, by Application, 2016 – 2026 (US$ Mn)
TABLE 9 Europe ATL Market, by Usage Area, 2016 – 2026 (US$ Mn)
TABLE 10 Europe ATL Market, by Country/Region, 2016 – 2026 (US$ Mn)
TABLE 11 Asia Pacific ATL Market, by Application, 2016 – 2026 (US$ Mn)
TABLE 12 Asia Pacific ATL Market, by Usage Area, 2016 – 2026 (US$ Mn)
TABLE 13 Asia Pacific ATL Market, by Country/Region, 2016 – 2026 (US$ Mn)
TABLE 14 Latin America ATL Market, by Application, 2016 – 2026 (US$ Mn)
TABLE 15 Latin America ATL Market, by Usage Area, 2016 – 2026 (US$ Mn)
TABLE 16 Latin America ATL Market, by Country/Region, 2016 – 2026 (US$ Mn)
TABLE 17 Middle East and Africa ATL Market, by Application, 2016 – 2026 (US$ Mn)
TABLE 18 Middle East and Africa ATL Market, by Usage Area, 2016 – 2026 (US$ Mn)
TABLE 19 Middle East and Africa ATL Market, by Region, 2016 – 2026 (US$ Mn)
TABLE 20 Artelon: Company Snapshot (Company Overview; Financial Information; Product Portfolio; Key Developments)
TABLE 21 FX Solutions S.A.S.: Company Snapshot (Company Overview; Financial Information; Product Portfolio; Key Developments)
TABLE 22 Corin Group: Company Snapshot (Company Overview; Financial Information; Product Portfolio; Key Developments)
TABLE 23 Xiros Ltd.: Company Snapshot (Company Overview; Financial Information; Product Portfolio; Key Developments)
TABLE 24 GROUP FH ORTHO: Company Snapshot (Company Overview; Financial Information; Product Portfolio; Key Developments)
TABLE 25 Shanghai Pine & Power Biotech Co., Ltd.: Company Snapshot (Company Overview; Financial Information; Product Portfolio; Key Developments)
TABLE 26 Cousin Biotech: Company Snapshot (Company Overview; Financial Information; Product Portfolio; Key Developments)
TABLE 27 Orteq Sports Medicine: Company Snapshot (Company Overview; Financial Information; Product Portfolio; Key Developments)

Frequently Asked Question:

What is the size of Artificial Tendons And Ligaments Market?

The market for Artificial Tendons And Ligaments Market is expected to reach USD$ XX in 2026.

What is the Artificial Tendons And Ligaments Market CAGR?

The Artificial Tendons And Ligaments Market is expected to see significant CAGR growth over the coming years, at XX%.

What is the Forecast period considered for Artificial Tendons And Ligaments Market?

The report is forecasted from 2018 -2026.

What is the base year considered for Artificial Tendons And Ligaments Market?

The base year of this report is 2017.

Who are the major players in this market?

PAREXEL International Corporation, Covance, Inc., Clinicals, Inc., Charles River Laboratories International, Inc., Accollé Clinical Research, LLC. are some of the major players in the global market.

Orthopedic Oncology Treatment Market

Published:
Report ID: 8246

Audiology Devices Market

Published:
Report ID: 2640

Cardiac Rehabilitation Devices Market

Published:
Report ID: 35105

IV Tubing Sets and Accessories Market

Published:
Report ID: 35095

Infectious Disease Diagnostic Market

Published:
Report ID: 35089

Elastomeric Infusion Pumps Market

Published:
Report ID: 4996

Emergency Hospital Bed Market

Published:
Report ID: 35082

Elder Care Product Market

Published:
Report ID: 35079

Wound Care Market

Published:
Report ID: 6983

Companion Diagnostics Market

Published:
Report ID: 3964

Apheresis Equipment Market

Published:
Report ID: 1592

Antibacterial Drugs Market

Published:
Report ID: 1424

Purchase Options

$2999
Delivery Format: Excel.
$4999
Designed for the individual purchaser.
$6999
Users located at a single corporate site or regional office.
$7999
Allowed for unlimited sharing globally within one company.
Smallform of Sample request

Have a question?

User Profile

Don’t settle for less – trust Mitul to help you find the best solution.

Report delivery within 24 to 48 hours

– Other Info –

What people say?-

User Review

I am very impressed with the information in this report. The author clearly did their research when they came up with this product and it has already given me a lot of ideas.

Jana Schmidt
CEDAR CX Technologies

– Connect with us –

Phone

+91 6232 49 3207


support

24/7 Research Support


sales@credenceresearch.com

– Research Methodology –

Going beyond the basics: advanced techniques in research methodology

– Trusted By –

Pepshi, LG, Nestle
Motorola, Honeywell, Johnson and johnson
LG Chem, SIEMENS, Pfizer
Unilever, Samsonite, QIAGEN