Market Overview
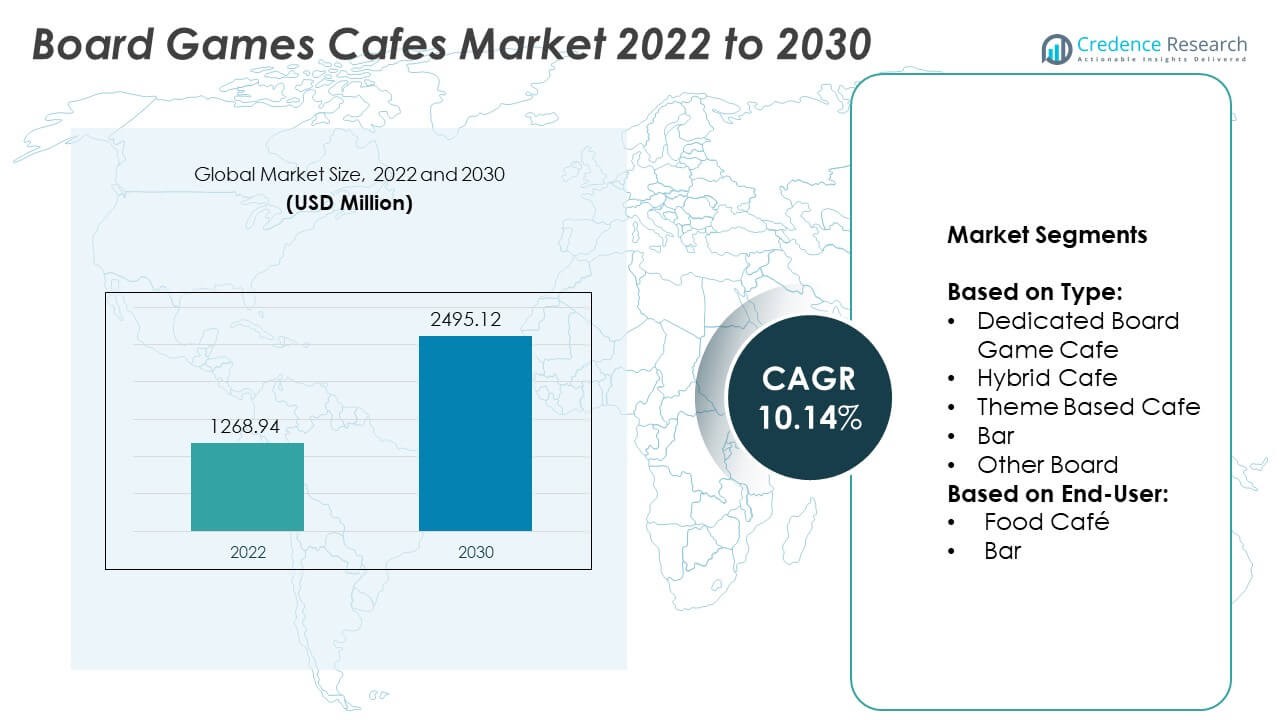
The Board Game Cafes Market was valued at USD 1,268.94 million in 2024 and is projected to reach USD 2,495.12 million by 2032, expanding at a compound annual growth rate (CAGR) of 10.14% during the forecast period
| REPORT ATTRIBUTE |
DETAILS |
| Historical Period |
2020-2024 |
| Base Year |
2024 |
| Forecast Period |
2025-2032 |
| Board Game Cafes Market Size 2024 |
USD1,268.94 Million |
| Board Game Cafes Market, CAGR |
10.14% |
| Board Game Cafes Market Size 2032 |
USD 2,495.12 Million |
The Board Game Cafes market grows through strong drivers such as rising consumer demand for experiential entertainment, the cultural revival of tabletop games, and integration of food and beverage services that extend customer engagement. It attracts millennials, Gen Z, and families seeking affordable social spaces, while operators strengthen appeal through curated game libraries, themed events, and community-building initiatives. Key trends include the rise of immersive theme-based cafés, adoption of membership and subscription models, and digital engagement through apps and online communities.
The geographical landscape of the Board Game Cafes market reflects strong presence in North America and Europe, supported by established café culture and high consumer spending on leisure, while Asia-Pacific demonstrates rapid expansion fueled by urbanization and youthful demographics. Latin America and the Middle East & Africa show growing opportunities with rising disposable incomes and increasing preference for social entertainment spaces. Key players shaping the market include Mox Boarding House (Café Mox), The Uncommons.
Access crucial information at unmatched prices!
Request your sample report today & start making informed decisions powered by Credence Research Inc.!
Download Sample
Market Insights
- The Board Game Cafes market was valued at USD 1,268.94 million in 2022 and is projected to reach USD 2,495.12 million by 2030, expanding at a CAGR of 10.14% during the forecast period.
- Growth is driven by rising demand for experiential entertainment, cultural revival of tabletop gaming, and integration of food and beverage services that enhance customer dwell time.
- Key trends include themed café concepts, adoption of subscription and membership models, and the use of digital platforms to strengthen customer engagement and loyalty.
- The competitive landscape features independent cafés and regional chains, with players such as Mox Boarding House (Café Mox), The Uncommons, and Spielbound focusing on curated libraries, community events, and unique dining experiences to differentiate their offerings.
- Restraints include high operational costs, difficulty in scaling physical café models, and competition from digital entertainment formats that limit customer retention.
- Regionally, North America and Europe remain dominant due to established café culture, while Asia-Pacific shows rapid growth with a young demographic and increasing urban adoption; Latin America and Middle East & Africa continue to emerge as promising markets.
- Market insights highlight long-term opportunities through diversification of revenue streams, expansion into mid-sized cities, and partnerships with local publishers and event organizers that position board game cafés as cultural hubs with sustainable growth potential.
Market Drivers
Rising Demand for Experiential Entertainment and Social Interaction
The Board Game Cafes market benefits from strong consumer demand for experiential entertainment that combines leisure with social connection. Urban populations increasingly value interactive spaces where groups can engage in board games while enjoying food and beverages. It creates an environment that promotes community building, attracting both younger demographics and families. The market capitalizes on a cultural shift away from digital isolation toward face-to-face engagement. Operators strengthen appeal by curating extensive game libraries and hosting themed nights. This dynamic enhances repeat visits and drives consistent customer traffic.
- For instance, Snakes & Lattes expanded its game collection to between 1,000 and 3,000 titles per location, elevating its draw among enthusiasts.
Integration of Food, Beverage, and Retail Offerings for Revenue Diversification
Operators expand business potential by integrating dining services and retail sales into their core offerings. It allows cafés to generate multiple revenue streams while improving customer experiences. Consumers find value in spending extended periods in spaces that provide both entertainment and food. The presence of retail game sales further builds brand loyalty, as customers often purchase titles they enjoyed in-store. These diversified models reduce dependence on single revenue channels and improve profitability. Businesses that refine food quality and align menus with customer preferences enhance competitiveness in crowded urban markets.
- For instance, Draughts, a board game cafe in London, offers a unique experience by combining a vast library of over 1,000 board games with craft beers, snacks, and other refreshments. Their Dalston venue, in particular, is known for its enlarged space and cozy atmosphere.
Cultural Revival of Board Games and Expansion into Urban Spaces
The cultural revival of tabletop games reinforces growth for the Board Game Cafes market. It benefits from renewed interest in both classic and contemporary board games across global markets. Urban expansion supports this trend by increasing the number of cafés in high-density areas where social leisure activities thrive. Young professionals and students often seek affordable group entertainment, making cafés an attractive option. The variety of games caters to casual players and enthusiasts alike, strengthening customer reach. This revival, supported by growing game publishers, creates a sustainable cycle of demand for café operators.
Technology Integration and Enhanced Customer Engagement Strategies
Operators increasingly adopt technology to strengthen customer engagement and operational efficiency. It includes mobile apps for reservations, loyalty programs, and digital marketing campaigns targeting niche audiences. Online communities help cafés maintain customer interaction outside the physical space, supporting stronger retention. Integration of point-of-sale and inventory management systems ensures smoother operations and improved service delivery. Customer-focused strategies such as tournaments, membership plans, and collaborative events reinforce loyalty. These efforts ensure the Board Game Cafes market sustains growth through innovation and customer-centered practices.
Market Trends
Expansion of Themed Cafés and Immersive Experiences
The Board Game Cafes market reflects a trend toward immersive experiences through themed environments. Operators design interiors around fantasy, sci-fi, or cultural motifs to attract diverse customer groups. It elevates the customer journey beyond standard gaming, blending ambiance with entertainment. These concepts resonate strongly with younger demographics seeking unique social spaces. Businesses leverage décor, costumes, and storytelling to differentiate themselves in competitive urban markets. This shift strengthens brand identity and supports long-term customer loyalty.
- For instance, The Uncommons in Manhattan transitioned its library from 475 games at launch to over 1,000 titles by 2022, reflecting both demand and appeal.
Growing Popularity of Membership Models and Subscription Services
Membership programs emerge as a strong trend within the Board Game Cafes market. It provides customers with exclusive access to discounts, premium game collections, or event participation. Regular visitors see value in consistent benefits, while operators ensure recurring revenue streams. Subscription services extend to bundled food and game packages, enhancing customer convenience. The predictability of revenue supports stability in a competitive environment. This model encourages repeat engagement and builds stronger community connections.
- For instance, the Tabletop Game Cafe in Columbus offers an annual Tabletop Club Membership for $180 per year, providing various benefits. These include one active game rental, weekly table reservations, waived entry fees for the member and a guest, priority access to tournaments and New Year’s events, and discounts on retail games (10% off) and special-order/pre-order titles (20% off).
Integration of Digital Tools and Online Platforms for Customer Engagement
Operators strengthen presence by adopting digital tools that improve interaction with customers. It includes mobile applications for bookings, online communities for discussions, and social media campaigns for promotions. Digital platforms amplify brand reach and create awareness among younger audiences. Hybrid approaches that blend physical cafés with online interactions expand engagement opportunities. Loyalty programs managed through apps offer seamless incentives and enhance customer satisfaction. This integration reinforces modern expectations of convenience and accessibility.
Rising Focus on Local Partnerships and Community-Centric Strategies
The Board Game Cafes market highlights a trend toward partnerships with local publishers, artists, and food suppliers. It helps operators create unique offerings that distinguish them from standardized chains. Collaboration with local creators introduces new board games and exclusive experiences for customers. Community-driven events such as tournaments and educational workshops further increase participation. These strategies foster loyalty while promoting sustainable growth within regional markets. The approach underscores the role of cafés as cultural hubs rather than simple entertainment venues.
Market Challenges Analysis
High Operational Costs and Limited Scalability of Business Models
The Board Game Cafes market faces significant challenges due to high operational costs and complex scalability models. Rent, staff salaries, and inventory management place pressure on margins, particularly in urban centers with premium real estate. It becomes difficult for smaller operators to balance affordability with high-quality service and game variety. Limited scalability arises because each café requires localized customization, making uniform expansion difficult. Investors often hesitate to fund ventures that depend heavily on physical presence rather than digital scalability. Businesses must navigate these challenges by optimizing operations and exploring diverse revenue streams to remain competitive.
Intense Competition and Shifting Consumer Preferences
Competitive pressure from both traditional cafés and digital entertainment platforms poses a serious challenge to the Board Game Cafes market. It struggles to retain customer attention in an era dominated by streaming services and mobile gaming. Consumer preferences shift quickly, creating difficulty in maintaining fresh and engaging offerings. Operators must constantly update game collections, organize events, and innovate with food menus to sustain interest. The market also faces uncertainty during economic slowdowns, when discretionary spending on leisure activities declines. These conditions demand strong adaptability and a customer-focused approach to secure long-term viability.
Market Opportunities
Expansion into Emerging Markets and Untapped Demographics
The Board Game Cafes market presents strong opportunities in emerging economies and underserved demographic groups. Rising disposable incomes and increasing urbanization create demand for affordable social entertainment. It enables cafés to capture audiences beyond traditional metropolitan hubs by targeting mid-sized cities and student communities. Families also represent a promising customer base, with parents seeking interactive and educational leisure options. Operators that design offerings tailored to children and multigenerational groups gain a competitive advantage. Expanding into these areas provides growth potential while diversifying revenue sources across broader customer segments.
Integration of Retail, E-Commerce, and Event-Based Revenue Models
Operators can strengthen profitability by integrating retail sales, online platforms, and event hosting into their business models. It allows customers to purchase games they experience in cafés, extending revenue beyond in-store activity. Partnerships with e-commerce channels further expand reach and improve brand visibility. Event-based revenue, including tournaments, workshops, and corporate team-building programs, creates additional growth avenues. Businesses that combine these strategies develop stronger resilience against market fluctuations. The Board Game Cafes market can leverage these opportunities to build sustainable, diversified operations that align with evolving consumer behaviors.
Market Segmentation Analysis:
By Type:
The Board Game Cafes market is segmented into dedicated board game cafés, hybrid cafés, theme-based cafés, bars, and other formats. Dedicated board game cafés remain the foundation of the industry, offering large libraries of games, trained staff for guidance, and spaces designed specifically for extended play. It attracts enthusiasts who prioritize variety and community-driven experiences, helping create strong customer loyalty. Hybrid cafés combine traditional dining with board game spaces, appealing to casual visitors and broadening the customer base. Theme-based cafés stand out by incorporating fantasy, cultural, or pop-culture motifs, creating immersive experiences that resonate strongly with younger demographics. Bars that incorporate board games cater to an adult audience, offering an informal setting for socialization and entertainment. Other board game formats include experimental spaces such as coworking cafés and pop-up events that target niche audiences.
- For instance, Draughts in London initiated operations with a library of about 500 games and grew to host over 1,000 titles in its larger Dalston location, enhancing both service capacity and customer engagement.
By End-User:
The Board Game Cafes market is divided into food cafés and bars. Food cafés dominate this segment by offering customers an all-in-one destination that blends casual dining with board game entertainment. It provides an affordable, family-friendly option that appeals to a wide demographic, particularly in urban areas with high foot traffic. Bars in this segment carve out a distinct position by appealing to adults seeking social engagement beyond traditional nightlife options. Alcohol sales support higher margins, while the presence of board games enhances customer dwell time. Both formats demonstrate resilience, but food cafés are better positioned for broad market penetration, while bars maintain a competitive edge in targeted nightlife-driven regions. Together, these segments illustrate a balanced mix of casual, immersive, and adult-focused experiences that support continued expansion.
- For instance, Jelly Jelly Café in Japan expanded to operate 13 locations, underlining its successful regional growth and operational scalability. This expansion highlights the cafe’s ability to manage multiple locations and cater to a wider customer base.
Segments:
Based on Type:
- Dedicated Board Game Cafe
- Hybrid Cafe
- Theme Based Cafe
- Bar
- Other Board
Based on End-User:
Based on the Geography:
- North America
- Europe
- UK
- France
- Germany
- Italy
- Spain
- Russia
- Belgium
- Netherlands
- Austria
- Sweden
- Poland
- Denmark
- Switzerland
- Rest of Europe
- Asia Pacific
- China
- Japan
- South Korea
- India
- Australia
- Thailand
- Indonesia
- Vietnam
- Malaysia
- Philippines
- Taiwan
- Rest of Asia Pacific
- Latin America
- Brazil
- Argentina
- Peru
- Chile
- Colombia
- Rest of Latin America
- Middle East
- UAE
- KSA
- Israel
- Turkey
- Iran
- Rest of Middle East
- Africa
- Egypt
- Nigeria
- Algeria
- Morocco
- Rest of Africa
Regional Analysis
North America
North America holds the largest share of the Board Game Cafes market, accounting for 35% of global revenue. The region benefits from a mature café culture and high consumer willingness to spend on experiential leisure activities. It thrives in urban centers such as New York, Toronto, and Los Angeles, where young professionals and students form a strong customer base. The popularity of board games across both mainstream and niche audiences further strengthens the market. Operators in this region diversify revenue streams by integrating food, beverage, and retail sales into their business models. Community-driven events and partnerships with local publishers also enhance engagement and retention, creating a sustainable growth environment.
Europe
Europe represents a significant portion of the Board Game Cafes market, capturing 28% of the global share. The region benefits from a strong cultural heritage in board games, particularly in countries like Germany, France, and the United Kingdom. It is characterized by widespread café culture and consumer preference for social activities that blend entertainment with dining. European operators often emphasize high-quality food offerings alongside curated game collections, creating a balanced appeal to diverse customer segments. Theme-based cafés are especially popular in urban areas where tourists and locals seek unique cultural experiences. Strong regulations around hospitality standards also drive consistency and service quality, reinforcing market stability.
Asia-Pacific
Asia-Pacific accounts for 22% of the global Board Game Cafes market, with rapid growth driven by rising urbanization and a young demographic base. It demonstrates strong adoption in countries such as Japan, South Korea, and China, where board games align with both cultural traditions and modern leisure trends. Operators in this region frequently adopt technology-driven approaches, including mobile apps for reservations and community-building through online platforms. It attracts students and young professionals who prefer affordable and engaging social spaces. The café format often integrates local cuisines and cultural themes, creating strong differentiation. With growing disposable incomes and increasing awareness of experiential entertainment, Asia-Pacific is set to expand its role in the global market.
Latin America
Latin America holds 9% of the Board Game Cafes market, with steady growth across countries like Brazil, Mexico, and Argentina. The region is still developing in terms of café culture, but rising middle-class income supports higher discretionary spending on leisure. It benefits from a youthful demographic seeking alternatives to digital entertainment. Operators often combine board game spaces with vibrant food and beverage menus that reflect local culture, strengthening appeal. The limited number of dedicated board game cafés creates opportunities for expansion and brand establishment. Growth is further supported by the popularity of community events and university-driven social activities.
Middle East & Africa
The Middle East & Africa region captures 6% of the global Board Game Cafes market. Growth in this region is supported by urban development, expanding hospitality sectors, and increasing interest in social leisure formats. It shows traction in countries such as the United Arab Emirates, South Africa, and Saudi Arabia, where young professionals and expatriates form the primary customer base. Operators focus on premium experiences, often combining luxury dining with high-quality board game collections. The market remains relatively small but demonstrates strong potential due to rising disposable incomes and evolving consumer preferences. Partnerships with local event organizers and cultural influencers further enhance visibility and customer acquisition.
Shape Your Report to Specific Countries or Regions & Enjoy 30% Off!
Key Player Analysis
- Gamehaus Café
- Meepleville
- Emerald Tavern Games and Café
- The Uncommons
- Pawn and Pint
- Mac and Chess
- Empire Board Game Library
- Friend & Foe
- Victory Point Café
- Board Game Republic
- Meeple’s
- The Rook and Pawn
- D4 Tabletop Gaming Café
- Game Knight Lounge
- Board Room DC
- Jokers are Wild Game Café
- Pieces
- The Wayward Kraken
- Good Game Grill
- Mox Boarding House (Café Mox)
- Well Played Board Game Café
- Spielbound
- Tavern of Tales
- Tabletop Board Game Café
Competitive Analysis
The leading players in the Board Game Cafes market include Mox Boarding House (Café Mox), The Uncommons, Spielbound, Victory Point Café, and The Rook and Pawn. These operators have established strong reputations by combining extensive game libraries with quality dining experiences, creating destinations that appeal to diverse demographics. Their focus on community-driven events, tournaments, and partnerships with local publishers positions them as influential hubs in the experiential leisure industry. Each café emphasizes differentiated strategies such as themed environments, retail sales of popular titles, and loyalty programs that enhance customer engagement. The market remains highly fragmented, with regional players adapting concepts to local cultures and customer preferences. Operators face challenges of high operational costs and competition from digital entertainment, yet their strength lies in delivering immersive, in-person experiences that digital alternatives cannot replicate. Growth strategies revolve around diversifying revenue streams, expanding into urban centers, and integrating technology for reservations and promotions. While global consolidation remains limited, these established leaders set benchmarks for service quality and innovation, influencing smaller entrants. The competitive environment underscores the importance of creativity, customer loyalty, and adaptability in sustaining long-term success in the evolving Board Game Cafes market.
Recent Developments
- In March 2025, Meepleville Board Game Cafe, located in Las Vegas, is highlighted as the premier board game cafe experience, particularly noting its extensive library of over 2,600 games.
- In September 2024, Mox Boarding House (Café Mox),the company held a grand opening for its new Chandler, Arizona location over the weekend, featuring a ribbon-cutting ceremony with the Chandler mayor, in-store promotions, and a “Magic: The Gathering” Duskmourn prerelease event.
- In June 2022, Snakes & Lattes, a board game cafe chain, acquired Gamehaus Café in Glendale, California. This acquisition marked the expansion of Snakes & Lattes into Southern California.
Market Concentration & Characteristics
The Board Game Cafes market is moderately fragmented with a mix of independent operators and a few established regional chains, reflecting low concentration on a global scale. It demonstrates strong local adaptation, as each café often tailors offerings to cultural preferences, urban demographics, and community dynamics. The market is characterized by experiential service models where extensive game libraries, curated food menus, and social events create a distinctive value proposition. It relies heavily on customer loyalty, word-of-mouth marketing, and repeat visits, making community engagement a defining feature. Operators differentiate through themed environments, partnerships with publishers, and hybrid models that integrate retail sales and dining. The industry’s competitive intensity remains high, driven by low entry barriers and rising consumer demand for interactive social spaces. Despite operational challenges, it shows resilience by leveraging immersive experiences that digital entertainment formats cannot replace. This balance of fragmentation, innovation, and local focus defines the market’s current characteristics and growth trajectory.
Report Coverage
The research report offers an in-depth analysis based on Type, End-User and Geography. It details leading market players, providing an overview of their business, product offerings, investments, revenue streams, and key applications. Additionally, the report includes insights into the competitive environment, SWOT analysis, current market trends, as well as the primary drivers and constraints. Furthermore, it discusses various factors that have driven market expansion in recent years. The report also explores market dynamics, regulatory scenarios, and technological advancements that are shaping the industry. It assesses the impact of external factors and global economic changes on market growth. Lastly, it provides strategic recommendations for new entrants and established companies to navigate the complexities of the market.
Future Outlook
- The Board Game Cafes market will expand through growing consumer preference for experiential and social leisure activities.
- Operators will focus on diversifying revenue streams through dining, retail sales, and event hosting.
- Themed and immersive café formats will gain popularity among younger demographics seeking unique experiences.
- Digital integration such as mobile apps and loyalty platforms will enhance customer engagement.
- Partnerships with local publishers and creators will introduce exclusive board games and strengthen community appeal.
- Expansion into mid-sized cities and emerging markets will create new growth opportunities.
- Hybrid models combining café spaces with coworking or educational formats will attract wider audiences.
- Bars that integrate board games will strengthen appeal to adult customers and nightlife markets.
- Sustainability and locally sourced products will become key differentiators in food and beverage offerings.
- Competitive intensity will increase, encouraging innovation and stronger customer-focused strategies.


