Market Overview
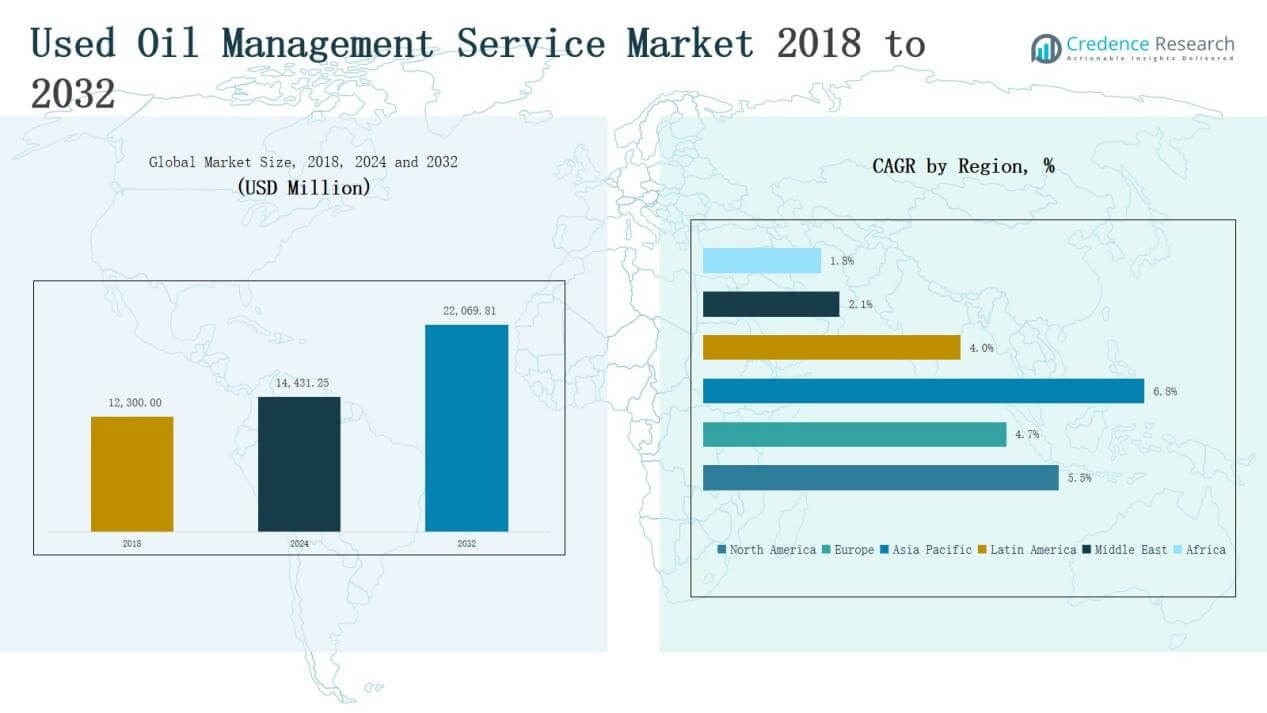
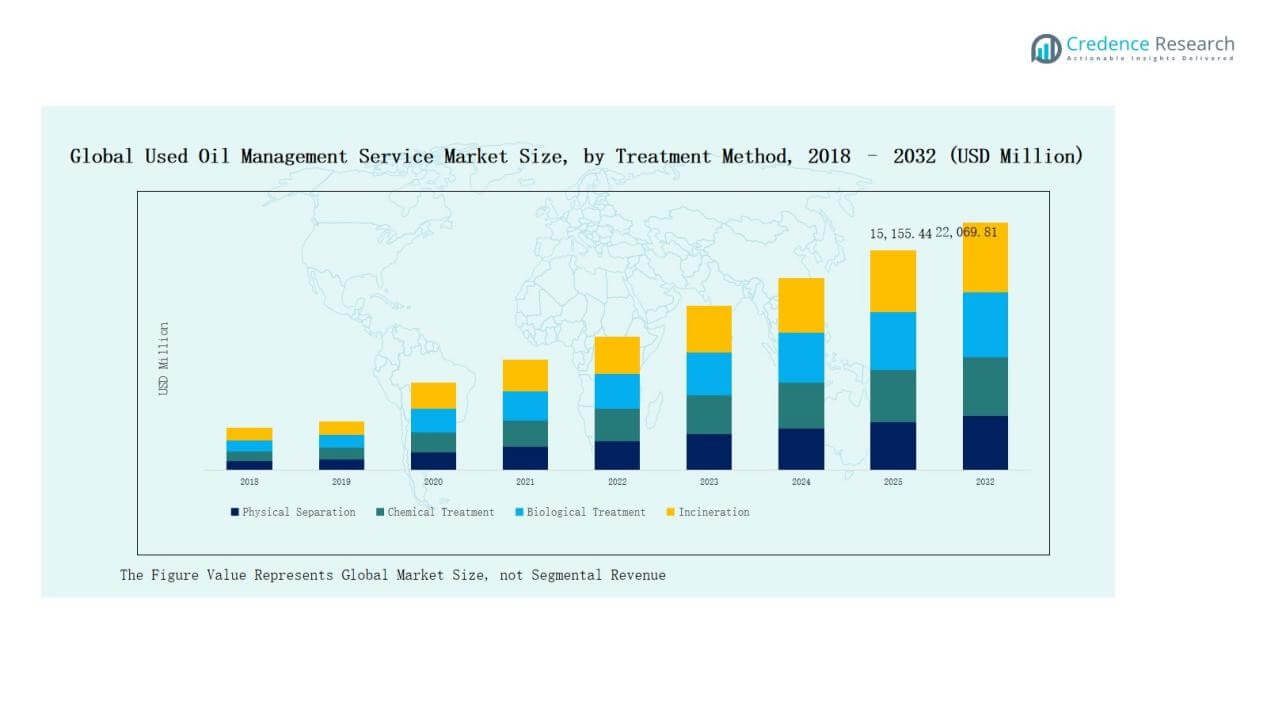
The Used Oil Management Service Market size was valued at USD 12,300.00 million in 2018, reached USD 14,431.25 million in 2024, and is anticipated to reach USD 22,069.81 million by 2032, at a CAGR of 5.52% during the forecast period.
| REPORT ATTRIBUTE |
DETAILS |
| Historical Period |
2020-2023 |
| Base Year |
2024 |
| Forecast Period |
2025-2032 |
| Used Oil Management Service Market Size 2024 |
USD 14,431.25 Million |
| Used Oil Management Service Market, CAGR |
5.52% |
| Used Oil Management Service Market Size 2032 |
USD 22,069.81 Million |
The Used Oil Management Service Market is shaped by global leaders such as Veolia Environmental Services, Safety-Kleen, Cleanaway Waste Management, Stericycle, Waste Management, Inc., and TotalEnergies, alongside regional players including Resolve Energy, Greenleaf Renewables, Oil Dri Corporation of America, International Used Oil Corporation, Modern Disposal Services, Envirofluid, and Aevitas Energy Canada Inc. These companies compete through extensive collection networks, advanced recycling technologies, and regulatory compliance expertise. North America emerged as the leading region in 2024 with a 44.7% share, supported by strong environmental policies, mature infrastructure, and significant industrial and automotive oil demand.
 Market Insights
- The Used Oil Management Service Market grew from USD 12,300.00 million in 2018 to USD 14,431.25 million in 2024 and is expected to reach USD 22,069.81 million by 2032, expanding at a 52% CAGR.
- Collection and transportation dominated service type in 2024 with a 45% share, followed by treatment and recycling at 35%, and storage and disposal at 20%, driven by compliance and sustainability needs.
- By industry, the automotive sector held 40% share in 2024, followed by industrial and manufacturing at 28%, with power generation, construction, and mining contributing the remaining demand.
- By source, industrial equipment led with 38% share in 2024, followed by automotive repair centers at 30%, while power plants, construction machinery, and commercial treatment methods together made up the rest.
- North America led with 44.7% share in 2024, valued at USD 6,459.34 million, supported by strict regulations and strong infrastructure, while Asia Pacific at 24.7% share remains the fastest-growing region.
Access crucial information at unmatched prices!
Request your sample report today & start making informed decisions powered by Credence Research Inc.!
Download Sample
Market Segment Insights
By Type of Service
Collection and transportation accounted for the largest share of the Used Oil Management Service Market in 2024, holding 45% of total revenue. Growth is driven by rising volumes of used oil generated across automotive workshops, industrial plants, and service centers, requiring organized logistics and compliance with environmental regulations. Treatment and recycling followed with about 35%, supported by sustainability goals and demand for re-refined products. Storage and disposal represented the remaining 20%, largely addressing safe containment and hazardous waste rules.
By Industry
The automotive sector dominated the Used Oil Management Service Market with 40% share in 2024. Frequent oil changes in passenger and commercial vehicles generate consistent waste volumes, creating strong demand for collection and recycling. Industrial and manufacturing accounted for nearly 28%, driven by heavy machinery and process equipment. Power generation held around 15%, supported by oil use in turbines and backup systems. Construction and mining contributed the rest, reflecting machinery-intensive operations and increasing regulations on waste oil disposal.
For instance, Shell Lubricants India launched an initiative to collect and recycle used oil from industrial and heavy-duty machinery as part of its circular economy program.
By Source of Used Oil
Industrial equipment emerged as the leading source, contributing about 38% of market revenue in 2024, fueled by large-scale machinery, hydraulic systems, and lubricants used in production facilities. Automotive repair centers followed with around 30%, as high vehicle maintenance activity consistently generates large oil volumes. Power plants contributed nearly 15%, reflecting continuous use of lubricants in turbines and engines. Construction machinery and commercial treatment methods shared the remainder, driven by infrastructure development and third-party waste oil processing requirements.
For instance, Valvoline Global announced an expanded used-oil collection program in the United States to capture industrial and automotive waste oil directly from manufacturing plants and workshops.
 Key Growth Drivers
Rising Environmental Regulations
Stringent global regulations on hazardous waste disposal are a major driver of the Used Oil Management Service Market. Governments enforce strict guidelines on collection, transportation, and recycling, compelling industries and automotive players to comply. These frameworks create stable demand for specialized service providers. Growing awareness of environmental sustainability and the harmful effects of improper disposal further accelerate adoption. Regulatory alignment also enables international companies to standardize operations across markets, strengthening service efficiency and driving long-term market expansion.
For instance, Safety-Kleen, part of Clean Harbors, introduced its new EcoPower recycled oil program in Canada, ensuring collected used oil is re-refined into high-quality lubricants in compliance with Canadian Environmental Protection Act regulations.
Expanding Automotive and Industrial Activity
The rising demand for vehicles and industrial machinery is fueling steady volumes of waste oil. Automotive workshops generate frequent oil changes, while industrial plants rely on heavy equipment needing regular lubrication. Both segments contribute significantly to used oil streams. This trend supports the growth of collection, transportation, and recycling services. Industrial growth in emerging economies, coupled with expanding vehicle ownership, ensures a consistent flow of waste oil, positioning the market for sustained demand across multiple industry verticals.
For instance, Valvoline launched its NextGen recycled motor oil line in the U.S., highlighting the commercial reuse of collected used oil streams.
Advancements in Recycling Technologies
Technological innovation in oil re-refining and recycling is reshaping the Used Oil Management Service Market. Advanced filtration, vacuum distillation, and hydrotreating enable higher yields of base oils and lower processing costs. These improvements make recycled oil competitive with virgin products while reducing environmental impact. Industries and automotive fleets are increasingly adopting re-refined oil as a sustainable alternative. Continuous research and investment into recycling technologies further drive service adoption, strengthening the economic and ecological case for systematic used oil management.
Key Trends & Opportunities
Circular Economy Integration
The shift toward a circular economy creates new opportunities for used oil management services. Companies focus on transforming waste oil into valuable resources like base oil, lubricants, and fuel. This reduces dependency on crude oil while meeting sustainability targets. Partnerships between recyclers and end-use industries are expanding to create closed-loop systems. Governments and corporations increasingly view circular models as strategic, offering significant incentives and investment opportunities for service providers to scale operations and capture new revenue streams.
For instance, Neste partnered with Pretred to advance circular solutions in transportation by blending re-refined oils into fuels and lubricants, supporting reduced lifecycle emissions.
Expansion in Emerging Markets
Emerging economies in Asia Pacific, Latin America, and Africa present strong growth opportunities. Rising industrialization, urbanization, and vehicle ownership generate significant waste oil volumes. However, infrastructure for collection and recycling is still developing. Service providers expanding into these regions benefit from first-mover advantages, government incentives, and growing regulatory enforcement. Collaborations with local players help build efficient networks, while demand for sustainable practices further accelerates adoption. This creates a robust opportunity for global and regional companies to establish leadership positions.
For instance, LubeTech entered into a partnership with distributors in Kenya to establish waste oil collection hubs, leveraging government-backed regulations on hazardous waste disposal.
Key Challenges
High Operational Costs
Managing used oil requires significant investment in logistics, treatment facilities, and compliance systems. Collection networks, safe transport, and advanced recycling technologies add to operational costs. Smaller players struggle to achieve economies of scale, limiting market participation. Fluctuating oil prices also affect the cost-benefit balance of recycling versus disposal. While demand is growing, high upfront and running costs remain a challenge for widespread adoption, pushing companies to innovate cost-efficient models while maintaining safety and regulatory standards.
Inconsistent Collection Infrastructure
In many regions, especially in developing economies, collection infrastructure for used oil is fragmented and underdeveloped. Small workshops and informal sectors often dispose of oil improperly, bypassing organized systems. This limits the volume of oil entering formal recycling channels, reducing efficiency and profitability for service providers. Building robust collection systems requires regulatory enforcement, industry collaboration, and public awareness. Without consistent collection mechanisms, large portions of waste oil remain unaccounted for, undermining both environmental and market growth objectives.
Limited Awareness and Adoption
Awareness among small-scale industries, automotive repair shops, and consumers about the benefits of used oil management remains low. Many stakeholders continue to treat waste oil as disposable waste rather than a recyclable resource. This perception slows adoption of organized services, particularly in regions with weak enforcement. Service providers face challenges in educating stakeholders and promoting re-refined oil products. Overcoming this barrier requires sustained awareness campaigns, regulatory pressure, and evidence of economic benefits, making it a persistent market challenge.
Regional Analysis
North America
North America led the Used Oil Management Service Market with a 44.7% share in 2024, valued at USD 6,459.34 million, up from USD 5,559.60 million in 2018. The market is projected to reach USD 9,867.45 million by 2032, registering a CAGR of 5.5%. Growth is driven by strong environmental regulations, a mature automotive service industry, and widespread adoption of recycling technologies. The U.S. dominates regional demand, supported by large-scale industrial oil usage and established collection infrastructure. Canada and Mexico contribute through policy initiatives and rising industrialization, reinforcing North America’s leadership in sustainable oil management solutions.
Europe
Europe accounted for a 23.1% share of the market in 2024, with revenue rising from USD 2,966.76 million in 2018 to USD 3,333.22 million in 2024, and is forecasted to reach USD 4,788.10 million by 2032 at a CAGR of 4.7%. Strict EU directives on waste management and circular economy initiatives are the primary growth drivers. Countries such as Germany, France, and the UK are leading adopters, supported by advanced recycling infrastructure. Industrial sectors and automotive fleets create steady demand, while increasing focus on sustainable disposal practices continues to strengthen Europe’s market positioning across treatment and recycling services.
Asia Pacific
Asia Pacific is the fastest-growing region, holding a 24.7% share in 2024, with revenue increasing from USD 2,902.80 million in 2018 to USD 3,562.29 million in 2024. The market is projected to reach USD 6,031.70 million by 2032, expanding at a CAGR of 6.8%. Growth is fueled by rapid industrialization, a booming automotive sector, and government initiatives supporting sustainable waste management. China and India dominate demand due to large vehicle fleets and manufacturing activity, while Japan and South Korea drive advanced recycling adoption. Rising urbanization and environmental awareness further position Asia Pacific as the key growth hub globally.
Latin America
Latin America represented a 4.1% market share in 2024, with revenue moving from USD 506.76 million in 2018 to USD 585.76 million in 2024, and expected to reach USD 796.06 million by 2032 at a CAGR of 4.0%. Brazil is the largest contributor, driven by automotive service demand and rising industrial oil usage. Argentina and other regional markets are gradually adopting structured waste oil collection and recycling practices. Government-backed initiatives to improve environmental compliance and waste treatment capacity are supporting growth, though infrastructure gaps and limited awareness in smaller economies remain ongoing challenges for market penetration.
Middle East
The Middle East held a 1.5% share in 2024, with revenue increasing from USD 215.25 million in 2018 to USD 217.82 million in 2024, and is forecast to reach USD 256.13 million by 2032, growing at a CAGR of 2.1%. Market growth is slower compared to other regions due to limited recycling infrastructure and reliance on conventional disposal methods. However, GCC countries are adopting stricter regulations and investing in waste management services to align with sustainability goals. Oil-rich economies are gradually diversifying, with demand emerging from industrial hubs and automotive sectors in the UAE and Saudi Arabia.
Africa
Africa accounted for a 2.0% share in 2024, recording USD 148.83 million in 2018, USD 272.81 million in 2024, and projected to reach USD 330.37 million by 2032 at a CAGR of 1.8%. The region shows steady but limited growth due to underdeveloped collection networks and weak regulatory enforcement. South Africa leads regional demand, supported by its industrial and automotive base. Egypt and Nigeria are gradually expanding waste oil management systems through government-led sustainability programs. While infrastructure challenges persist, increasing industrialization and international partnerships present opportunities for service providers to expand operations in Africa’s emerging markets.
 Market Segmentations:
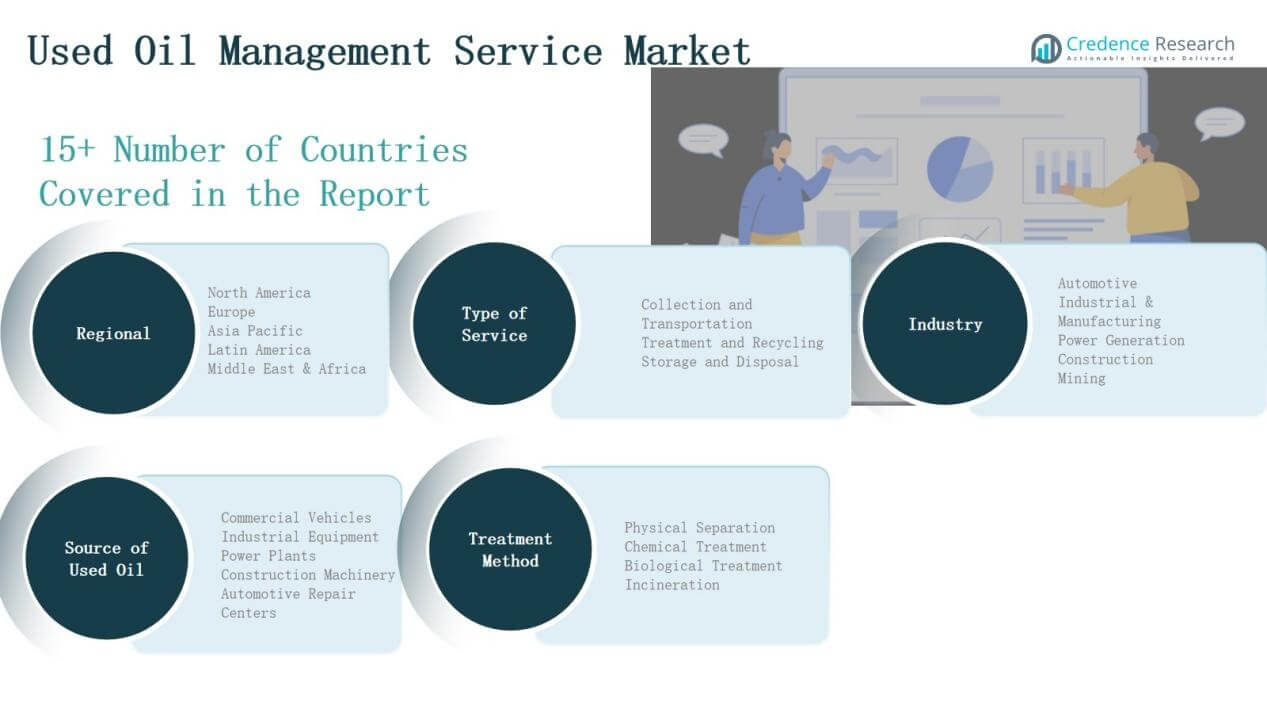
By Type of Service
- Collection and Transportation
- Treatment and Recycling
- Storage and Disposal
By Industry
- Automotive
- Industrial & Manufacturing
- Power Generation
- Construction
- Mining
By Source of Used Oil
- Commercial Treatment Methods
- Industrial Equipment
- Power Plants
- Construction Machinery
- Automotive Repair Centers
By Treatment Method
- Physical Separation
- Chemical Treatment
- Biological Treatment
- Incineration
By Region
- North America
- Europe
- UK
- France
- Germany
- Italy
- Spain
- Russia
- Belgium
- Netherlands
- Austria
- Sweden
- Poland
- Denmark
- Switzerland
- Rest of Europe
- Asia Pacific
- China
- Japan
- South Korea
- India
- Australia
- Thailand
- Indonesia
- Vietnam
- Malaysia
- Philippines
- Taiwan
- Rest of Asia Pacific
- Latin America
- Brazil
- Argentina
- Peru
- Chile
- Colombia
- Rest of Latin America
- Middle East
- UAE
- KSA
- Israel
- Turkey
- Iran
- Rest of Middle East
- Africa
- Egypt
- Nigeria
- Algeria
- Morocco
- Rest of Africa
Competitive Landscape
The Used Oil Management Service Market is highly fragmented, with global leaders and regional specialists competing across collection, recycling, and disposal services. Key players such as Veolia Environmental Services, Safety-Kleen, Cleanaway Waste Management, Stericycle, and Waste Management, Inc. dominate through extensive networks, advanced recycling technologies, and compliance expertise. These companies emphasize strategic acquisitions, partnerships, and investment in re-refining facilities to strengthen market presence. Regional firms like Resolve Energy, Greenleaf Renewables, and Aevitas Energy Canada Inc. expand by offering localized solutions tailored to regulatory and industry needs. Oil majors such as TotalEnergies also integrate waste oil management into sustainability portfolios, creating competitive pressure. Price competitiveness, regulatory compliance, and service reliability remain central differentiators. Innovation in recycling processes and digital tracking solutions further intensifies rivalry, while opportunities in emerging markets encourage new entrants. Overall, competition is driven by sustainability commitments, customer partnerships, and the ability to scale operations efficiently across geographies.
Shape Your Report to Specific Countries or Regions & Enjoy 30% Off!
Key Players
- Veolia Environmental Services
- Safety-Kleen
- Stok Corporation
- Cleanaway Waste Management
- Stericycle, Inc.
- Waste Management, Inc.
- Resolve Energy
- Greenleaf Renewables
- Oil Dri Corporation of America
- International Used Oil Corporation
- TotalEnergies
- Modern Disposal Services
- Envirofluid
- Aevitas Energy Canada Inc.
Recent Developments
- On June 26, 2025, Veolia acquired New England Disposal Technologies, New England MedWaste, and Ingenium to expand its hazardous waste and used-oil treatment capabilities in the U.S.
- On May 2, 2024, Clean Harbors / Safety-Kleen acquired Noble Oil Recycling (North Carolina) to increase its oil collection footprint and re-refining capacity.
- On April 11, 2024, Castrol and Safety-Kleen launched a multi-year “MoreCircular” program in the U.S. to collect used oil, re-refine it, and integrate re-refined base oil into new lubricants.
Report Coverage
The research report offers an in-depth analysis based on Type of Service, Industry, Source of Used Oil, Treatment Method and Region. It details leading market players, providing an overview of their business, product offerings, investments, revenue streams, and key applications. Additionally, the report includes insights into the competitive environment, SWOT analysis, current market trends, as well as the primary drivers and constraints. Furthermore, it discusses various factors that have driven market expansion in recent years. The report also explores market dynamics, regulatory scenarios, and technological advancements that are shaping the industry. It assesses the impact of external factors and global economic changes on market growth. Lastly, it provides strategic recommendations for new entrants and established companies to navigate the complexities of the market.
Future Outlook
- Demand for recycling services will rise as industries prioritize sustainability practices.
- Automotive sector will continue generating high volumes of used oil for treatment.
- Industrial expansion in emerging economies will create new growth opportunities.
- Digital tools for tracking and compliance will improve service efficiency.
- Advanced re-refining technologies will enhance quality of recycled base oils.
- Partnerships between global and regional firms will expand collection networks.
- Governments will enforce stricter disposal rules to reduce environmental risks.
- Circular economy models will drive greater adoption of used oil recycling.
- Infrastructure development in developing regions will strengthen formal waste channels.
- Service providers will diversify offerings to include energy recovery and reuse.


