Market Overview
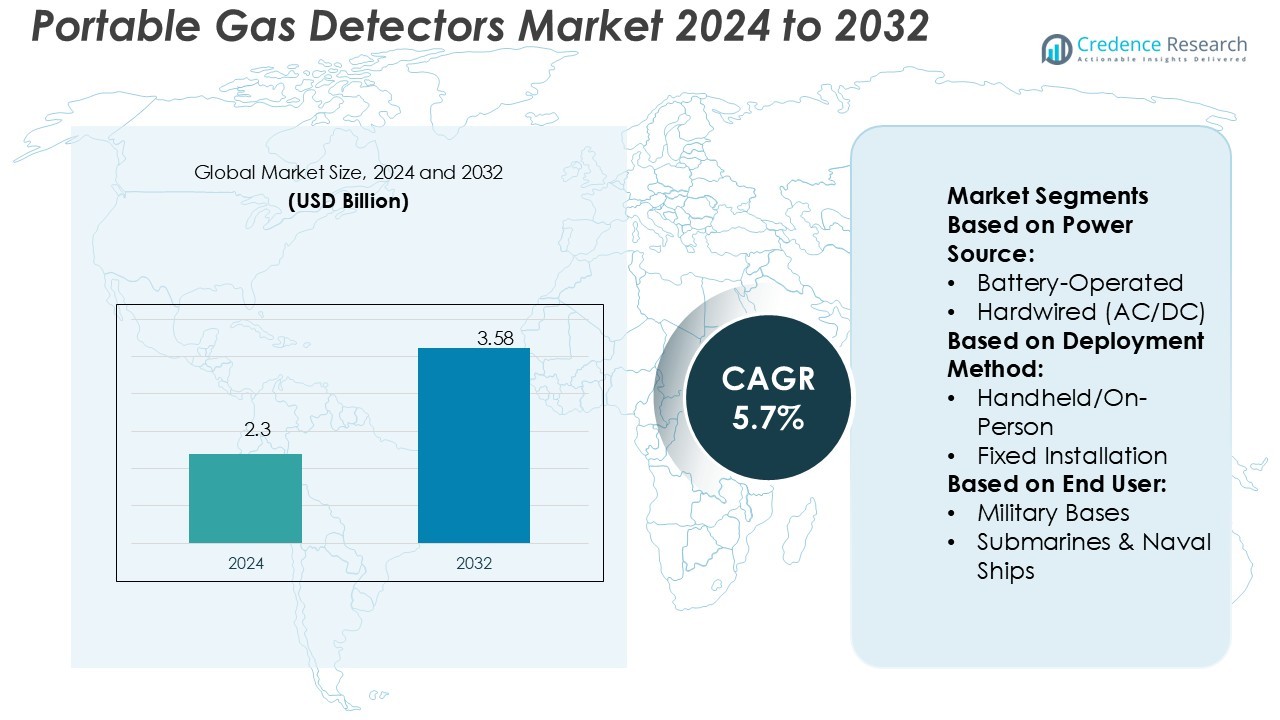
Portable Gas Detectors Market size was valued USD 2.3 billion in 2024 and is anticipated to reach USD 3.58 billion by 2032, at a CAGR of 5.7% during the forecast period.
| REPORT ATTRIBUTE |
DETAILS |
| Historical Period |
2020-2023 |
| Base Year |
2024 |
| Forecast Period |
2025-2032 |
| Portable Gas Detectors Market Size 2024 |
USD 2.3 Billion |
| Portable Gas Detectors Market, CAGR |
5.7% |
| Portable Gas Detectors Market Size 2032 |
USD 3.58 Billion |
The portable gas detectors market features strong competition among top players such as ABB, Airtest Technologies, Inc., Teledyne Technologies Incorporated, General Electric Company, Fluke Corporation, Honeywell International Inc., Opgal Optronics Industries Limited, Lynred, Thermo Fisher Scientific, Inc., and Siemens. These companies emphasize advanced sensor technologies, wireless connectivity, and rugged designs to address safety demands across industrial, defense, and energy sectors. North America leads the market with a 34% share, supported by stringent regulatory frameworks, high adoption of IoT-enabled devices, and extensive deployment in oil & gas, mining, and defense applications, reinforcing the region’s dominant position.
Access crucial information at unmatched prices!
Request your sample report today & start making informed decisions powered by Credence Research Inc.!
Download Sample
Market Insights
- The Portable Gas Detectors Market size was USD 2.3 billion in 2024 and is projected to reach USD 3.58 billion by 2032, growing at a CAGR of 5.7% during the forecast period.
- Market growth is driven by stricter workplace safety regulations, rising industrial hazards, and increasing adoption of multi-gas detection devices across oil & gas, mining, and chemical sectors.
- Key trends include IoT-enabled detectors, wireless connectivity, and predictive analytics integration, enhancing real-time monitoring and preventive safety strategies.
- Competition remains intense, with leading players such as ABB, Honeywell International Inc., Siemens, and Thermo Fisher Scientific focusing on product innovation, rugged designs, and global expansion, while high equipment and maintenance costs act as restraints.
- Regionally, North America dominates with a 34% share due to strict safety compliance and high adoption in defense and energy industries, while battery-operated detectors lead segmental demand with over 52% share, reflecting their portability and efficiency.
Market Segmentation Analysis:
By Power Source
Battery-operated gas detectors dominate the market with over 52% share, supported by portability, long runtime, and suitability for field use. These detectors provide flexibility across industrial and defense settings where wired connections are not practical. Demand for rechargeable lithium-ion technology enhances reliability, with extended operation times reducing maintenance intervals. Hardwired detectors remain important in fixed sites, while solar-powered and hybrid models see adoption in remote or off-grid applications. The dominance of battery-operated devices reflects end-user demand for mobility, efficiency, and easy deployment across critical environments.
- For instance, California Air Tools introduced its Ultra Quiet Series with some models operating at sound levels as low as 60 decibels, while the 8010SPC model is equipped with a 1.0 horsepower motor in a soundproof cabinet to achieve an even quieter 40 decibels. This model delivers 3.0 CFM at 90 PSI.
By Deployment Method
Handheld/on-person detectors account for 48% of market share, driven by frontline safety applications in defense, mining, and oil and gas operations. Their compact design enables immediate hazard detection, safeguarding personnel in confined or mobile environments. Fixed installations follow, particularly in chemical and petrochemical plants, where continuous monitoring is required for compliance and operational safety. Vehicle/drone-mounted and wireless mesh systems are growing due to smart infrastructure and remote sensing needs. The widespread use of handheld devices underscores their role in personal protection and operational responsiveness.
- For instance, Doosan Portable Power launched its oil-free compressor model NHP1500, delivering up to 1,500 cfm at 150 psi. The compressor ensures zero oil carryover in sensitive applications.
By End-User
The oil and gas sector leads with 36% share, driven by stringent safety regulations and high exposure to hazardous gases in drilling, refining, and distribution operations. These environments require multi-gas detectors for leak prevention, worker safety, and operational continuity. The defense and government sector follows, especially in NBC shelters and submarines, where portable units ensure personnel safety under high-risk conditions. Utilities, mining, and chemical industries adopt detectors to mitigate accident risks and ensure compliance. Oil and gas dominance reflects the sector’s critical reliance on reliable, field-deployable gas detection systems.
Key Growth Drivers
Rising Emphasis on Workplace Safety Regulations
Stringent government regulations and industry standards drive demand for portable gas detectors across oil & gas, mining, and chemical sectors. Companies must comply with occupational health and safety norms, which mandate reliable gas detection to prevent accidents and fatalities. Increasing workplace incidents related to toxic and combustible gases reinforce this demand. Employers prioritize portable detectors to ensure real-time monitoring and worker safety. As regulations tighten globally, the adoption of advanced, multi-gas detection solutions continues to accelerate across industrial and defense applications.
- For instance, Kaeser Kompressoren SE introduced the Mobilair M255 portable compressor, capable of delivering 900 CFM at 125 psi, with a fuel-efficient Cummins diesel engine.
Technological Advancements in Detection Capabilities
Innovations in sensor technology, wireless connectivity, and IoT integration strengthen the appeal of portable gas detectors. Modern devices now provide faster response times, improved accuracy, and data transmission to centralized monitoring systems. Real-time analytics support predictive maintenance and risk assessment, reducing downtime and enhancing operational safety. Miniaturization of sensors also expands detector applications to compact and mobile environments. These advancements improve user confidence and compliance readiness, positioning portable gas detectors as critical tools in industrial safety ecosystems.
- For instance, Ingersoll Rand introduced its R-Series RS200-250 compressors featuring variable speed drives, achieving up to 35% energy savings compared to fixed-speed models, with capacities ranging from 200 to 250 horsepower and delivering flows up to 1,188 cubic feet per minute (CFM) at 125 psi, significantly lowering operating costs for industrial users.
Expansion of Oil, Gas, and Mining Activities
The global expansion of oil, gas, and mining operations creates a consistent demand for portable gas detectors. Exploration and refining activities expose workers to hazardous gases such as methane, hydrogen sulfide, and carbon monoxide, increasing the need for reliable detection equipment. Growth in shale gas exploration and deep-sea drilling further amplifies risk, requiring advanced detection systems. Mining operations, especially in developing countries, also emphasize worker safety. This sector’s scale and complexity ensure that portable detectors remain essential for safeguarding personnel and assets.
Key Trends & Opportunities
Integration of Wireless and IoT Technologies
The integration of IoT and wireless mesh networks transforms portable gas detection by enabling real-time data sharing and cloud-based monitoring. Organizations can now track gas exposure levels remotely, receive instant alerts, and optimize safety protocols. This trend also opens opportunities for predictive analytics, helping companies prevent accidents before they occur. Demand is rising for smart, connected detectors compatible with digital safety ecosystems. Such integration not only improves efficiency but also supports compliance with increasingly data-driven safety regulations worldwide.
- For instance, the Husky 30 Gal. 175 PSI Oil Lubed Belt Drive Air Compressor (Model C304H), which features a cast-iron, oil-lubricated single-stage pump, delivers 6.2 SCFM at 90 psi.
Rising Adoption in Defense and Aerospace Applications
Defense and aerospace sectors present expanding opportunities for portable gas detectors due to growing investments in chemical, biological, radiological, and nuclear (CBRN) defense. Military bases, submarines, and ammunition storage facilities rely on advanced detectors to ensure operational safety under high-risk conditions. The increasing focus on soldier protection and rapid response to hazardous threats drives procurement of multi-functional and ruggedized devices. This trend positions the defense sector as a strategic growth area, with significant opportunities for manufacturers to deliver specialized solutions.
- For instance, Sullair introduced the Mid-Range Series portable compressors, delivering between 800 and 1,100 CFM at operating pressures of 100 to 200 psi.
Key Challenges
High Cost of Advanced Detection Systems
Portable gas detectors with multi-gas capabilities, IoT integration, and real-time analytics often carry high upfront costs. For small and medium enterprises, these expenses create barriers to adoption, especially in cost-sensitive markets. Ongoing calibration, sensor replacement, and maintenance add to operational costs, further limiting widespread use. While advanced detectors enhance safety, the investment required delays procurement in several industries. Manufacturers must balance innovation with affordability to increase adoption across a broader base of users.
Sensor Reliability and Environmental Limitations
Portable gas detectors face challenges related to sensor sensitivity and environmental interference. Factors such as humidity, extreme temperatures, and dust can affect accuracy, leading to false alarms or missed detections. In industries where reliable monitoring is critical, such limitations compromise safety protocols and user trust. Frequent recalibration requirements also increase maintenance efforts. Overcoming these reliability issues requires continuous R&D investment in sensor technology, which adds complexity for manufacturers and slows large-scale deployment in harsh operating conditions.
Regional Analysis
North America
North America holds the leading position in the portable gas detectors market with a 34% share, supported by stringent OSHA and EPA regulations. The region benefits from high adoption in oil & gas, petrochemical, and mining industries, alongside strong demand from defense and aerospace sectors. Advanced infrastructure and early adoption of IoT-enabled detectors further strengthen its dominance. The United States remains the primary revenue contributor, driven by shale gas exploration and strict workplace safety mandates. Canada follows closely, with growing adoption across utilities and mining operations, ensuring steady demand for portable multi-gas detection solutions.
Europe
Europe accounts for 27% of the portable gas detectors market, driven by strict EU workplace safety directives and environmental regulations. Countries such as Germany, the UK, and France lead adoption, particularly in chemical, petrochemical, and defense applications. The presence of major aerospace and defense contractors further fuels demand for rugged and multi-functional detection systems. Increasing investments in renewable energy infrastructure also encourage safety monitoring technologies. The European market emphasizes innovation, with manufacturers focusing on wireless integration and miniaturized sensors to meet industrial needs while complying with the region’s high safety and sustainability standards.
Asia-Pacific
Asia-Pacific captures 25% of the portable gas detectors market, emerging as the fastest-growing region due to industrialization and urban expansion. China and India dominate adoption, supported by extensive oil refining, mining, and manufacturing industries where gas hazards are prevalent. Japan and South Korea contribute through strong defense and electronics sectors demanding advanced detection solutions. The region benefits from rising workplace safety awareness and government initiatives to strengthen compliance in hazardous industries. Cost-effective production and growing demand for wireless-enabled devices position Asia-Pacific as a critical growth hub, offering long-term opportunities for global and regional manufacturers.
Latin America
Latin America represents 8% of the portable gas detectors market, primarily driven by oil & gas, mining, and chemical industries. Brazil and Mexico lead demand, with extensive offshore drilling operations and mining activities requiring reliable detection equipment. Regulatory frameworks are gradually aligning with global standards, prompting increased adoption of advanced monitoring solutions. Portable detectors are increasingly deployed in utilities and energy sectors to address operational risks. While cost constraints remain a challenge, rising investment in industrial safety and infrastructure modernization supports steady growth, making the region an emerging but important contributor to global demand.
Middle East & Africa
The Middle East & Africa accounts for 6% of the portable gas detectors market, supported by high demand from oil & gas operations and defense applications. Countries such as Saudi Arabia, the UAE, and South Africa lead adoption, with significant investments in petrochemical industries and energy infrastructure. Military applications, including NBC shelters and naval operations, add further traction. The region emphasizes rugged, multi-gas detection systems capable of withstanding extreme environmental conditions. While overall adoption remains modest compared to other regions, expanding safety regulations and industrial projects present strong potential for future market growth.
Market Segmentations:
By Power Source:
- Battery-Operated
- Hardwired (AC/DC)
By Deployment Method:
- Handheld/On-Person
- Fixed Installation
By End User:
- Military Bases
- Submarines & Naval Ships
By Geography
- North America
- Europe
- Germany
- France
- U.K.
- Italy
- Spain
- Rest of Europe
- Asia Pacific
- China
- Japan
- India
- South Korea
- South-east Asia
- Rest of Asia Pacific
- Latin America
- Brazil
- Argentina
- Rest of Latin America
- Middle East & Africa
- GCC Countries
- South Africa
- Rest of the Middle East and Africa
Competitive Landscape
The portable gas detectors market is characterized by strong competition among leading players including ABB, Airtest Technologies, Inc., Teledyne Technologies Incorporated, General Electric Company, Fluke Corporation, Honeywell International Inc., Opgal Optronics Industries Limited, Lynred, Thermo Fisher Scientific, Inc., and Siemens. The portable gas detectors market is highly competitive, shaped by continuous innovation, regulatory compliance, and rising demand across industries. Manufacturers focus on developing compact, multi-gas, and IoT-enabled devices that enhance worker safety and operational efficiency. Real-time data connectivity, wireless integration, and predictive analytics are becoming standard features, enabling proactive risk management. The market also reflects growing emphasis on rugged, durable designs suitable for harsh industrial and defense environments. Companies pursue strategies such as product diversification, technology partnerships, and regional expansion to strengthen their market presence and meet the evolving safety requirements of global industries.
Shape Your Report to Specific Countries or Regions & Enjoy 30% Off!
Key Player Analysis
Recent Developments
- In May 2024, Samon launched the GLACIÄR X5. GLACIÄR X5 is an industrial refrigeration gas detector with single and dual-sensor technology that are used in Zone 1 and Zone 2 hazardous areas.
- In April 2025, Mann+Hummel significantly enhanced operational efficiency at its U.S. plant by upgrading its compressed air system with ELGi’s technology. This overhaul, carried out in collaboration with Patton’s Inc., has resulted in annual savings exceeding and a reduction in energy consumption.
- In March 2025, TEWATT introduced its Stage V Dual-Mode Air Compressor, designed to meet the stringent EU Stage V emission standards. This portable diesel-driven compressor offers a versatile pressure range of up to 21 bar, making it suitable for various applications such as water well drilling, geothermal drilling, and oil & gas exploration. Powered by a Volvo TAD883VE engine, it ensures stable performance even in extreme temperatures and challenging environments.
- In January 2024, Teledyne FLIR, a separate subsidiary of Teledyne Technologies Incorporated, announced the launch of the Neutrino LC OGI, a camera module designed especially for UAV-based gas leak detection. This Mid-Wave Infrared (MWIR) imaging module can seamlessly integrate with Unmanned Aerial Vehicles (UAVs) and other devices to identify, quantify, and visualize methane and other hydrocarbon gas emissions.
Report Coverage
The research report offers an in-depth analysis based on Power Source, Deployment Method, End-User and Geography. It details leading market players, providing an overview of their business, product offerings, investments, revenue streams, and key applications. Additionally, the report includes insights into the competitive environment, SWOT analysis, current market trends, as well as the primary drivers and constraints. Furthermore, it discusses various factors that have driven market expansion in recent years. The report also explores market dynamics, regulatory scenarios, and technological advancements that are shaping the industry. It assesses the impact of external factors and global economic changes on market growth. Lastly, it provides strategic recommendations for new entrants and established companies to navigate the complexities of the market.
Future Outlook
- The market will expand with stricter workplace safety regulations across industries.
- Wireless and IoT-enabled detectors will see higher adoption for real-time monitoring.
- Multi-gas detection systems will dominate due to increasing complexity of industrial hazards.
- Defense and aerospace applications will drive demand for ruggedized detection devices.
- Mining and oil & gas industries will remain key contributors to global growth.
- Sensor miniaturization will support the development of compact and wearable detectors.
- Predictive analytics integration will strengthen preventive safety and maintenance strategies.
- Emerging economies will create new opportunities through industrialization and regulatory alignment.
- Environmental monitoring will become a stronger application area for portable detectors.
- Partnerships and acquisitions will accelerate innovation and global market expansion.


