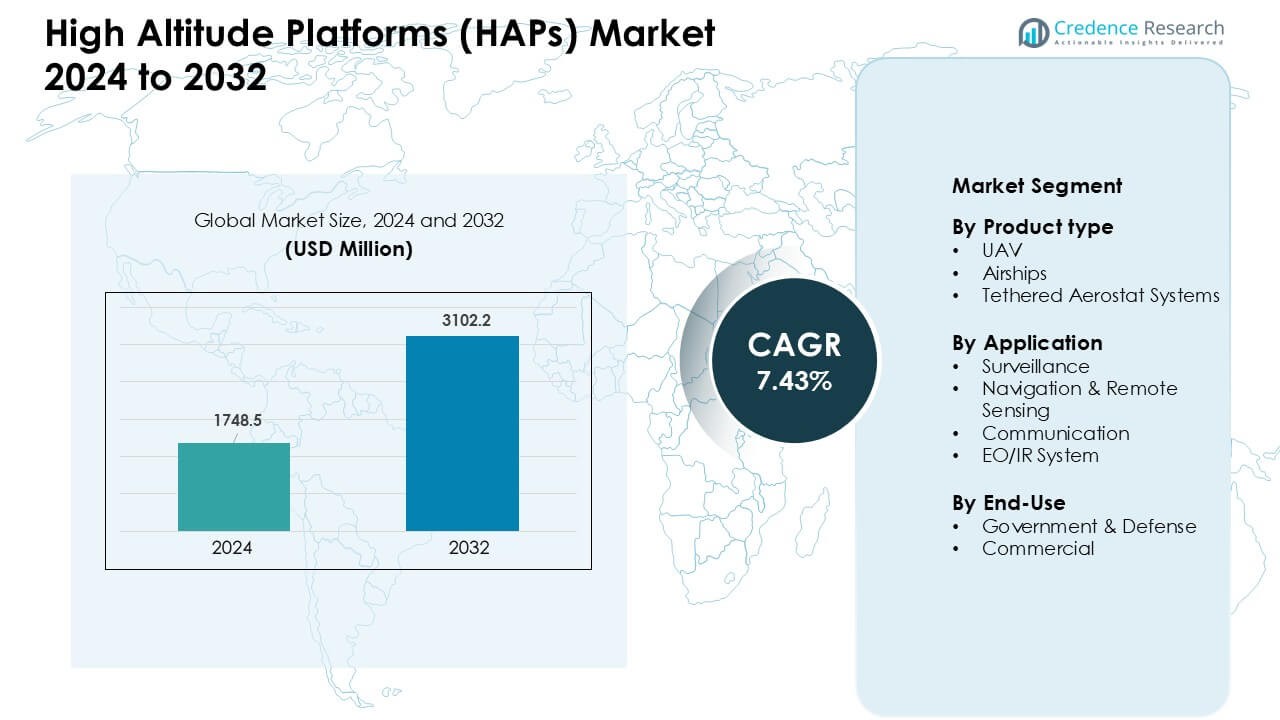
Home » Aerospace & defense » High Altitude Platforms (HAPs) Market

Global High Altitude Platforms (HAPs) Market By Type (Airships and Tethered Aerostat Systems) By Payload (Communication Systems, Surveillance Systems and Navigation Systems) By Application (Government & Defense, Commercial and Others) Growth, Future Prospects & Competitive Analysis, 2016 – 2030

Price: $4999

Published: | Report ID: 6809 | Report Format : PDF

Key Highlights of the Report

How are the major segments performing in the High Altitude Platforms market?

  • In 2022, airship segment dominated the market due to increasing demand in the government sector for surveillance.
  • In 2022, communications systems dominated the market with the largest revenue share.
  • Government and defense was the largest application segment in 2022 due to the importance of incorporating advanced technology for defense and surveillance.

How does the Market Size of High Altitude Platforms regard to value?

The global high altitude platforms market is anticipated to grow at a substantial CAGR of 8.5% in the upcoming years. The global high altitude platforms industry was estimated to be worth USD 3.6 billion in 2022 and was expected to be worth USD 6.4 million by 2028.

Design Element 2

Access crucial information at unmatched prices!

Request your free sample report today & start making informed decisions powered by Credence Research!

Download Free Sample
CTA Design Element 3

Which region dominated the high altitude platforms market?

Over the course of the forecast, North America is anticipated to account for the greatest market share in the world market for high-altitude platforms. This is due to the region’s early adoption of HAPs and considerable defense spending in nations like the United States and Canada. Over the next seven years, market growth in North America is also predicted to be driven by ongoing technological developments linked to HAPs.

High Altitude Platforms (HAPs) Market

How is US Market Performing in the high altitude platforms market?

During the projection, the US is predicted to hold the largest market share in the North American high-altitude platform market. This results from the nation’s high defense spending and the region’s early adoption of HAPs. Additionally, it is anticipated that market growth in the US over the next seven years will be fueled by continued technological advancements related to HAPs.

How is the economy impacting the global high altitude platforms market growth?

The rise in inflation rates that many nations have witnessed has substantially impacted the market. Budgets for government organizations have been trimmed, and spending on surveillance equipment has been reduced. Additionally, market liquidity may decrease. Due to the Russia-Ukraine War, businesses that purchased goods from Russia and Ukraine faced severe losses. Each of these factors has the potential to limit market expansion. Significant enterprises’ capital expenditures were negatively influenced by the release of Covid-19 into the market.

What is the competitive environment of the high altitude platforms market?

Several key companies dominate the fake high-altitude satellites business and are all active globally. The market is extremely competitive, with participants vying for the biggest share. It is anticipated that difficulties with spectrum management, HAPS’s endurance constraints, and the cancellation of active projects will restrict market expansion. Players in the market compete based on their internal manufacturing capabilities, worldwide footprint network, product offers, R&D investments, and a sizable customer base.

Executive Summary

What are the key trends in the High Altitude Platforms market?

  • To meet the need for high-capacity wireless services, particularly the last-mile delivery in rural locations with sparse ground-based network coverage, telecommunication service providers are progressively using HAPs.
  • In addition to being a great choice for emergency communications, HAPS offers improved network flexibility and configurability and is thus well-suited for interim provision of basic and additional capacity requirements. As a result, agencies are using them more frequently during rescue missions.

What is the market understanding of the High Altitude Platforms Market?

High altitude platforms (HAPs) fly at 20,000 feet or higher and are employed for various tasks, including surveillance, telecommunications, and weather monitoring. Airships, unmanned aerial vehicles (UAV), and tethered aerostat systems are the three primary categories of HAPs. Airships are lighter-than-air (LTA) devices that can be guided and pushed into the air using their onboard motors and rudders. Although some employ heated air for buoyancy, helium or hydrogen are the most common fillers for airships. Blimps, airships, and zeppelins are non-rigid, semi-rigid, and rigid airships, respectively. Unmanned aerial vehicles (UAVs) are aircraft flown remotely or automatically by computers onboard. UAVs, usually drones, are employed more frequently for commercial, military, and civilian purposes.

Which are the key investments by the High Altitude Platforms market players?

The global expansion of Internet services is another factor driving the demand for HAPs. HAPs are being used more frequently to supply wireless Internet services, which are anticipated to experience rapid expansion in the years to come. Project Loon by Google, Inc., one of the most well-known examples, proposes to deliver Internet services through aerostat devices (balloons) installed in the stratosphere. However, there are several issues with costs and operational obstacles that the HAPs market must deal with. The high initial and ongoing expenses of UAV aircraft are a substantial barrier to the market for HAPs, though far less so than satellite systems. Due to this, nations with limited defense expenditures cannot use these systems.

Some major players in the high altitude platforms market are TCOM L.P., Lockheed Martin Corporation, Raytheon Company, Northrop Grumman Corporation, Lindstrand Technologies Ltd., Israel Aerospace Industries Ltd., ILC Dover L.P., Rafael Advanced Defense Systems Ltd., AeroVironment, Inc., and Aerostar International, Inc.

What are the Major Driving Factors for the High Altitude Platforms Market?

Increasing commercial and governmental demand for HAPs in nations like India, China, and Israel. The region’s major players’ rising investments are anticipated to expand the market. The demand for HAPs from business and government organizations is increasing for various uses, including surveillance, telecommunications, and weather monitoring. Another element that is anticipated to fuel market growth is the growing number of HAP applications. Due to their close closeness to the Earth’s surface compared to satellites, these systems have quicker turnaround times.

Furthermore, the rising defense spending of important nations worldwide greatly impacts the HAPs market. Regarding revenue and adoption, the market’s largest segment is government & defense. As a result, increasing spending on surveillance systems is anticipated to fuel market expansion in the years to come significantly.

What are the Major Risks for the High Altitude Platforms Market?

There are challenges and limitations for the HAP industry in terms of operational altitude and weather-related survival. These limitations are projected to present significant hurdles for the market throughout the forecast period. Additionally, limitations on operational altitude prevent market expansion.

Which is the key application in the high altitude platforms market?

During the projection period, the government and defense industry will dominate the market. The expansion of this industry can be ascribed to the growing number of government organizations using high-altitude platforms for diverse purposes, including border surveillance, intelligence gathering, and disaster management. The expansion of this industry can be ascribed to the growing number of government organizations using high-altitude platforms for diverse purposes, including border surveillance, intelligence gathering, and disaster management.

The sector expected to experience the highest CAGR during the predicted period is the commercial sector. The rise in demand for high-altitude platforms from various end-user industries, including telecommunications, remote sensing, and meteorology, is responsible for expanding the commercial sector. The increased demand for high altitude platforms from a variety of end-users, including telecommunications, remote sensing, and meteorology, can be directly linked to the expansion of the telecommunications industry.

How is the high altitude platforms market performing in regions?

Over the course of the forecast, North America is anticipated to account for the greatest market share in the world market for high-altitude platforms. This is due to the region’s early adoption of HAPs and considerable defense spending in nations like the United States and Canada. Over the next seven years, market growth in North America is also predicted to be driven by ongoing technological developments linked to HAPs. This can be ascribed to rising defense spending and tensions among various nations in this part of Europe. The significant demand for HAPs from the region’s nations, including Germany, France, and the UK, is responsible for this increase.

The market in Europe is expanding as a result of the expanding usage of HAPs for commercial purposes. The forecast period is expected to see the highest growth in the Asia Pacific area. The rise in HAP demand from regional nations like China and India drives this expansion. Additionally, the growth in the Middle East, Africa, and Asia Pacific is fuelled by an increase in HAP usage of HAPs for commercial purposes. Factors including the increasing demand for HAPs from businesses and governments in nations like India, China, and Israel are responsible for the region’s rise. Additionally, the market expansion is anticipated to be boosted by the rising investments made by important companies in the area.

Shape Your Report to Specific Countries or Regions & Enjoy 30% Off!

What are the major players planning for the future of the high altitude platforms market?

Market participants are investing heavily in creating cutting-edge HAPS systems to increase adoption. The development of enhanced power systems, which can increase the endurance of HAPS platforms, is receiving research attention. In October 2015, Neah Power System created the Formira Hydrogen-On-Demand technology, which produces hydrogen from liquid formic acid. Formic acid is to be moved from the tank to a reformer, where the stack produces and uses hydrogen immediately. The method makes HAPS UAVs less prone to flammability difficulties related to high temperatures in the stratosphere because the created gases are never retained.

REPORT ATTRIBUTE DETAILS
High Altitude Platforms Market by Volume Yes
High Altitude Platforms Market by Value Yes
High Altitude Platforms Market, Tornado Analysis Yes
High Altitude Platforms Market, STAR Analysis Yes
High Altitude Platforms Market, SRC Analysis Yes
High Altitude Platforms Market, Import-Export Data Yes (On Demand)
High Altitude Platforms Market Pricing Analysis Yes (On Demand)
High Altitude Platforms Market Segment Analysis By Type (Airships and Tethered Aerostat Systems)

By Payload (Communication Systems, Surveillance Systems and Navigation Systems)

By Application (Government & Defense, Commercial and Others)

High Altitude Platforms Market, Regional Analysis Europe (Germany, Spain, UK, France, Italy, and Rest of Europe)

North America (US and Canada)

Latin America (Mexico, Brazil, and Rest of Latin America)

Asia Pacific (South Korea, South East Asia, China, India, Japan, and Rest of Asia Pacific)

Middle East and Africa (GCC Countries, South Africa, and Rest of Middle East and Africa)

High Altitude Platforms Market Key Companies TCOM LP, Lockheed Martin Corporation, Raytheon Company, Northrop Grumman Corporation, Lindstrand Technologies Ltd., Israel Aerospace Industries Ltd., ILC Dover L.P., Rafael Advanced Defense Systems Ltd., AeroVironment, Inc., and Aerostar International, Inc. (Raven Industries, Inc.)
High Altitude Platforms Market Competitive Landscape Market Share Analysis

Competitive Benchmarking

Key Players Market Positioning

Geographical Presence Analysis

Major Strategies Adopted

Segmentation of Global High Altitude Platforms Market-

Global High Altitude Platforms Market – By Type

  • Airships
  • Tethered Aerostat Systems

Global High Altitude Platforms Market – By Payload

  • Communication Systems
  • Surveillance Systems
  • Navigation Systems

Global High Altitude Platforms Market – By Application

  • Government & Defense
  • Commercial
  • Others

Global High Altitude Platforms  Market – By Region

  • North America
    • US
    • Canada
  • Europe
    • Germany
    • France
    • U.K.
    • Italy
    • Spain
    • Rest of Europe
  • Asia Pacific
    • China
    • Japan
    • India
    • South Korea
    • South-east Asia
    • Rest of Asia Pacific
  • Latin America
    • Brazil
    • Mexico
    • Rest of Latin America
  • Middle East & Africa
    • GCC Countries
    • South Africa
    • Rest of Middle East and Africa

1. Preface
1.1. Report Description
1.1.1. Purpose of the Report
1.1.2. Target Audience
1.1.3. USP and Key Offerings
1.2. Research Scope
1.3. Research Methodology
1.3.1. Phase I – Secondary Research
1.3.2. Phase II – Primary Research
1.3.3. Phase III – Expert Panel Review
1.3.4. Approach Adopted
1.3.4.1. Top-Down Approach
1.3.4.2. Bottom-Up Approach
1.3.5. Assumptions
1.4. Market Introduction
1.5. Market Research Scope

2. Executive Summary
2.1. Market Snapshot: High Altitude Platforms (HAPs) Market
2.2. High Altitude Platforms (HAPs) Market, By Type
2.3. High Altitude Platforms (HAPs) Market, By Payload
2.4. High Altitude Platforms (HAPs) Market, By Application
2.5. High Altitude Platforms (HAPs) Market, By Region

3. Market Dynamics & Factors Analysis
3.1. Introduction
3.1.1. High Altitude Platforms (HAPs) Market Value, 2017-2030, (US$ Bn)
3.1.2. Y-o-Y Growth Trend Analysis
3.2. Market Dynamics
3.2.1. Market Drivers
3.2.2. Market Restraints
3.2.3. Market Opportunities
3.2.4. Major Industry Challenges
3.3. Growth and Development Patterns
3.4. Investment Feasibility Analysis
3.5. Market Opportunity Analysis
3.5.1. Type
3.5.2. Payload
3.5.3. Application
3.5.4. Geography

4. Premium Insights
4.1. STAR (Situation, Task, Action, Results) Analysis
4.2. Porter’s Five Forces Analysis
4.2.1. Threat of New Entrants
4.2.2. Bargaining Power of Buyers/Consumers
4.2.3. Bargaining Power of Suppliers
4.2.4. Threat of Substitute Types
4.2.5. Intensity of Competitive Rivalry
4.3. Key Market Trends
4.3.1. Demand Side Trends
4.3.2. Supply Side Trends
4.4. Value Chain Analysis
4.5. Technology Analysis
4.6. Analysis and Recommendations
4.7. Marketing Strategy Analysis
4.7.1. Direct Marketing
4.7.2. Indirect Marketing
4.7.3. Marketing Channel Development Trend

5. Market Positioning of Key Players, 2022
5.1. Company market share of key players, 2022
5.2. Competitive Benchmarking
5.3. Market Positioning of Key Vendors
5.4. Geographical Presence Analysis
5.5. Major Strategies Adopted by Key Players
5.5.1. Key Strategies Analysis
5.5.2. Mergers and Acquisitions
5.5.3. Partnerships
5.5.4. Product Launch
5.5.5. Geographical Expansion
5.5.6. Others

6. Economic Impact Analysis
6.1. Recession Impact
6.1.1. North America
6.1.2. Europe
6.1.3. Asia Pacific
6.1.4. Latin America
6.1.5. Middle East and Africa
6.2. Ukraine-Russia War Impact
6.2.1. North America
6.2.2. Europe
6.2.3. Asia Pacific
6.2.4. Latin America
6.2.5. Middle East and Africa
6.3. COVID-19 Impact Analysis
6.3.1. North America
6.3.2. Europe
6.3.3. Asia Pacific
6.3.4. Latin America
6.3.5. Middle East and Africa

7. High Altitude Platforms (HAPs) Market
7.1. High Altitude Platforms (HAPs) Market, By Type, 2017-2030(US$ Bn)
7.1.1. Overview
7.1.2. High Altitude Platforms (HAPs) Market, By Type, 2022 vs 2030 (in%)
7.1.3. High Altitude Platforms (HAPs) Market, By Airships, 2017-2030 (US$ Bn)
7.1.4. High Altitude Platforms (HAPs) Market, By Tethered Aerostat Systems, 2017-2030 (US$ Bn)
7.2. High Altitude Platforms (HAPs) Market, by Payload, 2017-2030(US$ Bn)
7.2.1. Overview
7.2.2. High Altitude Platforms (HAPs) Market, By Payload, 2022 vs 2030 (in%)
7.2.3. High Altitude Platforms (HAPs) Market, By Communication Systems, 2017-2030 (US$ Bn)
7.2.4. High Altitude Platforms (HAPs) Market, By Surveillance Systems, 2017-2030 (US$ Bn)
7.2.5. High Altitude Platforms (HAPs) Market, By Navigation Systems, 2017-2030 (US$ Bn)
7.3. High Altitude Platforms (HAPs) Market, By Application, 2017-2030(US$ Bn)
7.3.1. Overview
7.3.2. High Altitude Platforms (HAPs) Market, By Application, 2022 vs 2030 (in%)
7.3.3. High Altitude Platforms (HAPs) Market, By Government & Defense, 2017-2030 (US$ Bn)
7.3.4. High Altitude Platforms (HAPs) Market, By Commercial, 2017-2030 (US$ Bn)
7.3.5. High Altitude Platforms (HAPs) Market, By Others, 2017-2030 (US$ Bn)

8. North America High Altitude Platforms (HAPs) Market Analysis
8.1. North America High Altitude Platforms (HAPs) Market, By Type, 2017-2030(US$ Bn)
8.1.1. Overview
8.1.2. SRC Analysis
8.2. North America High Altitude Platforms (HAPs) Market, by Payload, 2017-2030(US$ Bn)
8.2.1. Overview
8.2.2. SRC Analysis
8.3. North America High Altitude Platforms (HAPs) Market, By Application, 2017-2030(US$ Bn)
8.3.1. Overview
8.3.2. SRC Analysis
8.4. North America High Altitude Platforms (HAPs) Market, by Country, 2017-2030 (US$ Bn)
8.4.1. U.S.
8.4.1.1. U.S. High Altitude Platforms (HAPs) Market Estimates and Forecast, 2017-2030 (US$ Bn)
8.4.1.2. U.S. High Altitude Platforms (HAPs), By Type, 2017-2030 (US$ Bn)
8.4.1.3. U.S. High Altitude Platforms (HAPs), By Payload, 2017-2030 (US$ Bn)
8.4.1.4. U.S. High Altitude Platforms (HAPs), By Application, 2017-2030 (US$ Bn)
8.4.2. Canada
8.4.2.1. Canada High Altitude Platforms (HAPs) Market Estimates and Forecast, 2017-2030 (US$ Bn)
8.4.2.2. Canada High Altitude Platforms (HAPs), By Type, 2017-2030 (US$ Bn)
8.4.2.3. Canada High Altitude Platforms (HAPs), By Payload, 2017-2030 (US$ Bn)
8.4.2.4. Canada High Altitude Platforms (HAPs), By Application, 2017-2030 (US$ Bn)

9. Europe High Altitude Platforms (HAPs) Market Analysis
9.1. Europe High Altitude Platforms (HAPs) Market, By Type, 2017-2030(US$ Bn)
9.1.1. Overview
9.1.2. SRC Analysis
9.2. Europe High Altitude Platforms (HAPs) Market, by Payload, 2017-2030(US$ Bn)
9.2.1. Overview
9.2.2. SRC Analysis
9.3. Europe High Altitude Platforms (HAPs) Market, By Application, 2017-2030(US$ Bn)
9.3.1. Overview
9.3.2. SRC Analysis
9.4. Europe High Altitude Platforms (HAPs) Market, by Country, 2017-2030 (US$ Bn)
9.4.1. Germany
9.4.1.1. Germany High Altitude Platforms (HAPs) Market Estimates and Forecast, 2017-2030 (US$ Bn)
9.4.1.2. Germany High Altitude Platforms (HAPs), By Type, 2017-2030 (US$ Bn)
9.4.1.3. Germany High Altitude Platforms (HAPs), By Payload, 2017-2030 (US$ Bn)
9.4.1.4. Germany High Altitude Platforms (HAPs), By Application, 2017-2030 (US$ Bn)
9.4.2. France
9.4.2.1. France High Altitude Platforms (HAPs) Market Estimates and Forecast, 2017-2030 (US$ Bn)
9.4.2.2. France High Altitude Platforms (HAPs), By Type, 2017-2030 (US$ Bn)
9.4.2.3. France High Altitude Platforms (HAPs), By Payload, 2017-2030 (US$ Bn)
9.4.2.4. France High Altitude Platforms (HAPs), By Application, 2017-2030 (US$ Bn)
9.4.3. UK
9.4.3.1. UK High Altitude Platforms (HAPs) Market Estimates and Forecast, 2017-2030 (US$ Bn)
9.4.3.2. UK High Altitude Platforms (HAPs), By Type, 2017-2030 (US$ Bn)
9.4.3.3. UK High Altitude Platforms (HAPs), By Payload, 2017-2030 (US$ Bn)
9.4.3.4. UK High Altitude Platforms (HAPs), By Application, 2017-2030 (US$ Bn)
9.4.4. Italy
9.4.4.1. Italy High Altitude Platforms (HAPs) Market Estimates and Forecast, 2017-2030 (US$ Bn)
9.4.4.2. Italy High Altitude Platforms (HAPs), By Type, 2017-2030 (US$ Bn)
9.4.4.3. Italy High Altitude Platforms (HAPs), By Payload, 2017-2030 (US$ Bn)
9.4.4.4. Italy High Altitude Platforms (HAPs), By Application, 2017-2030 (US$ Bn)
9.4.5. Spain
9.4.5.1. Spain High Altitude Platforms (HAPs) Market Estimates and Forecast, 2017-2030 (US$ Bn)
9.4.5.2. Spain High Altitude Platforms (HAPs), By Type, 2017-2030 (US$ Bn)
9.4.5.3. Spain High Altitude Platforms (HAPs), By Payload, 2017-2030 (US$ Bn)
9.4.5.4. Spain High Altitude Platforms (HAPs), By Application, 2017-2030 (US$ Bn)
9.4.6. Rest of Europe
9.4.6.1. Rest of Europe High Altitude Platforms (HAPs) Market Estimates and Forecast, 2017-2030 (US$ Bn)
9.4.6.2. Rest of Europe High Altitude Platforms (HAPs), By Type, 2017-2030 (US$ Bn)
9.4.6.3. Rest of Europe High Altitude Platforms (HAPs), By Payload, 2017-2030 (US$ Bn)
9.4.6.4. Rest of Europe High Altitude Platforms (HAPs), By Application, 2017-2030 (US$ Bn)

10. Asia Pacific High Altitude Platforms (HAPs) Market Analysis
10.1. Asia Pacific High Altitude Platforms (HAPs) Market, By Type, 2017-2030(US$ Bn)
10.1.1. Overview
10.1.2. SRC Analysis
10.2. Asia Pacific High Altitude Platforms (HAPs) Market, by Payload, 2017-2030(US$ Bn)
10.2.1. Overview
10.2.2. SRC Analysis
10.3. Asia Pacific High Altitude Platforms (HAPs) Market, By Application, 2017-2030(US$ Bn)
10.3.1. Overview
10.3.2. SRC Analysis
10.4. Asia Pacific High Altitude Platforms (HAPs) Market, by Country, 2017-2030 (US$ Bn)
10.4.1. China
10.4.1.1. China High Altitude Platforms (HAPs) Market Estimates and Forecast, 2017-2030 (US$ Bn)
10.4.1.2. China High Altitude Platforms (HAPs), By Type, 2017-2030 (US$ Bn)
10.4.1.3. China High Altitude Platforms (HAPs), By Payload, 2017-2030 (US$ Bn)
10.4.1.4. China High Altitude Platforms (HAPs), By Application, 2017-2030 (US$ Bn)
10.4.2. Japan
10.4.2.1. Japan High Altitude Platforms (HAPs) Market Estimates and Forecast, 2017-2030 (US$ Bn)
10.4.2.2. Japan High Altitude Platforms (HAPs), By Type, 2017-2030 (US$ Bn)
10.4.2.3. Japan High Altitude Platforms (HAPs), By Payload, 2017-2030 (US$ Bn)
10.4.2.4. Japan High Altitude Platforms (HAPs), By Application, 2017-2030 (US$ Bn)
10.4.3. India
10.4.3.1. India High Altitude Platforms (HAPs) Market Estimates and Forecast, 2017-2030 (US$ Bn)
10.4.3.2. India High Altitude Platforms (HAPs), By Type, 2017-2030 (US$ Bn)
10.4.3.3. India High Altitude Platforms (HAPs), By Payload, 2017-2030 (US$ Bn)
10.4.3.4. India High Altitude Platforms (HAPs), By Application, 2017-2030 (US$ Bn)
10.4.4. South Korea
10.4.4.1. South Korea High Altitude Platforms (HAPs) Market Estimates and Forecast, 2017-2030 (US$ Bn)
10.4.4.2. South Korea High Altitude Platforms (HAPs), By Type, 2017-2030 (US$ Bn)
10.4.4.3. South Korea High Altitude Platforms (HAPs), By Payload, 2017-2030 (US$ Bn)
10.4.4.4. South Korea High Altitude Platforms (HAPs), By Application, 2017-2030 (US$ Bn)
10.4.5. South-East Asia
10.4.5.1. South-East Asia High Altitude Platforms (HAPs) Market Estimates and Forecast, 2017-2030 (US$ Bn)
10.4.5.2. South-East Asia High Altitude Platforms (HAPs), By Type, 2017-2030 (US$ Bn)
10.4.5.3. South-East Asia High Altitude Platforms (HAPs), By Payload, 2017-2030 (US$ Bn)
10.4.5.4. South-East Asia High Altitude Platforms (HAPs), By Application, 2017-2030 (US$ Bn)
10.4.6. Rest of Asia Pacific
10.4.6.1. Rest of Asia Pacific High Altitude Platforms (HAPs) Market Estimates and Forecast, 2017-2030 (US$ Bn)
10.4.6.2. Rest of Asia Pacific High Altitude Platforms (HAPs), By Type, 2017-2030 (US$ Bn)
10.4.6.3. Rest of Asia Pacific High Altitude Platforms (HAPs), By Payload, 2017-2030 (US$ Bn)
10.4.6.4. Rest of Asia Pacific High Altitude Platforms (HAPs), By Application, 2017-2030 (US$ Bn)


11. Latin America High Altitude Platforms (HAPs) Market Analysis
11.1. Latin America High Altitude Platforms (HAPs) Market, By Type, 2017-2030(US$ Bn)
11.1.1. Overview
11.1.2. SRC Analysis
11.2. Latin America High Altitude Platforms (HAPs) Market, by Payload, 2017-2030(US$ Bn)
11.2.1. Overview
11.2.2. SRC Analysis
11.3. Latin America High Altitude Platforms (HAPs) Market, By Application, 2017-2030(US$ Bn)
11.3.1. Overview
11.3.2. SRC Analysis
11.4. Latin America High Altitude Platforms (HAPs) Market, by Country, 2017-2030 (US$ Bn)
11.4.1. Brazil
11.4.1.1. Brazil High Altitude Platforms (HAPs) Market Estimates and Forecast, 2017-2030 (US$ Bn)
11.4.1.2. Brazil High Altitude Platforms (HAPs), By Type, 2017-2030 (US$ Bn)
11.4.1.3. Brazil High Altitude Platforms (HAPs), By Payload, 2017-2030 (US$ Bn)
11.4.1.4. Brazil High Altitude Platforms (HAPs), By Application, 2017-2030 (US$ Bn)
11.4.2. Mexico
11.4.2.1. Mexico High Altitude Platforms (HAPs) Market Estimates and Forecast, 2017-2030 (US$ Bn)
11.4.2.2. Mexico High Altitude Platforms (HAPs), By Type, 2017-2030 (US$ Bn)
11.4.2.3. Mexico High Altitude Platforms (HAPs), By Payload, 2017-2030 (US$ Bn)
11.4.2.4. Mexico High Altitude Platforms (HAPs), By Application, 2017-2030 (US$ Bn)
11.4.3. Rest of Latin America
11.4.3.1. Rest of Latin America High Altitude Platforms (HAPs) Market Estimates and Forecast, 2017-2030 (US$ Bn)
11.4.3.2. Rest of Latin America High Altitude Platforms (HAPs), By Type, 2017-2030 (US$ Bn)
11.4.3.3. Rest of Latin America High Altitude Platforms (HAPs), By Payload, 2017-2030 (US$ Bn)
11.4.3.4. Rest of Latin America High Altitude Platforms (HAPs), By Application, 2017-2030 (US$ Bn)

12. Middle East and Africa High Altitude Platforms (HAPs) Market Analysis
12.1. Middle East and Africa High Altitude Platforms (HAPs) Market, By Type, 2017-2030(US$ Bn)
12.1.1. Overview
12.1.2. SRC Analysis
12.2. Middle East and Africa High Altitude Platforms (HAPs) Market, by Payload, 2017-2030(US$ Bn)
12.2.1. Overview
12.2.2. SRC Analysis
12.3. Middle East and Africa High Altitude Platforms (HAPs) Market, By Application, 2017-2030(US$ Bn)
12.3.1. Overview
12.3.2. SRC Analysis
12.4. Middle East and Africa High Altitude Platforms (HAPs) Market, by Country, 2017-2030 (US$ Bn)
12.4.1. GCC Countries
12.4.1.1. GCC Countries High Altitude Platforms (HAPs) Market Estimates and Forecast, 2017-2030 (US$ Bn)
12.4.1.2. GCC Countries High Altitude Platforms (HAPs), By Type, 2017-2030 (US$ Bn)
12.4.1.3. GCC Countries High Altitude Platforms (HAPs), By Payload, 2017-2030 (US$ Bn)
12.4.1.4. GCC Countries High Altitude Platforms (HAPs), By Application, 2017-2030 (US$ Bn)
12.4.2. South Africa
12.4.2.1. South Africa High Altitude Platforms (HAPs) Market Estimates and Forecast, 2017-2030 (US$ Bn)
12.4.2.2. South Africa High Altitude Platforms (HAPs), By Type, 2017-2030 (US$ Bn)
12.4.2.3. South Africa High Altitude Platforms (HAPs), By Payload, 2017-2030 (US$ Bn)
12.4.2.4. South Africa High Altitude Platforms (HAPs), By Application, 2017-2030 (US$ Bn)
12.4.3. Rest of Middle East and Africa
12.4.3.1. Rest of Middle East and Africa High Altitude Platforms (HAPs) Market Estimates and Forecast, 2017-2030 (US$ Bn)
12.4.3.2. Rest of Middle East and Africa High Altitude Platforms (HAPs), By Type, 2017-2030 (US$ Bn)
12.4.3.3. Rest of Middle East and Africa High Altitude Platforms (HAPs), By Payload, 2017-2030 (US$ Bn)
12.4.3.4. Rest of Middle East and Africa High Altitude Platforms (HAPs), By Application, 2017-2030 (US$ Bn)

13. Company Profiles
13.1. TCOM L.P.
13.1.1. Company Overview
13.1.2. Products/Services Portfolio
13.1.3. Geographical Presence
13.1.4. Financial Summary
13.1.4.1. Market Revenue and Net Profit (2019-2022)
13.1.4.2. Business Segment Revenue Analysis
13.1.4.3. Geographical Revenue Analysis
13.2. Lockheed Martin Corporation
13.3. Raytheon Company
13.4. Northrop Grumman Corporation
13.5. Lindstrand Technologies Ltd.
13.6. Israel Aerospace Industries Ltd.
13.7. ILC Dover L.P.
13.8. Rafael Advanced Defense Systems Ltd.
13.9. AeroVironment, Inc.
13.10. Aerostar International, Inc. (Raven Industries, Inc.)

List of Figures

FIG. 1 High Altitude Platforms (HAPs) Market: Research Methodology
FIG. 2 Market Size Estimation – Top Down & Bottom up Approach
FIG. 3 High Altitude Platforms (HAPs) Market Segmentation
FIG. 4 High Altitude Platforms (HAPs) Market, By Type, 2022 (US$ Bn)
FIG. 5 High Altitude Platforms (HAPs) Market, by Payload, 2022 (US$ Bn)
FIG. 6 High Altitude Platforms (HAPs) Market, By Application, 2022 (US$ Bn)
FIG. 7 High Altitude Platforms (HAPs) Market, by Geography, 2022 (US$ Bn)
FIG. 8 Attractive Investment Proposition, By Type, 2022
FIG. 9 Attractive Investment Proposition, by Payload, 2022
FIG. 10 Attractive Investment Proposition, By Application, 2022
FIG. 11 Attractive Investment Proposition, by Geography, 2022
FIG. 12 Global Market Share Analysis of Key High Altitude Platforms (HAPs) Market Manufacturers, 2022
FIG. 13 Global Market Positioning of Key High Altitude Platforms (HAPs) Market Manufacturers, 2022
FIG. 14 High Altitude Platforms (HAPs) Market Value Contribution, By Type, 2022 & 2030 (Value %)
FIG. 15 High Altitude Platforms (HAPs) Market, by Airships, Value, 2017-2030 (US$ Bn)
FIG. 16 High Altitude Platforms (HAPs) Market, by Tethered Aerostat Systems, Value, 2017-2030 (US$ Bn)
FIG. 17 High Altitude Platforms (HAPs) Market Value Contribution, By Payload, 2022 & 2030 (Value %)
FIG. 18 High Altitude Platforms (HAPs) Market, by Communication Systems, Value, 2017-2030 (US$ Bn)
FIG. 19 High Altitude Platforms (HAPs) Market, by Surveillance Systems, Value, 2017-2030 (US$ Bn)
FIG. 20 High Altitude Platforms (HAPs) Market, by Navigation Systems, Value, 2017-2030 (US$ Bn)
FIG. 21 High Altitude Platforms (HAPs) Market Value Contribution, By Application, 2022 & 2030 (Value %)
FIG. 22 High Altitude Platforms (HAPs) Market, by Government & Defense, Value, 2017-2030 (US$ Bn)
FIG. 23 High Altitude Platforms (HAPs) Market, by Commercial, Value, 2017-2030 (US$ Bn)
FIG. 24 High Altitude Platforms (HAPs) Market, By Others, 2017-2030 (US$ Bn)
FIG. 25 U.S. High Altitude Platforms (HAPs) Market, 2017-2030 (US$ Bn)
FIG. 26 Canada High Altitude Platforms (HAPs) Market, 2017-2030 (US$ Bn)
FIG. 27 Germany High Altitude Platforms (HAPs) Market, 2017-2030 (US$ Bn)
FIG. 28 France High Altitude Platforms (HAPs) Market, 2017-2030 (US$ Bn)
FIG. 29 U.K. High Altitude Platforms (HAPs) Market, 2017-2030 (US$ Bn)
FIG. 30 Italy High Altitude Platforms (HAPs) Market, 2017-2030 (US$ Bn)
FIG. 31 Spain High Altitude Platforms (HAPs) Market, 2017-2030 (US$ Bn)
FIG. 32 Rest of Europe High Altitude Platforms (HAPs) Market, 2017-2030 (US$ Bn)
FIG. 33 China High Altitude Platforms (HAPs) Market, 2017-2030 (US$ Bn)
FIG. 34 Japan High Altitude Platforms (HAPs) Market, 2017-2030 (US$ Bn)
FIG. 35 India High Altitude Platforms (HAPs) Market, 2017-2030 (US$ Bn)
FIG. 36 South Korea High Altitude Platforms (HAPs) Market, 2017-2030 (US$ Bn)
FIG. 37 Southeast Asia High Altitude Platforms (HAPs) Market, 2017-2030 (US$ Bn)
FIG. 38 Rest of Asia Pacific High Altitude Platforms (HAPs) Market, 2017-2030 (US$ Bn)
FIG. 39 Latin America High Altitude Platforms (HAPs) Market, 2017-2030 (US$ Bn)
FIG. 40 Brazil High Altitude Platforms (HAPs) Market, 2017-2030 (US$ Bn)
FIG. 41 Mexico High Altitude Platforms (HAPs) Market, 2017-2030 (US$ Bn)
FIG. 42 Rest of Latin America High Altitude Platforms (HAPs) Market, 2017-2030 (US$ Bn)
FIG. 43 Middle East & Africa High Altitude Platforms (HAPs) Market, 2017-2030 (US$ Bn)
FIG. 44 GCC Countries High Altitude Platforms (HAPs) Market, 2017-2030 (US$ Bn)
FIG. 45 South Africa High Altitude Platforms (HAPs) Market, 2017-2030 (US$ Bn)
FIG. 46 Rest of Middle East and Africa High Altitude Platforms (HAPs) Market, 2017-2030 (US$ Bn)


List of Tables

TABLE 1 Market Snapshot: High Altitude Platforms (HAPs) Market
TABLE 2 High Altitude Platforms (HAPs) Market, by Competitive Benchmarking, 2022
TABLE 3 High Altitude Platforms (HAPs) Market, by Geographical Presence Analysis, 2022
TABLE 4 High Altitude Platforms (HAPs) Market, by Key Strategies Analysis, 2022
TABLE 5 High Altitude Platforms (HAPs) Market, By Type, 2017-2030 (US$ Bn)
TABLE 6 High Altitude Platforms (HAPs) Market, by Payload, 2017-2030 (US$ Bn)
TABLE 7 High Altitude Platforms (HAPs) Market, By Application, 2017-2030 (US$ Bn)
TABLE 8 High Altitude Platforms (HAPs) Market, by Geography, 2017-2030 (US$ Bn)
TABLE 9 North America High Altitude Platforms (HAPs) Market, By Type, 2017-2030 (US$ Bn)
TABLE 10 North America High Altitude Platforms (HAPs) Market, by Payload, 2017-2030 (US$ Bn)
TABLE 11 North America High Altitude Platforms (HAPs) Market, By Application, 2017-2030 (US$ Bn)
TABLE 12 North America High Altitude Platforms (HAPs) Market, by Country, 2017-2030 (US$ Bn)
TABLE 13 US High Altitude Platforms (HAPs) Market, By Type, 2017-2030 (US$ Bn)
TABLE 14 US High Altitude Platforms (HAPs) Market, by Payload, 2017-2030 (US$ Bn)
TABLE 15 US High Altitude Platforms (HAPs) Market, By Application, 2017-2030 (US$ Bn)
TABLE 16 Canada High Altitude Platforms (HAPs) Market, By Type, 2017-2030 (US$ Bn)
TABLE 17 Canada High Altitude Platforms (HAPs) Market, by Payload, 2017-2030 (US$ Bn)
TABLE 18 Canada High Altitude Platforms (HAPs) Market, By Application, 2017-2030 (US$ Bn)
TABLE 19 Europe High Altitude Platforms (HAPs) Market, By Type, 2017-2030 (US$ Bn)
TABLE 20 Europe High Altitude Platforms (HAPs) Market, by Payload, 2017-2030 (US$ Bn)
TABLE 21 Europe High Altitude Platforms (HAPs) Market, By Application, 2017-2030 (US$ Bn)
TABLE 22 Europe High Altitude Platforms (HAPs) Market, by Country, 2017-2030 (US$ Bn)
TABLE 23 Germany High Altitude Platforms (HAPs) Market, By Type, 2017-2030 (US$ Bn)
TABLE 24 Germany High Altitude Platforms (HAPs) Market, by Payload, 2017-2030 (US$ Bn)
TABLE 25 Germany High Altitude Platforms (HAPs) Market, By Application, 2017-2030 (US$ Bn)
TABLE 26 France High Altitude Platforms (HAPs) Market, By Type, 2017-2030 (US$ Bn)
TABLE 27 France High Altitude Platforms (HAPs) Market, by Payload, 2017-2030 (US$ Bn)
TABLE 28 France High Altitude Platforms (HAPs) Market, By Application, 2017-2030 (US$ Bn)
TABLE 29 UK High Altitude Platforms (HAPs) Market, By Type, 2017-2030 (US$ Bn)
TABLE 30 UK High Altitude Platforms (HAPs) Market, by Payload, 2017-2030 (US$ Bn)
TABLE 31 UK High Altitude Platforms (HAPs) Market, By Application, 2017-2030 (US$ Bn)
TABLE 32 Italy High Altitude Platforms (HAPs) Market, By Type, 2017-2030 (US$ Bn)
TABLE 33 Italy High Altitude Platforms (HAPs) Market, by Payload, 2017-2030 (US$ Bn)
TABLE 34 Italy High Altitude Platforms (HAPs) Market, By Application, 2017-2030 (US$ Bn)
TABLE 35 Spain High Altitude Platforms (HAPs) Market, By Type, 2017-2030 (US$ Bn)
TABLE 36 Spain High Altitude Platforms (HAPs) Market, by Payload, 2017-2030 (US$ Bn)
TABLE 37 Spain High Altitude Platforms (HAPs) Market, By Application, 2017-2030 (US$ Bn)
TABLE 38 Rest of Europe High Altitude Platforms (HAPs) Market, By Type, 2017-2030 (US$ Bn)
TABLE 39 Rest of Europe High Altitude Platforms (HAPs) Market, by Payload, 2017-2030 (US$ Bn)
TABLE 40 Rest of Europe High Altitude Platforms (HAPs) Market, By Application, 2017-2030 (US$ Bn)
TABLE 41 Asia Pacific High Altitude Platforms (HAPs) Market, By Type, 2017-2030 (US$ Bn)
TABLE 42 Asia Pacific High Altitude Platforms (HAPs) Market, by Payload, 2017-2030 (US$ Bn)
TABLE 43 Asia Pacific High Altitude Platforms (HAPs) Market, By Application, 2017-2030 (US$ Bn)
TABLE 44 Asia Pacific High Altitude Platforms (HAPs) Market, by Country, 2017-2030 (US$ Bn)
TABLE 45 China High Altitude Platforms (HAPs) Market, By Type, 2017-2030 (US$ Bn)
TABLE 46 China High Altitude Platforms (HAPs) Market, by Payload, 2017-2030 (US$ Bn)
TABLE 47 China High Altitude Platforms (HAPs) Market, By Application, 2017-2030 (US$ Bn)
TABLE 48 Japan High Altitude Platforms (HAPs) Market, By Type, 2017-2030 (US$ Bn)
TABLE 49 Japan High Altitude Platforms (HAPs) Market, by Payload, 2017-2030 (US$ Bn)
TABLE 50 Japan High Altitude Platforms (HAPs) Market, By Application, 2017-2030 (US$ Bn)
TABLE 51 India High Altitude Platforms (HAPs) Market, By Type, 2017-2030 (US$ Bn)
TABLE 52 India High Altitude Platforms (HAPs) Market, by Payload, 2017-2030 (US$ Bn)
TABLE 53 India High Altitude Platforms (HAPs) Market, By Application, 2017-2030 (US$ Bn)
TABLE 54 South Korea High Altitude Platforms (HAPs) Market, By Type, 2017-2030 (US$ Bn)
TABLE 55 South Korea High Altitude Platforms (HAPs) Market, by Payload, 2017-2030 (US$ Bn)
TABLE 56 South Korea High Altitude Platforms (HAPs) Market, By Application, 2017-2030 (US$ Bn)
TABLE 57 South East Asia High Altitude Platforms (HAPs) Market, By Type, 2017-2030 (US$ Bn)
TABLE 58 South East Asia High Altitude Platforms (HAPs) Market, by Payload, 2017-2030 (US$ Bn)
TABLE 59 South East Asia High Altitude Platforms (HAPs) Market, By Application, 2017-2030 (US$ Bn)
TABLE 60 Rest of Asia Pacific High Altitude Platforms (HAPs) Market, By Type, 2017-2030 (US$ Bn)
TABLE 61 Rest of Asia Pacific High Altitude Platforms (HAPs) Market, by Payload, 2017-2030 (US$ Bn)
TABLE 62 Rest of Asia Pacific High Altitude Platforms (HAPs) Market, By Application, 2017-2030 (US$ Bn)
TABLE 63 Latin America High Altitude Platforms (HAPs) Market, By Type, 2017-2030 (US$ Bn)
TABLE 64 Latin America High Altitude Platforms (HAPs) Market, by Payload, 2017-2030 (US$ Bn)
TABLE 65 Latin America High Altitude Platforms (HAPs) Market, By Application, 2017-2030 (US$ Bn)
TABLE 66 Latin America High Altitude Platforms (HAPs) Market, by Country, 2017-2030 (US$ Bn)
TABLE 67 Brazil High Altitude Platforms (HAPs) Market, By Type, 2017-2030 (US$ Bn)
TABLE 68 Brazil High Altitude Platforms (HAPs) Market, by Payload, 2017-2030 (US$ Bn)
TABLE 69 Brazil High Altitude Platforms (HAPs) Market, By Application, 2017-2030 (US$ Bn)
TABLE 70 Mexico High Altitude Platforms (HAPs) Market, By Type, 2017-2030 (US$ Bn)
TABLE 71 Mexico High Altitude Platforms (HAPs) Market, by Payload, 2017-2030 (US$ Bn)
TABLE 72 Mexico High Altitude Platforms (HAPs) Market, By Application, 2017-2030 (US$ Bn)
TABLE 73 Rest of Latin America High Altitude Platforms (HAPs) Market, By Type, 2017-2030 (US$ Bn)
TABLE 74 Rest of Latin America High Altitude Platforms (HAPs) Market, by Payload, 2017-2030 (US$ Bn)
TABLE 75 Rest of Latin America High Altitude Platforms (HAPs) Market, By Application, 2017-2030 (US$ Bn)
TABLE 76 Middle East and Africa High Altitude Platforms (HAPs) Market, By Type, 2017-2030 (US$ Bn)
TABLE 77 Middle East and Africa High Altitude Platforms (HAPs) Market, by Payload, 2017-2030 (US$ Bn)
TABLE 78 Middle East and Africa High Altitude Platforms (HAPs) Market, By Application, 2017-2030 (US$ Bn)
TABLE 79 Middle East and Africa High Altitude Platforms (HAPs) Market, by Country, 2017-2030 (US$ Bn)
TABLE 80 GCC Countries High Altitude Platforms (HAPs) Market, By Type, 2017-2030 (US$ Bn)
TABLE 81 GCC Countries High Altitude Platforms (HAPs) Market, by Payload, 2017-2030 (US$ Bn)
TABLE 82 GCC Countries High Altitude Platforms (HAPs) Market, By Application, 2017-2030 (US$ Bn)
TABLE 83 South Africa High Altitude Platforms (HAPs) Market, By Type, 2017-2030 (US$ Bn)
TABLE 84 South Africa High Altitude Platforms (HAPs) Market, by Payload, 2017-2030 (US$ Bn)
TABLE 85 South Africa High Altitude Platforms (HAPs) Market, By Application, 2017-2030 (US$ Bn)
TABLE 86 Rest of Middle East and Africa High Altitude Platforms (HAPs) Market, By Type, 2017-2030 (US$ Bn)
TABLE 87 Rest of Middle East and Africa High Altitude Platforms (HAPs) Market, by Payload, 2017-2030 (US$ Bn)
TABLE 88 Rest of Middle East and Africa High Altitude Platforms (HAPs) Market, By Application, 2017-2030 (US$ Bn)

Frequently Asked Questions

How does COVID-19 Impact the global high altitude platforms market?

COVID-19 has had a substantial impact on the market due to the outbreak of the COVID-19 pandemic, which impacted the demand for high altitude platforms.

Which is the leading region of the market for high altitude platforms?

North America accounted for the most heightened global high altitude platforms market share.

What are the key drivers for the growth of the high altitude platforms market?

Growing demand in developing economies to drive the high altitude platforms market.

Which is the major high altitude platforms market segment by type?

The airships segment had a major global market share in 2022.

Which is the major high altitude platforms market segment by application?

The government and defense segment had a major global market share in 2022.

Solar-Powered Drone Market

Published:
Report ID: 33586

Aerial Imaging Market

Published:
Report ID: 2597

Commercial Aircraft Passenger Service Unit (PSU) Market

Published:
Report ID: 32095

Aviation Fuel Market

Published:
Report ID: 23337

Defense Cyber Security Market

Published:
Report ID: 23353

Aerospace Valves Market

Published:
Report ID: 22847

Intelligent Marine Navigation Systems Market

Published:
Report ID: 6903

Flight Management Systems (FMS) Market

Published:
Report ID: 18832

Aerospace Antimicrobial Coating Market

Published:
Report ID: 18580

Ground and Cargo Handling Services Market

Published:
Report ID: 17986

Aerostat Systems Market

Published:
Report ID: 2682

Purchase Options

$2999
Delivery Format: Excel.
$4999
Designed for the individual purchaser.
$6999
Users located at a single corporate site or regional office.
$7999
Allowed for unlimited sharing globally within one company.
Smallform of Sample request

Have a question?

User Profile

Don’t settle for less – trust Mitul to help you find the best solution.

Report delivery within 24 to 48 hours

– Other Info –

What people say?-

User Review

I am very impressed with the information in this report. The author clearly did their research when they came up with this product and it has already given me a lot of ideas.

Jana Schmidt
CEDAR CX Technologies

– Connect with us –

Phone

+91 6232 49 3207


support

24/7 Research Support


sales@credenceresearch.com

– Research Methodology –

Going beyond the basics: advanced techniques in research methodology

– Trusted By –

Pepshi, LG, Nestle
Motorola, Honeywell, Johnson and johnson
LG Chem, SIEMENS, Pfizer
Unilever, Samsonite, QIAGEN