Market Overview
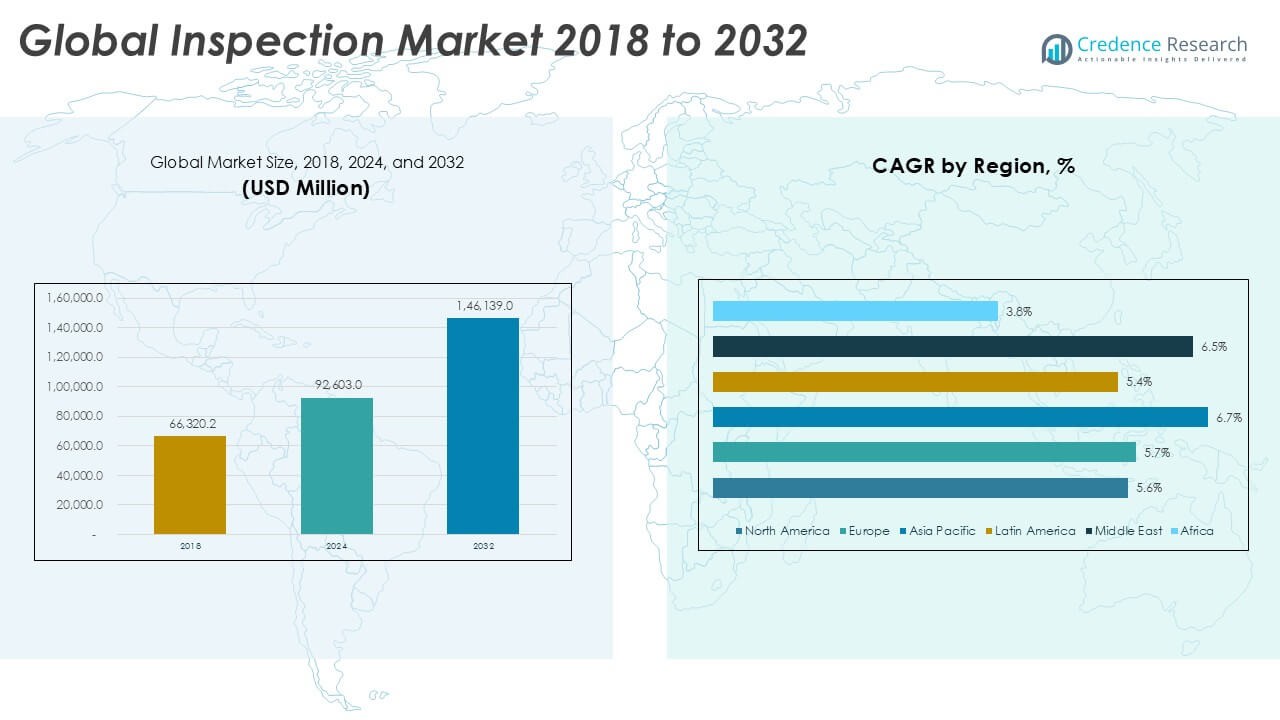
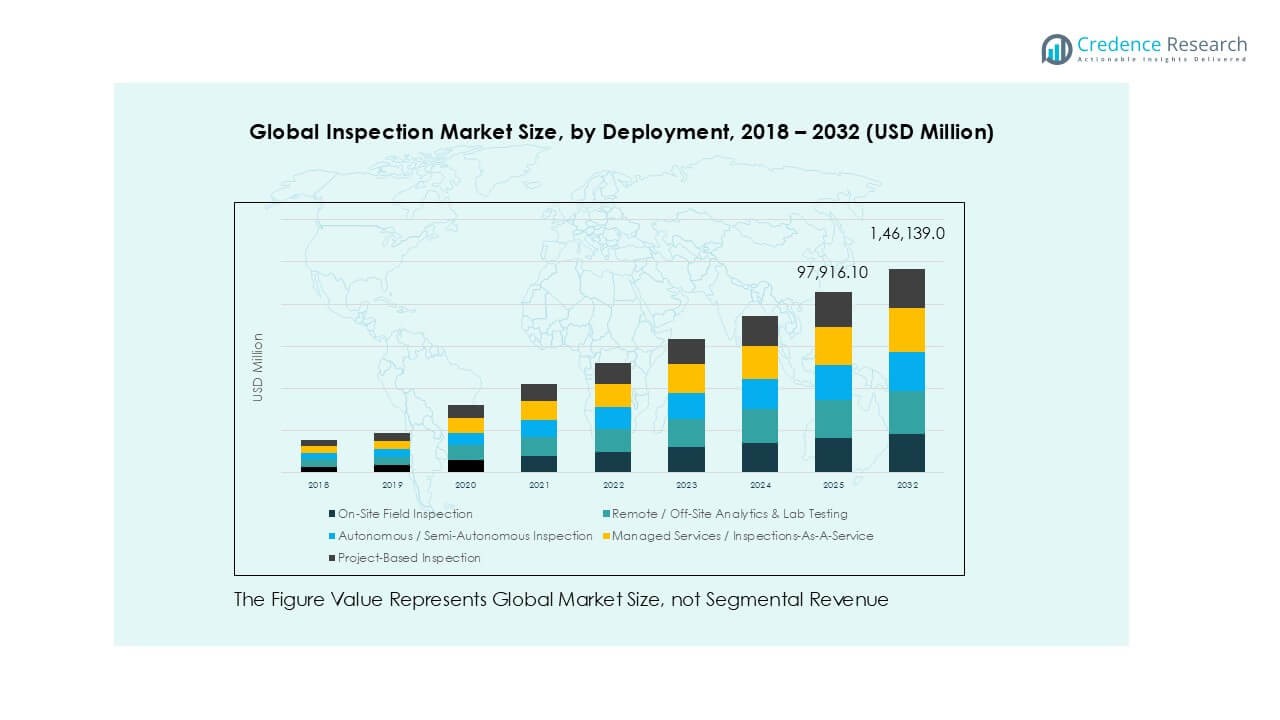
The Global Inspection market size was valued at USD 66,320.2 million in 2018, growing to USD 92,603.0 million in 2024, and is anticipated to reach USD 146,139.0 million by 2032, at a CAGR of 5.89% during the forecast period.
| REPORT ATTRIBUTE |
DETAILS |
| Historical Period |
2020-2023 |
| Base Year |
2024 |
| Forecast Period |
2025-2032 |
| Inspection Market Size 2024 |
USD 92,603.0 Million |
| Inspection Market, CAGR |
5.89% |
| Inspection Market Size 2032 |
USD 146,139.0 Million |
The global inspection market is led by prominent players including SGS SA, Bureau Veritas, TÜV SÜD, Intertek Group plc, and MISTRAS Group, supported by regional providers such as ALS Limited, Eurofins, and Oceaneering. These companies maintain strong competitive positions through diversified service portfolios, advanced non-destructive testing solutions, and investments in digital inspection technologies such as drones, robotics, and predictive analytics. In 2024, Europe emerged as the leading region with 33.8% market share, driven by stringent regulatory standards and broad industrial adoption. North America followed with 27.4%, supported by advanced infrastructure and strong demand in oil & gas and utilities. Asia Pacific accounted for 24.5%, showing the fastest growth momentum.
Access crucial information at unmatched prices!
Request your sample report today & start making informed decisions powered by Credence Research Inc.!
Download Sample
Market Insights
- The global inspection market was valued at USD 92,603.0 million in 2024 and is projected to reach USD 146,139.0 million by 2032, growing at a CAGR of 5.89% during the forecast period.
- Growing emphasis on safety regulations and compliance in oil & gas, power, and manufacturing industries is a key driver, pushing demand for non-destructive testing and advanced inspection services to ensure asset reliability and operational efficiency.
- Market trends highlight increasing adoption of drones, robotic crawlers, and predictive maintenance platforms, enabling cost-effective, safer, and more accurate inspections across hazardous and complex environments.
- Competition remains strong, with major players such as SGS SA, Bureau Veritas, TÜV SÜD, Intertek, and MISTRAS Group expanding through digital inspection technologies, while regional players strengthen presence in niche applications and local markets.
- Europe led the market with 33.8% share in 2024, followed by North America at 27.4% and Asia Pacific at 24.5%, with NDT dominating the services segment.
Market Segmentation Analysis:
By Services
The services segment in the global inspection market is diverse, covering traditional and advanced methods. Among them, non-destructive testing (NDT) held the dominant share of over 28% in 2024, driven by its ability to ensure asset integrity without causing damage. NDT is widely adopted in oil & gas, power, and manufacturing sectors for safety compliance and preventive maintenance. Increasing demand for advanced ultrasonic, radiographic, and magnetic particle testing strengthens its role. Rising focus on predictive maintenance and compliance with international safety standards continues to boost NDT adoption as the leading service category.
- For instance, Olympus Corporation introduced the OmniScan X3 phased array flaw detector, which supports up to 64 channels and enables detection of defects as small as 0.5 mm in critical pipeline weld inspections.
By Deployment
Deployment in the inspection market spans on-site, remote, and autonomous solutions. On-site field inspection accounted for the largest share, around 35% in 2024, due to its critical role in industries like oil & gas, utilities, and infrastructure. Field inspections remain essential for real-time asset evaluation and safety assurance, especially in hazardous environments. However, demand for remote analytics and autonomous systems is rising with digitalization, IoT, and AI integration. The ongoing push toward cost efficiency and reduced downtime further strengthens on-site inspections while creating opportunities for hybrid deployment models.
- For instance, Baker Hughes, through its Waygate Technologies business, provides Remote Visual Inspection (RVI) services for the power generation industry. In 2023, the company launched its Everest Ca-Zoom HD inspection camera, which offers 30x optical zoom and is primarily used for inspecting confined industrial spaces like pressure vessels and tanks.
By Customer
Customer segmentation highlights operators, EPC contractors, OEMs, third-party providers, and regulators. Operators and owners dominated the market with nearly 40% share in 2024, as they bear direct responsibility for asset reliability, safety, and compliance. Their focus on reducing operational risks and extending asset life drives high demand for inspection services. Regulatory compliance in oil & gas, power, and transportation further strengthens their dependence on frequent inspections. While third-party providers grow as outsourcing partners, operators remain the core customers, fueling investments in advanced inspection technologies and digital monitoring platforms.
Key Growth Drivers
Rising Industrial Safety and Regulatory Compliance
The demand for inspection services is strongly driven by stringent safety standards and regulations across industries. Oil & gas, power, utilities, and manufacturing sectors face strict oversight to ensure asset integrity and reduce risks of accidents. Governments and industry regulators enforce frequent inspections, requiring both traditional methods like visual inspection and advanced non-destructive testing (NDT). Increasing penalties for non-compliance further push operators and contractors to adopt professional inspection services. This trend supports market expansion by making inspections a recurring operational necessity rather than a one-time activity.
- For instance, TÜV SÜD is a certified and reputable inspection body that performs pressure vessel inspections according to the EU Pressure Equipment Directive (PED 2014/68/EU) and other international standards. In its 2023 annual report, TÜV SÜD reported over €2.4 billion in revenue from its Europe region, which includes a wide range of industrial services.
Technological Advancements and Digital Transformation
The adoption of IoT, AI, drones, robotics, and predictive analytics has transformed the inspection market. Remote monitoring, UAV-based inspection, and robotic crawlers reduce downtime and improve efficiency, especially in hard-to-reach or hazardous environments. Predictive maintenance powered by digital twins and advanced data analytics helps companies detect issues before failures occur. These advancements lower costs and improve safety outcomes, encouraging industries to integrate innovative inspection solutions. As industries modernize their infrastructure, the demand for digitalized inspection services continues to accelerate globally.
- For instance, Siemens Energy utilizes digital twin technology, as demonstrated by its partnership with AnyLogic to create a digital twin model (ATOM) for its global gas turbine fleet operations. This initiative, developed to address unforeseen in-service issues, supports predictive maintenance and improves fleet productivity and efficiency.
Growing Infrastructure Development and Asset Expansion
Rapid growth in infrastructure projects, energy installations, and industrial facilities worldwide is fueling inspection demand. Expansion in oil & gas pipelines, offshore wind farms, power plants, and transport infrastructure requires frequent structural assessment to ensure operational safety. Developing economies are investing heavily in utilities, smart grids, and manufacturing facilities, creating large-scale inspection opportunities. In mature markets, aging infrastructure further boosts inspection needs, as assets require constant monitoring for corrosion, fatigue, and mechanical integrity. This dual push of new asset creation and aging asset maintenance positions inspection as a critical growth sector.
Key Trends & Opportunities
Shift Toward Remote and Autonomous Inspection
A major trend is the increasing reliance on remote and autonomous inspection technologies. Drones, robotic crawlers, and AI-driven monitoring reduce human exposure to high-risk environments while improving accuracy. Remote analytics and off-site testing also support cost savings and efficiency in large-scale projects. Companies are investing in semi-autonomous and fully automated inspection solutions to minimize downtime and labor dependency. This shift presents opportunities for service providers to deliver advanced solutions aligned with Industry 4.0 and smart asset management practices.
- For instance, Flyability’s Elios 3 drone, along with other models, enables professionals to perform confined-space inspections, including tanks and pressure vessels, which helps reduce the need for human entry into hazardous zones.
Rise of Inspections-as-a-Service Models
The growing popularity of managed services and subscription-based inspection models presents significant market opportunities. Inspections-as-a-Service offers flexibility, lower upfront costs, and continuous monitoring for operators and contractors. Companies increasingly outsource inspection tasks to specialized third-party providers with advanced digital platforms and domain expertise. This trend supports scalability while addressing skill shortages in specialized inspection techniques. Service providers offering integrated platforms for predictive maintenance, compliance reporting, and remote monitoring are well-positioned to capture long-term contracts.
Key Challenges
High Cost of Advanced Inspection Technologies
Although digital and automated solutions provide long-term benefits, the high initial investment in advanced tools like UAVs, robotics, and AI-driven systems remains a barrier. Many operators in developing regions continue to rely on manual inspection methods due to budget constraints. The high cost of skilled personnel, training, and compliance certification further increases overall expenditure. This challenge can slow adoption of cutting-edge inspection solutions, particularly among small and medium operators.
Shortage of Skilled Workforce and Technical Expertise
The global inspection market faces a growing shortage of certified inspectors and technical experts skilled in advanced techniques. Non-destructive testing, robotics, and AI-powered analytics require specialized training, which is limited in many regions. Without qualified personnel, industries face delays in meeting inspection schedules and compliance requirements. This challenge is particularly severe in fast-growing markets where infrastructure is expanding quickly. Addressing the skills gap through training programs and industry partnerships will be essential for sustaining growth.
Regional Analysis
North America
North America accounted for 27.4% share in 2024, with the market valued at USD 25,386.45 million, up from USD 18,496.71 million in 2018. The region is projected to reach USD 39,136.03 million by 2032, growing at a CAGR of 5.6%. Growth is driven by strict safety regulations, advanced adoption of non-destructive testing, and digital inspection technologies in oil & gas, power, and infrastructure. Strong presence of leading service providers and investments in predictive maintenance further consolidate North America’s leadership in the inspection market.
Europe
Europe held the 33.8% market share in 2024, reaching USD 31,326.27 million, up from USD 22,688.15 million in 2018. The market is expected to achieve USD 48,693.52 million by 2032, expanding at a CAGR of 5.7%. Industrial compliance with EU regulations and the strong presence of power, utilities, and manufacturing sectors drive demand. Increasing adoption of drones, robotics, and predictive analytics in inspection supports market expansion. Europe remains a highly regulated and technology-driven region, reinforcing its position as a leading contributor to the global inspection market.
Asia Pacific
Asia Pacific captured a 24.5% share in 2024, valued at USD 22,739.33 million, rising from USD 15,552.09 million in 2018. The market is forecasted to reach USD 38,039.99 million by 2032 at the highest CAGR of 6.7%. Rapid industrialization, infrastructure growth, and expansion of oil & gas and power sectors fuel inspection demand. Countries like China, India, and Japan drive adoption of modern inspection tools, while aging infrastructure also increases service requirements. The region’s cost competitiveness and rising digitalization initiatives further support its strong growth trajectory.
Latin America
Latin America represented a 7.3% market share in 2024, with the market valued at USD 6,732.24 million, compared to USD 4,940.86 million in 2018. It is anticipated to reach USD 10,273.57 million by 2032, growing at a CAGR of 5.4%. Growth is supported by increasing investments in oil & gas, mining, and infrastructure projects. Regulatory improvements and expanding industrial bases in Brazil and Mexico drive inspection demand. However, adoption of advanced inspection technologies remains limited due to high costs, though outsourcing to third-party providers is steadily gaining momentum in the region.
Middle East
The Middle East contributed 4.8% market share in 2024, valued at USD 4,471.40 million, up from USD 3,097.15 million in 2018. The market is projected to reach USD 7,365.41 million by 2032 at a CAGR of 6.5%. Growth is fueled by expanding oil & gas infrastructure, petrochemical projects, and pipeline inspections. Adoption of predictive maintenance and non-destructive testing is rising, as governments enforce stricter safety regulations. Investments in smart city infrastructure and utilities also support market expansion, positioning the Middle East as a fast-growing regional hub for inspection services.
Africa
Africa accounted for a 2.2% share in 2024, reaching USD 1,947.31 million, compared to USD 1,545.26 million in 2018. The market is forecast to grow to USD 2,630.50 million by 2032, at a CAGR of 3.8%, the lowest among all regions. Growth is mainly driven by oil & gas projects, mining, and infrastructure development across South Africa and Nigeria. However, limited adoption of advanced inspection tools and a shortage of skilled workforce restrain faster expansion. Opportunities exist in outsourcing services and applying drone-based inspections to reduce operational costs and improve safety compliance.
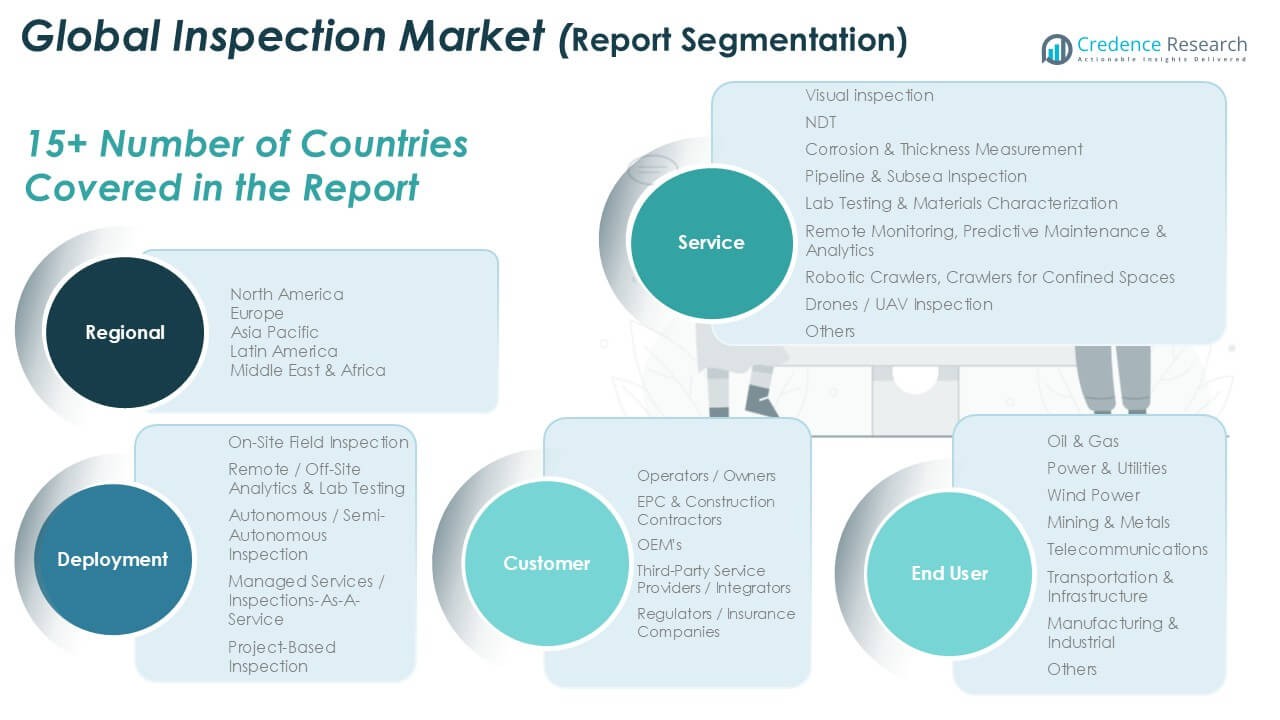
Market Segmentations:
By Services
- Visual Inspection
- NDT
- Corrosion & Thickness Measurement
- Pipeline & Subsea Inspection
- Lab Testing & Materials Characterization
- Remote Monitoring, Predictive Maintenance & Analytics
- Robotic Crawlers, Crawlers for Confined Spaces
- Drones / UAV Inspection
- Others
By Deployment
- On-Site Field Inspection
- Remote / Off-Site Analytics & Lab Testing
- Autonomous / Semi-Autonomous Inspection
- Managed Services / Inspections-As-A-Service
- Project-Based Inspection
By Customer
- Operators / Owners
- EPC & Construction Contractors
- OEMs
- Third-Party Service Providers / Integrators
- Regulators / Insurance Companies
By End User
- Oil & Gas
- Power & Utilities
- Wind Power
- Mining & Metals
- Telecommunications
- Transportation & Infrastructure
- Manufacturing & Industrial
- Others
By Geography
- North America
- Europe
- Asia Pacific
- Latin America
- Middle East
- Africa
Competitive Landscape
The global inspection market is highly competitive, with a mix of multinational corporations and specialized service providers offering diverse portfolios. Leading companies such as SGS SA, Bureau Veritas, TÜV SÜD, Intertek Group plc, and MISTRAS Group dominate through strong global presence, comprehensive service offerings, and advanced digital platforms. Their strategies focus on expanding remote monitoring, predictive maintenance, and robotics-enabled inspections to meet industry demand for efficiency and safety. Regional players like ALS Limited, Eurofins, and Oceaneering strengthen competition by catering to sector-specific needs, particularly in oil & gas, mining, and industrial testing. Recent developments highlight investments in drone inspections, AI-driven analytics, and Inspections-as-a-Service models to gain long-term contracts. Strategic mergers, acquisitions, and partnerships continue to shape the market, enabling companies to expand geographic reach and enhance service capabilities. The competitive environment pushes providers to innovate, improve accuracy, and align with stringent regulatory requirements, ensuring sustained leadership and customer trust.
Shape Your Report to Specific Countries or Regions & Enjoy 30% Off!
Key Player Analysis
- SGS SA
- Bureau Veritas
- TÜV SÜD
- Intertek Group plc
- MISTRAS Group
- NTD
- ALS Limited
- Eurofins
- Oceaneering
- Other Key Players
Recent Developments
- In July 2025, SGS SA announced strong half-year (H1) 2025 financial results with 5.3% organic sales growth and an 80-basis point increase in the adjusted operating income margin.
- In July 2025, SGS was recognized on TIME’s list as the world’s most sustainable TIC company for the year, further cementing its commitment to environmental standards and sustainability in global inspections.
- In May 2025, SGS launched a new AI accreditation service based on ISO/IEC 42001, certifying responsible AI practices to enhance digital trust in global inspection and certification activities.
Report Coverage
The research report offers an in-depth analysis based on Services, Deployment, Customer, End User and Geography. It details leading market players, providing an overview of their business, product offerings, investments, revenue streams, and key applications. Additionally, the report includes insights into the competitive environment, SWOT analysis, current market trends, as well as the primary drivers and constraints. Furthermore, it discusses various factors that have driven market expansion in recent years. The report also explores market dynamics, regulatory scenarios, and technological advancements that are shaping the industry. It assesses the impact of external factors and global economic changes on market growth. Lastly, it provides strategic recommendations for new entrants and established companies to navigate the complexities of the market.
Future Outlook
- The market will expand steadily with consistent demand from oil & gas, power, and infrastructure.
- Adoption of non-destructive testing will remain the dominant service due to safety and compliance needs.
- Digital transformation will accelerate the use of IoT, AI, and predictive maintenance in inspection.
- Drones and robotic crawlers will gain wider acceptance for hazardous and hard-to-reach environments.
- Inspections-as-a-Service models will grow as operators seek cost-effective outsourcing solutions.
- Europe will continue leading the market, supported by strict regulatory compliance requirements.
- Asia Pacific will show the fastest growth, driven by industrial expansion and infrastructure projects.
- Shortage of skilled workforce may slow adoption of advanced inspection technologies.
- Partnerships, mergers, and acquisitions will intensify as players seek global reach and stronger portfolios.
- Sustainability and asset lifecycle management will drive future inspection strategies and investments.


