Market Overview
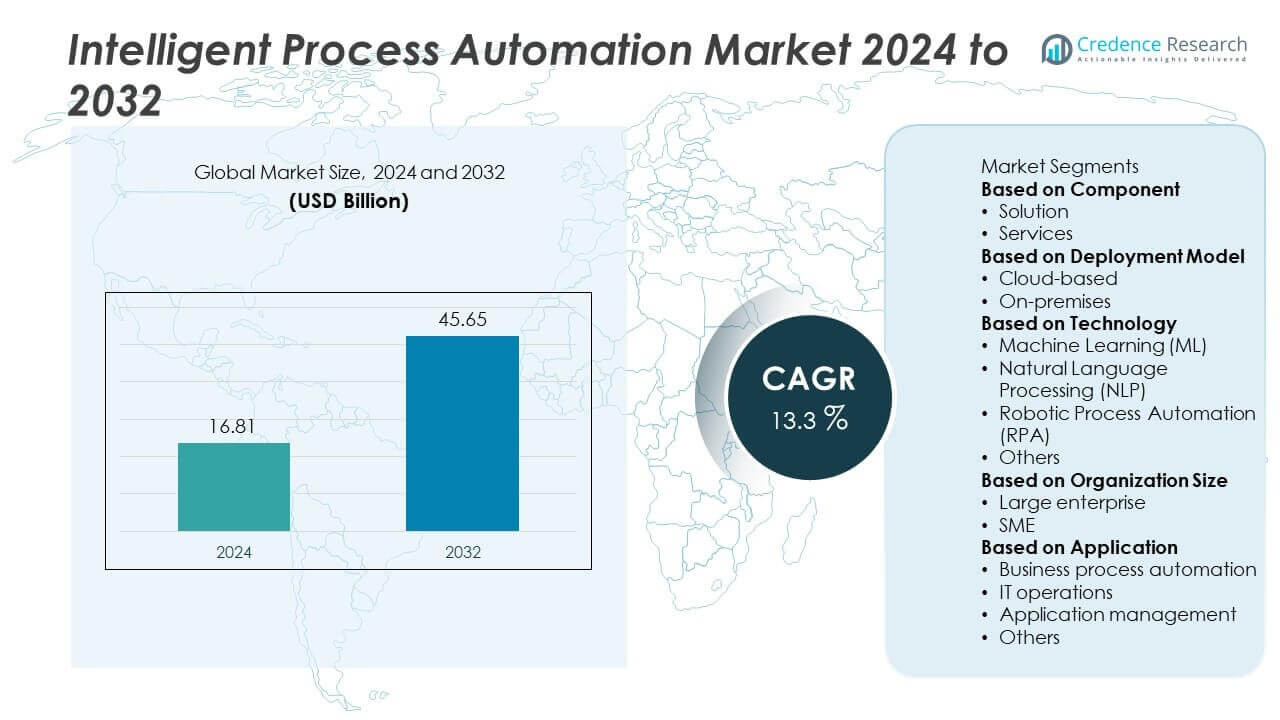
The Intelligent Process Automation Market was valued at USD 16.81 billion in 2024 and is projected to reach USD 45.65 billion by 2032, growing at a CAGR of 13.3% during the forecast period.
| REPORT ATTRIBUTE | DETAILS |
|---|---|
| Historical Period | 2020-2023 |
| Base Year | 2024 |
| Forecast Period | 2025-2032 |
| Intelligent Process Automation Market Size 2024 | USD 16.81 Billion |
| Intelligent Process Automation Market, CAGR | 13.3% |
| Intelligent Process Automation Market Size 2032 | USD 45.65 Billion |
The Intelligent Process Automation market is shaped by top players including SAP SE, Blue Prism, Appian, UiPath, Pegasystems, Kofax, WorkFusion, IBM, Automation Anywhere, and Microsoft. These companies lead through innovations in robotic process automation, AI-driven solutions, and cloud-based platforms that support large-scale enterprise adoption. Regionally, North America dominated the market in 2024 with 38% share, supported by early adoption and strong vendor presence. Europe followed with 28%, driven by strict compliance requirements and digitalization initiatives, while Asia-Pacific accounted for 24%, emerging as the fastest-growing region due to rapid enterprise automation and government-led digital transformation programs.
 Market Insights
- The Intelligent Process Automation market was valued at USD 16.81 billion in 2024 and is projected to reach USD 45.65 billion by 2032, growing at a CAGR of 13.3% during 2024–2032.
- Rising demand for operational efficiency and compliance management drives adoption, with solution components leading at 65% share, supported by cloud-based deployment holding 58% share.
- Key trends include increasing integration of AI, machine learning, and natural language processing, while robotic process automation remained dominant with 47% share in 2024.
- The market is competitive with major players such as SAP SE, Blue Prism, Appian, UiPath, Pegasystems, Kofax, WorkFusion, IBM, Automation Anywhere, and Microsoft focusing on product innovation, cloud expansion, and strategic partnerships.
- Regionally, North America led with 38% share, followed by Europe at 28% and Asia-Pacific at 24%, while Latin America and Middle East & Africa accounted for 6% and 4%, respectively.
Market Segmentation Analysis:
By Component
The solution segment dominated the Intelligent Process Automation market in 2024, holding nearly 65% of the share. Its leadership stems from strong demand for AI-powered platforms that integrate robotic process automation, cognitive tools, and advanced analytics. Enterprises prioritize solutions to improve operational efficiency, reduce manual errors, and optimize decision-making. The services segment, while smaller, is expanding steadily due to rising demand for consulting, system integration, and managed services that support large-scale deployments. The growing focus on automation-driven digital transformation keeps the solution segment at the forefront of this market.
- For instance, In 2024, IBM’s finance team launched the Jobotx initiative, expanding RPA automation capabilities using IBM watsonx Orchestrate™ and IBM Apptio™ Enterprise Business Management (EBM).
By Deployment Model
Cloud-based deployment led the market with over 58% share in 2024, supported by enterprises’ shift toward scalable and cost-efficient automation frameworks. Cloud models reduce infrastructure costs, ensure faster updates, and enable integration across distributed systems, which is critical for large organizations. Vendors emphasize cloud-native IPA platforms to deliver flexibility and rapid implementation. On-premises deployment retains relevance in highly regulated sectors like banking and government, where data security and compliance remain critical. However, the cloud-based model’s scalability and support for hybrid workflows sustain its dominance.
- For instance, Automation Anywhere reported strong financial and performance results for fiscal year 2024, driven by its AI-powered cloud platform. In March 2024, the company announced a record fourth quarter and a strong fiscal year 2024, highlighting its momentum with large enterprise customers and strong customer retention.
By Technology
Robotic Process Automation (RPA) emerged as the dominant technology, accounting for nearly 47% of the market share in 2024. RPA adoption is driven by its ability to automate repetitive, rule-based tasks across finance, HR, and customer service operations, significantly reducing costs and boosting efficiency. Machine Learning (ML) and Natural Language Processing (NLP) are gaining traction as enterprises seek cognitive capabilities for predictive insights and conversational AI. Although “others” include niche tools like computer vision, RPA’s proven return on investment and enterprise-wide applicability ensure its continued leadership.
Key Growth Drivers
Rising Demand for Operational Efficiency
The need to streamline workflows and cut manual effort is a major driver of the Intelligent Process Automation market. Organizations across industries adopt IPA to automate repetitive tasks, reduce errors, and accelerate process execution. This shift enhances productivity while lowering operating costs. Enterprises also leverage automation to manage high-volume transactions and optimize resource allocation. As digital transformation accelerates globally, the pressure to improve efficiency keeps demand for IPA solutions strong, making it a central driver of market expansion.
- For instance, Persistent Systems was recognized as a leader in Intelligent Automation Services in 2024, delivering AI-powered automation through the integration of RPA, low-code, and GenAI technologies. These solutions have delivered significant client outcomes, such as reducing manual billing processing time by 40% for a healthcare client and improving other key metrics in banking and healthcare workflows.
Integration of AI and Advanced Analytics
The integration of Artificial Intelligence and advanced analytics within automation frameworks fuels growth in the IPA market. AI technologies such as machine learning and natural language processing enhance IPA systems with predictive insights, decision-making support, and intelligent task handling. Enterprises value these capabilities for improving customer experiences, detecting anomalies, and enabling data-driven strategies. As organizations focus on unlocking value from big data, the demand for AI-driven automation continues to expand, ensuring stronger adoption of IPA platforms across sectors such as finance, healthcare, and retail.
- For instance, Capgemini’s IPA solutions have reduced finance transaction times by 95% and enabled real-time anomaly detection across supply chains, processing millions of data points per day to optimize decision-making.
Growing Adoption Across Regulated Industries
Heavily regulated industries, including banking, insurance, and healthcare, increasingly adopt Intelligent Process Automation to meet compliance requirements while reducing costs. IPA ensures adherence to strict reporting standards, maintains audit trails, and minimizes compliance risks. Organizations benefit from automating documentation, claims processing, and regulatory filings, which enhances transparency and accuracy. Governments and regulators also encourage digital compliance frameworks, further supporting adoption. With rising scrutiny and stricter laws worldwide, regulated industries serve as a strong driver for the widespread deployment of IPA solutions.
Key Trends & Opportunities
Shift Toward Cloud-Based IPA Platforms
Cloud deployment of Intelligent Process Automation is becoming a key trend, offering enterprises scalability, faster deployment, and reduced infrastructure costs. Businesses increasingly prefer cloud-native platforms for seamless integration across global operations and hybrid work models. Vendors are enhancing their offerings with cloud-driven IPA suites that allow real-time collaboration and monitoring. This transition also aligns with the growing need for business agility and resilience. As more organizations embrace digital-first strategies, the adoption of cloud-based automation solutions presents significant opportunities for vendors.
- For instance, Nividous deployed cloud-based Intelligent Automation (IPA) solutions for manufacturing clients, including one high-tech manufacturer for whom it automated over 20 business processes. The manufacturer saw a 40% reduction in operating costs and a 60% acceleration in turnaround time, while other clients achieved significant process efficiency improvements, such as an 85% improvement in accounts payable.
Expansion into Cognitive and Hyperautomation
The market is witnessing strong momentum toward cognitive automation and hyperautomation. Enterprises are combining RPA with AI, NLP, and process mining to achieve end-to-end automation. Hyperautomation enables organizations to go beyond simple task automation and integrate decision-making and predictive capabilities. This trend creates opportunities for companies to scale automation across multiple functions, from finance to supply chain management. Vendors investing in cognitive technologies are well-positioned to capture demand, as enterprises increasingly seek holistic automation frameworks to remain competitive.
- For instance, Google Cloud’s AI-powered automation framework supports enterprises by processing more than 15 billion data points daily, enabling real-time process mining, anomaly detection, and predictive analytics to optimize supply chain and finance operations.
Key Challenges
High Implementation Costs and Complexity
Despite its benefits, Intelligent Process Automation often requires significant upfront investment in software, integration, and training. The complexity of aligning IPA tools with existing IT systems poses a barrier for small and mid-sized enterprises. Additionally, scaling automation beyond pilot projects can demand extensive customization and skilled resources. These factors slow adoption rates in cost-sensitive organizations. While long-term savings are clear, the initial financial and technical burden remains a key challenge restraining broader IPA implementation, especially among resource-constrained businesses.
Workforce Resistance and Skill Gaps
A major challenge in IPA adoption is resistance from employees who fear job displacement. Many workers perceive automation as a threat, leading to reluctance in adoption and reduced collaboration. Furthermore, organizations face skill gaps in managing and deploying advanced automation tools. The lack of trained professionals in AI, RPA, and analytics hinders effective implementation. Without proper change management and workforce upskilling, organizations struggle to realize the full potential of IPA investments. Overcoming this challenge requires a balanced approach between automation and human capital development.
Regional Analysis
North America
North America held the largest share of the Intelligent Process Automation market in 2024, accounting for 38% of global revenue. The region benefits from early adoption of advanced automation technologies and strong presence of key vendors. Enterprises in the U.S. and Canada leverage IPA to enhance efficiency across banking, insurance, healthcare, and retail sectors. Supportive investments in AI, cloud infrastructure, and robotic process automation also strengthen adoption. Rising demand for customer experience optimization and compliance management continues to drive IPA deployment, making North America the leading market.
Europe
Europe accounted for 28% share of the Intelligent Process Automation market in 2024, driven by strict regulatory frameworks and digital transformation initiatives. Countries such as Germany, the UK, and France prioritize IPA to meet compliance requirements under GDPR and enhance operational transparency. The region also emphasizes automation in banking, insurance, and government sectors, where efficiency and accuracy are vital. Vendors are increasingly offering tailored IPA solutions for European enterprises, aligning with data sovereignty needs. Strong investment in AI and analytics integration supports further market expansion across the region.
Asia-Pacific
Asia-Pacific captured 24% of the Intelligent Process Automation market in 2024, with rapid growth expected during the forecast period. Enterprises in China, India, and Japan are accelerating automation adoption to enhance productivity and manage large-scale operations. Government initiatives promoting digital transformation and AI integration strengthen the adoption of IPA solutions across industries. Cost-efficient cloud-based deployment models appeal to both large enterprises and SMEs. The expansion of IT services, combined with rising investments in automation capabilities, positions Asia-Pacific as the fastest-growing regional market for IPA solutions.
Latin America
Latin America represented 6% of the Intelligent Process Automation market in 2024, supported by increasing demand for process automation in banking, retail, and telecom sectors. Countries such as Brazil and Mexico are leading adoption, driven by the need for efficiency and reduced operating costs. Growing investments in cloud technologies and digital infrastructure encourage IPA deployment across enterprises. While adoption rates remain moderate compared to developed markets, the rising focus on operational optimization and compliance standards drives steady market penetration, offering growth opportunities for global and regional vendors.
Middle East & Africa
The Middle East & Africa accounted for 4% share of the Intelligent Process Automation market in 2024, with adoption concentrated in financial services, energy, and government sectors. Enterprises in the UAE, Saudi Arabia, and South Africa invest in automation to streamline workflows and support digital transformation goals. Governments actively promote AI adoption through national strategies, further encouraging IPA integration. Limited technical expertise and budget constraints slow adoption across smaller enterprises, but strong demand for compliance and efficiency solutions sustains steady growth potential in the region.
Market Segmentations:
By Component
- Solution
- Services
By Deployment Model
- Cloud-based
- On-premises
By Technology
- Machine Learning (ML)
- Natural Language Processing (NLP)
- Robotic Process Automation (RPA)
- Others
By Organization Size
- Large enterprise
- SME
By Application
- Business process automation
- IT operations
- Application management
- Others
By Geography
- North America
- U.S.
- Canada
- Mexico
- Europe
- Germany
- France
- U.K.
- Italy
- Spain
- Rest of Europe
- Asia Pacific
- China
- Japan
- India
- South Korea
- South-east Asia
- Rest of Asia Pacific
- Latin America
- Brazil
- Argentina
- Rest of Latin America
- Middle East & Africa
- GCC Countries
- South Africa
- Rest of the Middle East and Africa
Competitive Landscape
The competitive landscape of the Intelligent Process Automation market features leading players such as SAP SE, Blue Prism, Appian, UiPath, Pegasystems, Kofax, WorkFusion, IBM, Automation Anywhere, and Microsoft. These companies compete by offering advanced automation platforms integrating robotic process automation, machine learning, and natural language processing to deliver end-to-end solutions. Market leaders focus on expanding cloud-native platforms, enhancing AI-driven capabilities, and forming strategic partnerships to strengthen global presence. Continuous investment in product innovation and acquisitions enables them to address diverse industry needs, from finance and healthcare to manufacturing and retail. Vendors also emphasize security, scalability, and compliance-focused features to attract regulated industries. With rising enterprise demand for hyperautomation and cognitive automation, competition is intensifying, pushing players to differentiate through service quality, integration support, and pricing strategies. This dynamic environment fosters rapid innovation while ensuring businesses access robust solutions tailored to digital transformation goals.
Key Player Analysis
Recent Developments
- In August 2025, Appian released AI enhancements: semantic smart search, autoscaling data fabric, and FedRAMP support.
- In 2025, SAP added embedded AI in SAP Build to auto-generate workflows, code, and tests.
- In November 2024, SAP emphasized its Build Process Automation framework to simplify end-to-end process automation.
- In August 2024, Gartner named Blue Prism a leader alongside UiPath, Microsoft, Automation Anywhere in the RPA / automation space.
Report Coverage
The research report offers an in-depth analysis based on Component, Deployment Model, Technology, Organization Size, Application and Geography. It details leading market players, providing an overview of their business, product offerings, investments, revenue streams, and key applications. Additionally, the report includes insights into the competitive environment, SWOT analysis, current market trends, as well as the primary drivers and constraints. Furthermore, it discusses various factors that have driven market expansion in recent years. The report also explores market dynamics, regulatory scenarios, and technological advancements that are shaping the industry. It assesses the impact of external factors and global economic changes on market growth. Lastly, it provides strategic recommendations for new entrants and established companies to navigate the complexities of the market.
Future Outlook
- The market will expand rapidly as enterprises scale automation across industries.
- Cloud-based deployment will strengthen its lead with rising demand for flexible and scalable platforms.
- Robotic process automation will continue as the dominant technology in enterprise adoption.
- AI-driven tools such as machine learning and NLP will gain stronger integration into automation platforms.
- Vendors will focus on hyperautomation strategies to deliver end-to-end process optimization.
- Regulated industries like banking and healthcare will drive adoption for compliance and reporting needs.
- Workforce upskilling programs will grow to address automation-related skill gaps.
- Strategic partnerships and acquisitions will increase as vendors compete to expand capabilities.
- Asia-Pacific will emerge as the fastest-growing regional market with government-led digital initiatives.
- Security, governance, and data privacy will remain priorities in intelligent automation deployments.

Request a Free Sample
Fill in your details and we'll send you a free sample report.
- Sample data tables & charts
- Research methodology
Need a Custom Version of This Report?
Tailor the scope, geography, or segments to your exact requirements.
- Custom geography or segment scope
- Direct access to our analyst team
Frequently Asked Questions
What is the current market size for Intelligent Process Automation market, and what is its projected size in 2032?
At what Compound Annual Growth Rate is the Intelligent Process Automation market projected to grow between 2025 and 2032?
Which Intelligent Process Automation market segment held the largest share in 2024?
What are the primary factors fueling the growth of the Intelligent Process Automation market?
Who are the leading companies in the Intelligent Process Automation market?
Which region commanded the largest share of the Intelligent Process Automation market in 2024?
Table of Content
Chapter 1. Report Introduction
- 1.1 Report Description & Purpose
- 1.1.1 Report Title & Market Definition
- 1.1.2 Unique Selling Propositions (USP) & Key Differentiators
- 1.1.3 Value Proposition for Stakeholders
- 1.2 Research Objectives
- 1.2.1 Market Sizing Objectives (Volume & Revenue) (Volume Where Applicable)
- 1.2.2 Segmentation Objectives
- 1.2.3 Competitive Intelligence Objectives
- 1.2.4 Forecast & Scenario Objectives
- 1.3 Report Scope
- 1.3.1 Intelligent Process Automation Scope – Segments & Subsegments Covered
- 1.3.2 Geographic Scope – Regions & Countries Covered
- 1.3.3 Historical Period, Base Year & Forecast Period (2024; forecast to 2032)
- 1.3.4 Inclusions & Exclusions
- 1.4 Industry Classification & Applicable Codes
- 1.5 Currency, Measurement Units & Valuation Basis
- 1.6 Target Stakeholders
- 1.7 Limitations & Assumptions
Chapter 2. Executive Summary
- 2.1 Global Intelligent Process Automation Market Snapshot
- 2.1.1 Market Size – Historical (2024) & Forecast (2024-2032) (2024: USD 16.81 billion → 2032: USD 45.65 billion)
- 2.1.2 Volume & Revenue – Global Totals (Volume Where Applicable)
- 2.1.3 Key Market Highlights – Top Five Facts
- 2.2 Intelligent Process Automation Market Segmentation Snapshot
- 2.2.1 Market Split by Region – 2024 vs. 2032
- 2.3 Competitive Snapshot
- 2.3.1 Top 10 Players by Revenue Share – 2024
- 2.3.2 Top 10 Players by Volume Share – 2024 (Volume Where Applicable)
- 2.3.3 Recent Strategic Developments (18-Month Summary)
- 2.4 Key Investment Highlights & Strategic Conclusions
Chapter 3. Intelligent Process Automation Market Dynamics & Industry Analysis
- 3.1 Market Overview & Context
- 3.1.1 Intelligent Process Automation Market Position in the Broader Industry Value Chain
- 3.1.2 Demand Structure & Purchasing Dynamics
- 3.1.3 Market Maturity & Development Stage by Region
- 3.2 Intelligent Process Automation Market Drivers
- 3.3 Intelligent Process Automation Market Restraints & Challenges
- 3.4 Intelligent Process Automation Market Opportunities
- 3.5 Porter's Five Forces Analysis
- 3.5.1 Threat of New Entrants
- 3.5.2 Bargaining Power of Suppliers
- 3.5.3 Bargaining Power of Buyers
- 3.5.4 Threat of Substitutes
- 3.5.5 Competitive Rivalry – Intensity Assessment
- 3.6 Intelligent Process Automation Value Chain Analysis
- 3.6.1 Upstream – Key Inputs, Resources & Suppliers
- 3.6.1.1 Key Input/Resource 1
- 3.6.1.2 Key Input/Resource 2
- 3.6.1.3 Key Input/Resource 3
- 3.6.2 Midstream – Core Operations & Value Creation
- 3.6.2.1 Operating Model & Process Overview
- 3.6.2.2 Key Operating Locations & Capabilities by Company
- 3.6.3 Downstream – Market Channels & End Users
- 3.6.3.1 Direct Sales & Customer Engagement Channels
- 3.6.3.2 Indirect Sales, Intermediaries & Partner Channels
- 3.6.4 Value Chain Profitability Analysis
- 3.6.1 Upstream – Key Inputs, Resources & Suppliers
- 3.7 PESTEL Analysis
- 3.7.1 Political Factors
- 3.7.2 Economic Factors
- 3.7.3 Social Factors
- 3.7.4 Technological Factors
- 3.7.5 Environmental Factors
- 3.7.6 Legal Factors
- 3.8 Intelligent Process Automation Supply Chain Analysis
- 3.8.1 Critical Input & Resource Availability Risk Assessment
- 3.8.2 Supplier & Operational Concentration Risk (Geographic Exposure)
- 3.8.3 Supply & Service Disruption Impact Analysis
- 3.9 Regulatory & Policy Landscape
Note: The regulatory and policy landscape section covers regulations based on their applicability to the market, Intelligent Process Automation category, geography, and scope of the study. Only regulatory frameworks with a material impact on operations, compliance, trade, sustainability, or market access are analyzed in detail.
Chapter 4. Key Investment Pockets & Opportunity Analysis
- 4.1 Intelligent Process Automation Market Attractiveness Analysis
- 4.1.1 By Region – Investment Attractiveness Matrix (Market Size × CAGR)
- 4.2 Absolute Revenue Growth Opportunity
- 4.2.1 By Region – Absolute Revenue Growth Through 2032
- 4.3 Incremental Demand Opportunity
- 4.3.1 By Region – Incremental Demand Through 2032
- 4.3.2 Segment – Incremental Demand
- 4.4 Emerging Submarket Opportunity Deep Dive (Subject to Applicability)
- 4.5 Priority Market Opportunity Scorecards
- 4.5.1 United States
- 4.5.2 Europe
- 4.5.3 Asia
- 4.5.4 Middle East & Africa
Note: Priority market opportunity scorecards reflect the geographic scope and strategic relevance of the study. Listed markets are indicative and may be adapted to the industry.
Chapter 5. Intelligent Process Automation Cross-Border Trade & Market Access Analysis
- 5.1 International Trade & Cross-Border Activity Overview
- 5.1.1 Global Export Value by Country (2024)
- 5.1.2 Global Export Volume by Country (2024) (Volume Where Applicable)
- 5.1.3 Global Import Value by Country (2024)
- 5.1.4 Global Import Volume by Country (2024) (Volume Where Applicable)
- 5.1.5 Net Trade Balance by Country (2024)
- 5.2 Export Analysis – Segment
- 5.2.1 Category 1 (Applicable Classification Code)
- 5.2.2 Category 2 (Applicable Classification Code)
- 5.2.3 Category 3 (Applicable Classification Code)
- 5.2.4 Category 4 (Applicable Classification Code)
- 5.2.5 Category 5 (Applicable Classification Code)
- 5.3 Import Analysis – Segment
- 5.3.1 Category 1 (Applicable Classification Code)
- 5.3.2 Category 2 (Applicable Classification Code)
- 5.3.3 Category 3 (Applicable Classification Code)
- 5.3.4 Category 4 (Applicable Classification Code)
- 5.3.5 Category 5 (Applicable Classification Code)
- 5.4 Cross-Border Pricing & Transaction Benchmarks
- 5.4.1 Export Pricing – Segment & Country
- 5.4.2 Import Pricing – Segment & Source Country
- 5.4.3 Price Trends (2024)
- 5.5 Key Cross-Border Trade & Delivery Routes
- 5.5.1 Cross-Border Trade/Delivery Route 1
- 5.5.2 Cross-Border Trade/Delivery Route 2
- 5.5.3 Cross-Border Trade/Delivery Route 3
- 5.5.4 Cross-Border Trade/Delivery Route 4
- 5.5.5 Cross-Border Trade/Delivery Route 5
- 5.6 Trade Policy & Market Access Impact Assessment
- 5.6.1 Tariff & Non-Tariff Barriers
- 5.6.2 Regional Trade & Economic Integration Frameworks
- 5.6.3 Bilateral & Multilateral Trade Agreements
- 5.6.4 Cross-Border Operating, Licensing & Localization Requirements
Note: This chapter applies where cross-border trade or delivery is relevant to Intelligent Process Automation. Goods, services, and digital offerings are assessed using applicable classifications and transaction measures. Import-export volumes, trade balances, and route analyses are included only where meaningful to the market.
Chapter 6. Competitive Landscape & Company Benchmarking
- 6.1 Intelligent Process Automation Market Concentration & Structure
- 6.1.1 Herfindahl-Hirschman Index (HHI) – vs. 2024
- 6.1.2 Leading, Mid-Sized & Emerging Player Structure
- 6.1.3 Global, Regional & Local Player Dynamics
- 6.2 Intelligent Process Automation Market Share Analysis – 2024
- 6.2.1 Global Revenue Share by Company
- 6.2.2 Global Volume Share by Company (Volume Where Applicable)
- 6.2.3 Regional Revenue Share
- 6.2.4 Market Share Evolution ( vs. 2024)
- 6.2.5 Company Market Share by Key Segment
- 6.2.6 Company Market Share by Customer Group
- 6.3 Operating Scale, Capacity & Infrastructure Analysis
- 6.3.1 Global Operating Scale & Supply Capacity
- 6.3.2 Resource Utilization & Operating Efficiency
- 6.3.3 Output, Service Delivery & Activity Metrics
- 6.3.4 Operating Footprint & Infrastructure Map
- 6.3.5 Planned Operational & Capacity Expansion
- 6.4 Intelligent Process Automation Competitive Benchmarking Matrix
- 6.4.1 Revenue, Growth, Profitability & Operating Metric Comparison
- 6.4.2 Channel Revenue Mix
- 6.4.3 Geographic Revenue Exposure
- 6.4.4 R&D Intensity
- 6.4.5 Sustainability Maturity
- 6.5 Strategic Developments in Intelligent Process Automation (Last 24 Months)
- 6.5.1 Mergers, Acquisitions & Divestments
- 6.5.2 New Products, Services & Solutions in Intelligent Process Automation
- 6.5.3 Operational & Infrastructure Expansions
- 6.5.4 Strategic Alliances, Joint Ventures & Partnerships
- 6.5.5 Distribution Expansion & Market Entry
- 6.5.6 Sustainability & ESG Initiatives
- 6.6 Competitive Strategy Mapping
- 6.6.1 Leader, Challenger, Follower & Niche Classification
- 6.6.2 Pricing Strategy Comparison
- 6.6.3 Channel Strategy Matrix
Note: Strategic developments are included based on their materiality and the availability of reliable information.
Chapter 7. Global Intelligent Process Automation Market – By Sales & Delivery Channel
- 7.1 Segment Overview
- 7.1.1 Volume & Revenue Split by Channel (2024 & 2032) (Volume Where Applicable)
- 7.1.2 Channel Mix Evolution (2024-2032)
Chapter 8. Regional Market Analysis – Global Overview
- 8.1 Global Regional Overview
- 8.1.1 Regional Volume Share (Volume Where Applicable)
- 8.1.2 Regional Revenue Share
- 8.1.3 Regional Volume by Region (Volume Where Applicable)
- 8.1.4 Regional Revenue by Region
- 8.1.5 Regional Forecast Through 2032
- 8.2 Cross-Regional Segment Analysis
- 8.2.1 By Sales & Delivery Channel
- 8.2.2 By Competitive Positioning & Price Tier
Chapter 9. North America Intelligent Process Automation Market
- 9.1 United States
- 9.2 Canada
- 9.3 Mexico
Chapter 10. Europe Intelligent Process Automation Market
- 10.1 Germany
- 10.2 France
- 10.3 Italy
- 10.4 United Kingdom
- 10.5 Spain
- 10.6 Poland
- 10.7 Russia
- 10.8 Netherlands
- 10.9 Belgium
- 10.10 Sweden
- 10.11 Denmark
- 10.12 Norway
- 10.13 Rest of Europe
Chapter 11. Asia Pacific Intelligent Process Automation Market
- 11.1 China
- 11.2 India
- 11.3 Japan
- 11.4 South Korea
- 11.5 Thailand
- 11.6 Indonesia
- 11.7 Vietnam
- 11.8 Malaysia
- 11.9 Australia
- 11.10 Rest of Asia Pacific
Chapter 12. Latin America Intelligent Process Automation Market
- 12.1 Brazil
- 12.2 Argentina
- 12.3 Colombia
- 12.4 Chile
- 12.5 Rest of Latin America
Chapter 13. Middle East Intelligent Process Automation Market
- 13.1 Saudi Arabia
- 13.2 United Arab Emirates
- 13.3 Turkey
- 13.4 Israel
- 13.5 Iran
- 13.6 Rest of the Middle East
Chapter 14. Africa Intelligent Process Automation Market
- 14.1 South Africa
- 14.2 Egypt
- 14.3 Nigeria
- 14.4 Morocco
- 14.5 Rest of Africa
Chapter 15. Intelligent Process Automation Company Profiles
- 15.1 [Company 01]
- 15.1.1 Company Overview
- 15.1.2 Key Management Personnel
- 15.1.3 Products & Services Portfolio
- 15.1.4 Financial Performance
- 15.1.5 Key Market Focus & Geographic Presence
- 15.1.6 Recent Developments & Strategic Initiatives
Note: The company profile list is preliminary and may change based on research findings, market developments, data availability, and client requirements.
Chapter 16. Appendices
- Appendix A – List of Abbreviations & Acronyms
- Appendix B – Industry Classification Code Reference – Full Series
- Appendix C – Supply, Output & Operating Capacity Data Tables
- Appendix D – End-Use & Demand Base Tables
- Appendix E – Demand, Adoption & Usage Assumptions
- Appendix F – Pricing & Revenue Metric Reference Tables
- Appendix G – Company Operations & Infrastructure Database
- Appendix H – Cross-Border Trade & Activity Data Tables (Where Applicable)
- Appendix I – Regulatory Summary Tables
- Appendix J – Primary Research Participant List (Anonymized)
- Appendix K – Primary Research Questionnaire Framework
- Appendix L – Data Sources & Bibliography
- Appendix M – Market Size Divergence & Source Comparison
Chapter 17. Research Methodology
- 17.1 Research Framework & Philosophy
- 17.2 Secondary Research – Sources, Hierarchy & Data Extraction
- 17.3 Data Modeling – Bottom-Up & Top-Down Market Sizing
- 17.4 Primary Research – Stakeholder Framework, LOI & Sample Sizes
- 17.5 Forecast Methodology – Regression, Scenario & Sensitivity Analysis
- 17.6 Quality Control – Four-Layer Validation Framework
- 17.7 Limitations & Standard Assumptions
- 17.8 Disclaimer