Home » Information and Communications Technology » IoT in Oil and Gas Market

IoT in Oil and Gas Market by Solution (Sensing, Communication, Cloud Computing, Data Management) by Application (Fleet and Asset Management, Pipeline Monitoring, Preventive Maintenance, Others)- Growth, Future Prospects And Competitive Analysis, 2016 – 2028

Price: $4699

Published: | Report ID: 7294 | Report Format : PDF

IoT in Oil and Gas Market Analysis

IoT in the oil and gas market is expected to increase briskly in the coming decade. This is due to several factors. First, technologies currently being used in the oil and gas sector are diverse. Also, several technologies will be implemented shortly. These include software for monitoring industrial facilities, sensor networks for automating processes, and automatic control systems, to name a few.

IoT in the oil and gas market is not something new. All algorithms have been used for various purposes like monitoring equipment, maintaining equipment, improving quality standards, and optimizing production.

IoT in Oil and Gas Market

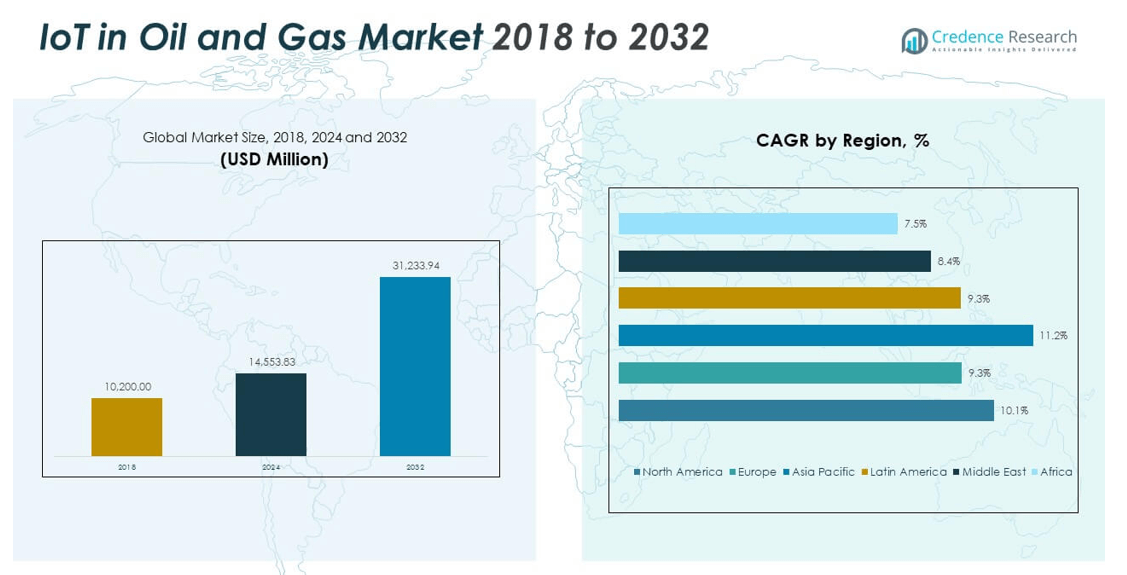
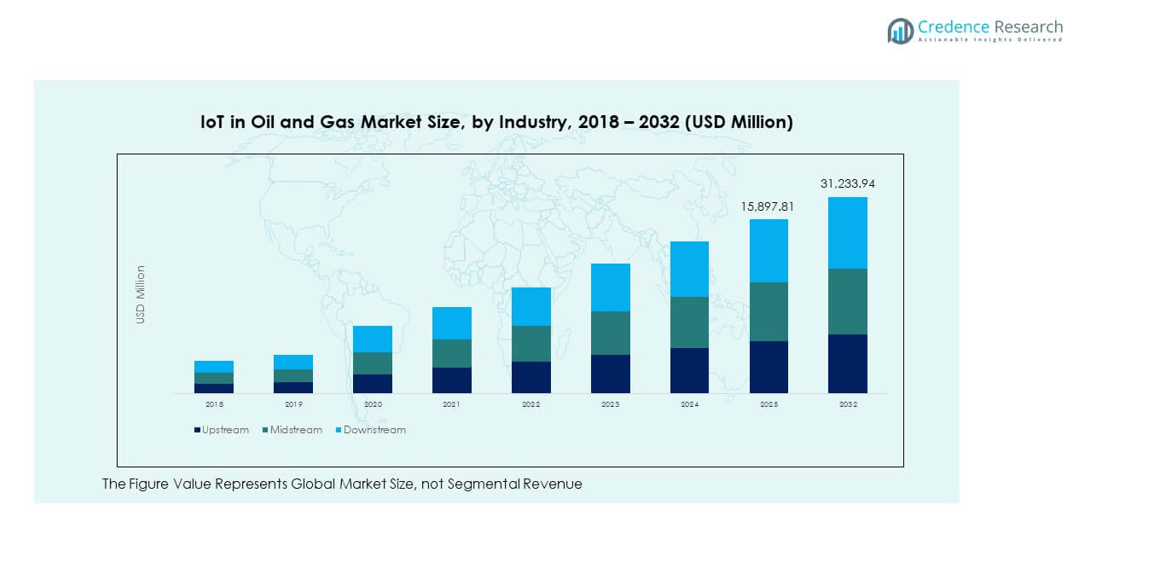
Global IoT in the Oil and Gas market is expected to witness a CAGR of 19.65% during the forecast period. As a result, the revenue generated by the global IoT in the Oil and Gas market in 2021 was over USD 23,489 million and is expected to generate revenue worth USD 86,263 million in 2028.

Design Element 2

Access crucial information at unmatched prices!

Request your free sample report today & start making informed decisions powered by Credence Research!

Download Free Sample

CTA Design Element 3

Interesting Facts about IoT in Oil and Gas Industry

  • IoT in Oil and Gas helps monitor wells in remote areas
  • Average IoT in Oil and Gas costs around USD 50 K to USD 100 K
  • IoT can provide accurate real-time data for making decisions
  • IoT automation in O&G decreases machinery malfunction and reduces stoppage
  • IoT eradicates an excessive number of risks and mistakes, often caused by the human factor

IoT in Oil & Gas Helps to Overcome Scarcity of Professionals 

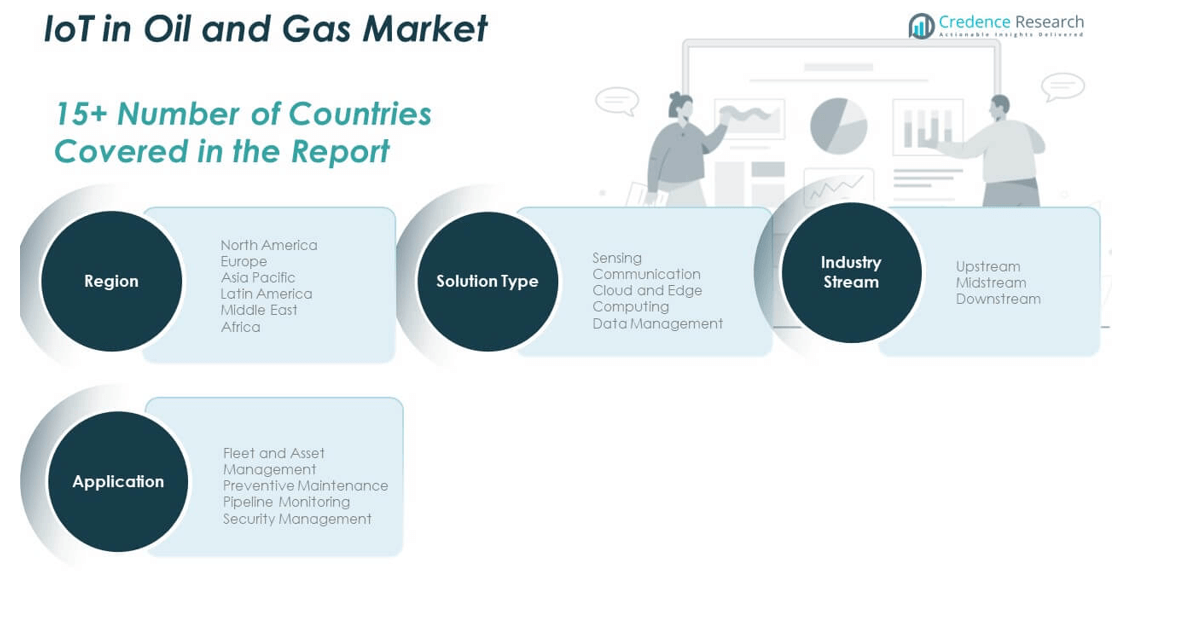
Developing IoT in the oil and gas industry has its fair share of challenges and formidable tasks that must be remediated to be adopted. Among these challenges are the stringent standards for quality as well as safety. In addition, the shortage of experts in the field will have an adverse effect on the IoT in the oil and gas market. Sensing, Communication, Cloud Computing, and Data Management are some of the significant solutions segments of IoT in the Oil and Gas industry. Sensing & communication are the most comprehensive solutions for IoT in Oil and Gas.

Increase Operational Efficiency and Margins 

Downstream companies can benefit from higher profit margins if they manage to sell gas and oil products at optimal rates. Hence, they must apply IoT in oil and gas to track inventory and manage it efficiently so that overheads and associated costs can go down, increasing profits. Hence, IoT in oil and gas directly affects the profitability of downstream companies, which will prove to be one of the driving factors for its adoption. IoT in Oil and Gas is applied in Fleet and Asset Management, Pipeline Monitoring, Preventive Maintenance, and others. Fleet management and asset management is the leading application area of IoT in Oil and Gas.

Improve Logistics Processes

Midstream companies are also focusing on IoT in oil and gas. They are mainly concerned with optimizing their logistics processes and following strict standards for quality and safety. In particular, they must maintain their transportation assets to facilitate logistics. This is made possible using IoT equipment to help these midstream companies keep track of all their logistics equipment and units. This will prevent breakdowns and facilitate the uninterrupted supply of oil and gas. Hence, this will be one factor driving IoT’s growth in the oil and gas market.

Streamline Activities

Upstream companies have to invest a lot of money in equipment for exploration and drilling. They have to find new raw materials supplies and boost their existing processes’ efficiency. Many of these companies are focusing on using remote methods for monitoring oil exploration projects. Here again, IoT equipment can help upstream companies to realize these objectives.

Shape Your Report to Specific Countries or Regions & Enjoy 30% Off!

Implementation of IoT Involves Significant Challenges

However, designing IoT equipment for such an environment has technical challenges. Thus, IoT equipment must be capable of dealing with the elements, withstanding extreme temperatures and rugged working conditions. This can hinder the growth of IoT in the oil and gas market. IoT solutions designed for the oil and gas sector are mainly concerned with remote monitoring. Information can control various key processes to expedite production and boost efficiency.

HCL Technologies Ltd., Honeywell International Inc., Amazon Web Services, Inc., C3 IoT, Inc., CISCO Systems Inc., Analog Device, Inc., ENGIE, Eaton Corporation Plc, Emerson Electric Co., Equinor ASA, BP p.l.c., Broadcom Inc., ABB Ltd., Alphabet Inc., General Electric, Cognizant, IBM Corporation, and Infineon Technologies AG are some of the major companies provide IoT in Oil & Gas solutions.

1. Preface
1.1. Report Description
1.1.1. Purpose of the Report
1.1.2. Target Audience
1.1.3. USP and Key Offerings
1.2. Research Scope
1.3. Research Methodology
1.3.1. Phase I – Secondary Research
1.3.2. Phase II – Primary Research
1.3.3. Phase III – Expert Panel Review
1.3.4. Approach Adopted
1.3.4.1. Top-Down Approach
1.3.4.2. Bottom-Up Approach
1.3.5. Assumptions
1.4. Market Segmentation

2. Executive Summary
2.1. Market Snapshot: Global IoT in Oil and Gas Market

3. Market Dynamics & Factors Analysis
3.1. Introduction
3.1.1. Global IoT in Oil and Gas Market Value, 2016-2028, (US$ Bn)
3.2. Market Dynamics
3.2.1. Key Growth Trends
3.2.2. Major Industry Challenges
3.2.3. Key Growth Pockets
3.3. Attractive Investment Proposition,2021
3.3.1. Solutions
3.3.2. Application
3.3.3. Geography
3.4. Porter’s Five Forces Analysis
3.4.1. Threat of New Entrants
3.4.2. Bargaining Power of Buyers/Consumers
3.4.3. Bargaining Power of Suppliers
3.4.4. Threat of Substitute Solutions
3.4.5. Intensity of Competitive Rivalry
3.5. Value Chain Analysis

4. Market Positioning of Key Players, 2021
4.1. Company market share of key players, 2021
4.2. Top 6 Players
4.3. Top 3 Players
4.4. Major Strategies Adopted by Key Players

5. COVID 19 Impact Analysis
5.1. Global IoT in Oil and Gas Market Pre Vs Post COVID 19, 2019 – 2028
5.2. Impact on Import & Export
5.3. Impact on Demand & Supply

6. North America
6.1. North America IoT in Oil and Gas Market, by Country, 2016-2028(US$ Bn)
6.1.1. U.S.
6.1.2. Canada
6.1.3. Mexico
6.2. North America IoT in Oil and Gas Market, by Solutions, 2016-2028(US$ Bn)
6.2.1. Overview
6.2.2. Communication
6.2.3. Cloud Computing
6.2.4. Data Management
6.3. North America IoT in Oil and Gas Market, by Application, 2016-2028(US$ Bn)
6.3.1. Overview
6.3.2. Fleet and Asset Management
6.3.3. Pipeline Monitoring
6.3.4. Preventive Maintenance
6.3.5. Others

7. Europe
7.1. Europe IoT in Oil and Gas Market, by Country, 2016-2028(US$ Bn)
7.1.1. UK
7.1.2. France
7.1.3. Germany
7.1.4. Italy
7.1.5. Russia
7.1.6. Spain
7.1.7. Belgium
7.1.8. Netherland
7.1.9. Austria
7.1.10. Sweden
7.1.11. Poland
7.1.12. Denmark
7.1.13. Switzerland
7.1.14. Rest of Europe
7.2. Europe IoT in Oil and Gas Market, by Solutions, 2016-2028(US$ Bn)
7.2.1. Overview
7.2.2. Communication
7.2.3. Cloud Computing
7.2.4. Data Management
7.3. Europe IoT in Oil and Gas Market, by Application, 2016-2028(US$ Bn)
7.3.1. Overview
7.3.2. Fleet and Asset Management
7.3.3. Pipeline Monitoring
7.3.4. Preventive Maintenance
7.3.5. Others

8. Asia Pacific
8.1. Asia Pacific IoT in Oil and Gas Market, by Country, 2016-2028(US$ Bn)
8.1.1. China
8.1.2. Japan
8.1.3. South Korea
8.1.4. India
8.1.5. Australia
8.1.6. New Zealand
8.1.7. Taiwan
8.1.8. Southeast Asia
8.1.9. Central Asia
8.1.10. Rest of Asia Pacific
8.2. Asia Pacific IoT in Oil and Gas Market, by Solutions, 2016-2028(US$ Bn)
8.2.1. Overview
8.2.2. Communication
8.2.3. Cloud Computing
8.2.4. Data Management
8.3. Asia Pacific IoT in Oil and Gas Market, by Application, 2016-2028(US$ Bn)
8.3.1. Overview
8.3.2. Fleet and Asset Management
8.3.3. Pipeline Monitoring
8.3.4. Preventive Maintenance
8.3.5. Others

9. Latin America
9.1. Latin America IoT in Oil and Gas Market, by Country, 2016-2028(US$ Bn)
9.1.1. Brazil
9.1.2. Argentina
9.1.3. Peru
9.1.4. Chile
9.1.5. Colombia
9.1.6. Rest of Latin America
9.2. Latin America IoT in Oil and Gas Market, by Solutions, 2016-2028(US$ Bn)
9.2.1. Overview
9.2.2. Communication
9.2.3. Cloud Computing
9.2.4. Data Management
9.3. Latin America IoT in Oil and Gas Market, by Application, 2016-2028(US$ Bn)
9.3.1. Overview
9.3.2. Fleet and Asset Management
9.3.3. Pipeline Monitoring
9.3.4. Preventive Maintenance
9.3.5. Others

10. Middle East
10.1. Middle East IoT in Oil and Gas Market, by Country, 2016-2028(US$ Bn)
10.1.1. UAE
10.1.2. KSA
10.1.3. Israel
10.1.4. Turkey
10.1.5. Iran
10.1.6. Rest of Middle East
10.2. Middle East IoT in Oil and Gas Market, by Solutions, 2016-2028(US$ Bn)
10.2.1. Overview
10.2.2. Communication
10.2.3. Cloud Computing
10.2.4. Data Management
10.3. Middle East IoT in Oil and Gas Market, by Application, 2016-2028(US$ Bn)
10.3.1. Overview
10.3.2. Fleet and Asset Management
10.3.3. Pipeline Monitoring
10.3.4. Preventive Maintenance
10.3.5. Others

11. Africa
11.1. Africa IoT in Oil and Gas Market, by Country, 2016-2028(US$ Bn)
11.1.1. South Africa
11.1.2. Egypt
11.1.3. Nigeria
11.1.4. Rest of Africa
11.2. Africa IoT in Oil and Gas Market, by Solutions, 2016-2028(US$ Bn)
11.2.1. Overview
11.2.2. Communication
11.2.3. Cloud Computing
11.2.4. Data Management
11.3. Africa IoT in Oil and Gas Market, by Application, 2016-2028(US$ Bn)
11.3.1. Overview
11.3.2. Fleet and Asset Management
11.3.3. Pipeline Monitoring
11.3.4. Preventive Maintenance
11.3.5. Others

12. Global
12.1. Global IoT in Oil and Gas Market, by Solutions, 2016-2028(US$ Bn)
12.1.1. Overview
12.1.2. Communication
12.1.3. Cloud Computing
12.1.4. Data Management
12.2. lobal IoT in Oil and Gas Market, by Application, 2016-2028(US$ Bn)
12.2.1. Overview
12.2.2. Fleet and Asset Management
12.2.3. Pipeline Monitoring
12.2.4. Preventive Maintenance
12.2.5. Others

13. Company Profiles
13.1. HCL Technologies Ltd.
13.2. Honeywell International Inc.
13.3. Amazon Web Services, Inc.
13.4. C3 IoT, Inc.
13.5. CISCO Systems Inc.
13.6. Analog Device, Inc.
13.7. ENGIE
13.8. Eaton Corporation Plc
13.9. Emerson Electric Co.
13.10. Equinor ASA
13.11. BP p.l.c.
13.12. Broadcom Inc.
13.13. ABB Ltd.
13.14. Alphabet Inc.
13.15. General Electric
13.16. Cognizant
13.17. IBM Corporation
13.18. Infineon Technologies AG
13.19. Others

List of Figures

FIG. 1 Global IoT in Oil and Gas Market: Research Methodology
FIG. 2 Market Size Estimation – Top Down & Bottom up Approach
FIG. 3 Global IoT in Oil and Gas Market Segmentation
FIG. 4 Global IoT in Oil and Gas Market, by Solutions, 2019 (US$ Bn)
FIG. 5 Global IoT in Oil and Gas Market, by Application, 2021 (US$ Bn)
FIG. 6 Global IoT in Oil and Gas Market, by Geography, 2021 (US$ Bn)
FIG. 7 Attractive Investment Proposition, by Geography, 2021
FIG. 8 Global Market Positioning of Key IoT in Oil and Gas Market Manufacturers, 2019
FIG. 9 Global IoT in Oil and Gas Market Value Contribution, By Solutions, 2021 & 2028 (Value %)
FIG. 10 Global IoT in Oil and Gas Market, by Communication, Value, 2016-2028 (US$ Bn)
FIG. 11 Global IoT in Oil and Gas Market, by Cloud Computing, Value, 2016-2028 (US$ Bn)
FIG. 12 Global IoT in Oil and Gas Market, by Data Management, Value, 2016-2028 (US$ Bn)
FIG. 13 Global IoT in Oil and Gas Market Value Contribution, By Application, 2021 & 2028 (Value %)
FIG. 14 Global IoT in Oil and Gas Market, by Fleet and Asset Management, Value, 2016-2028 (US$ Bn)
FIG. 15 Global IoT in Oil and Gas Market, by Pipeline Monitoring, Value, 2016-2028 (US$ Bn)
FIG. 16 Global IoT in Oil and Gas Market, by Preventive Maintenance, Value, 2016-2028 (US$ Bn)
FIG. 17 U.S. IoT in Oil and Gas Market, 2016-2028 (US$ Bn)
FIG. 18 Rest of North America IoT in Oil and Gas Market, 2016-2028 (US$ Bn)
FIG. 19 U.K. IoT in Oil and Gas Market, 2016-2028 (US$ Bn)
FIG. 20 Germany IoT in Oil and Gas Market, 2016-2028 (US$ Bn)
FIG. 21 France IoT in Oil and Gas Market, 2016-2028 (US$ Bn)
FIG. 22 Italy IoT in Oil and Gas Market, 2016-2028 (US$ Bn)
FIG. 23 Spain IoT in Oil and Gas Market, 2016-2028 (US$ Bn)
FIG. 24 Russia IoT in Oil and Gas Market, 2016-2028 (US$ Bn)
FIG. 25 BENELUX IoT in Oil and Gas Market, 2016-2028 (US$ Bn)
FIG. 26 Poland IoT in Oil and Gas Market, 2016-2028 (US$ Bn)
FIG. 27 Austria IoT in Oil and Gas Market, 2016-2028 (US$ Bn)
FIG. 28 Rest of Europe IoT in Oil and Gas Market, 2016-2028 (US$ Bn)
FIG. 29 Japan IoT in Oil and Gas Market, 2016-2028 (US$ Bn)
FIG. 30 China IoT in Oil and Gas Market, 2016-2028 (US$ Bn)
FIG. 31 India IoT in Oil and Gas Market, 2016-2028 (US$ Bn)
FIG. 32 South Korea IoT in Oil and Gas Market, 2016-2028 (US$ Bn)
FIG. 33 Australia IoT in Oil and Gas Market, 2016-2028 (US$ Bn)
FIG. 34 Southeast Asia IoT in Oil and Gas Market, 2016-2028 (US$ Bn)
FIG. 35 Rest of Asia Pacific IoT in Oil and Gas Market, 2016-2028 (US$ Bn)
FIG. 36 Middle East & Africa IoT in Oil and Gas Market, 2016-2028 (US$ Bn)
FIG. 37 South Africa IoT in Oil and Gas Market, 2016-2028 (US$ Bn)
FIG. 38 Nigeria IoT in Oil and Gas Market, 2016-2028 (US$ Bn)
FIG. 39 Egypt IoT in Oil and Gas Market, 2016-2028 (US$ Bn)
FIG. 40 GCC IoT in Oil and Gas Market, 2016-2028 (US$ Bn)
FIG. 41 Israel IoT in Oil and Gas Market, 2016-2028 (US$ Bn)
FIG. 42 Latin America IoT in Oil and Gas Market, 2016-2028 (US$ Bn)
FIG. 43 Mechanicalzil IoT in Oil and Gas Market, 2016-2028 (US$ Bn)
FIG. 44 Argentina IoT in Oil and Gas Market, 2016-2028 (US$ Bn)
FIG. 45 Colombia IoT in Oil and Gas Market, 2016-2028 (US$ Bn)
FIG. 46 Peru IoT in Oil and Gas Market, 2016-2028 (US$ Bn)
FIG. 47 Chile IoT in Oil and Gas Market, 2016-2028 (US$ Bn)

List of Tables

TABLE 1 Market Snapshot: Global Beauty Devices (IoT in Oil and Gas) Market
TABLE 2 Global IoT in Oil and Gas Market, by Solutions, 2016-2028 (US$ Bn)
TABLE 3 Global IoT in Oil and Gas Market, by Application, 2016-2028 (US$ Bn)
TABLE 4 Global IoT in Oil and Gas Market, by Geography, 2016-2028 (US$ Bn)
TABLE 5 North America IoT in Oil and Gas Market, by Solutions, 2016-2028 (US$ Bn)
TABLE 6 North America IoT in Oil and Gas Market, by Application, 2016-2028 (US$ Bn)
TABLE 7 North America IoT in Oil and Gas Market, by Country, 2016-2028 (US$ Bn)
TABLE 8 Europe IoT in Oil and Gas Market, by Solutions, 2016-2028 (US$ Bn)
TABLE 9 Europe IoT in Oil and Gas Market, by Application, 2016-2028 (US$ Bn)
TABLE 10 Europe IoT in Oil and Gas Market, by Country/Region, 2016-2028 (US$ Bn)
TABLE 11 Asia Pacific IoT in Oil and Gas Market, by Solutions, 2016-2028 (US$ Bn)
TABLE 12 Asia Pacific IoT in Oil and Gas Market, by Application, 2016-2028 (US$ Bn)
TABLE 13 Asia Pacific IoT in Oil and Gas Market, by Country/Region, 2016-2028 (US$ Bn)
TABLE 14 Latin America IoT in Oil and Gas Market, by Solutions, 2016-2028 (US$ Bn)
TABLE 15 Latin America IoT in Oil and Gas Market, by Application, 2016-2028 (US$ Bn)
TABLE 16 Latin America IoT in Oil and Gas Market, by Country/Region, 2016-2028 (US$ Bn)
TABLE 17 Middle East IoT in Oil and Gas Market, by Solutions, 2016-2028 (US$ Bn)
TABLE 18 Middle East IoT in Oil and Gas Market, by Application, 2016-2028 (US$ Bn)
TABLE 19 Middle East IoT in Oil and Gas Market, by Country/Region, 2016-2028 (US$ Bn)
TABLE 20 Africa IoT in Oil and Gas Market, by Solutions, 2016-2028 (US$ Bn)
TABLE 21 Africa IoT in Oil and Gas Market, by Application, 2016-2028 (US$ Bn)
TABLE 22 Africa IoT in Oil and Gas Market, by Country/Region, 2016-2028 (US$ Bn)

Frequently asked questions

How COVID 19 Impacted IoT in Oil and Gas Market?

Likewise other industries, COVID 19 also taken a toll on IoT in Oil and Gas market with around 7.56% decline in its revenue in 2020 as compare to 2019

Which is the leading regional market for IoT in Oil and Gas?

North America is the largest regional market with highest share in the total revenue of IoT in Oil and Gas consumed in 2021

What is the major growth driving factors for global IoT in Oil and Gas market?

Need to increase operation efficiency and overcome the scarcity of professionals is driving demand for IoT in Oil and Gas

Which is major segment in IoT in Oil and Gas market by Solutions?

Sensing & Communication segment dominated the IoT in Oil and Gas market in 2021 with over 55% share

Which is major segment in IoT in Oil and Gas market by application?

Fleet & Asset Management segment was the largest application of IoT in Oil and Gas in 2021 with over 40% share

Russia Physiotherapy Equipment Market

Published:
Report ID: 63955

Physiotherapy Equipment Market

Published:
Report ID: 63938

Brazil Physiotherapy Equipment Market

Published:
Report ID: 63932

Spain Physiotherapy Equipment Market

Published:
Report ID: 63928

India Physiotherapy Equipment Market

Published:
Report ID: 63914

France Physiotherapy Equipment Market

Published:
Report ID: 63905

Australia Physiotherapy Equipment Market

Published:
Report ID: 63880

Probiotic Infant Formula Market

Published:
Report ID: 63047

Probiotic for Kids Market

Published:
Report ID: 63042

LED Video Walls Market

Published:
Report ID: 12216

Biometrics Technology Market

Published:
Report ID: 1464

Air Transport MRO Market

Published:
Report ID: 1191

Air Separation Plant Market

Published:
Report ID: 1279

Asset Tracking And Inventory Management Solutions Market

Published:
Report ID: 2327

Architectural Services Market

Published:
Report ID: 54588

Advanced Cinema Projector Market

Published:
Report ID: 1576

3D Radar Market

Published:
Report ID: 973

Managed File Transfer Software and Service Market

Published:
Report ID: 63711

Next Generation Intrusion Prevention System (NGIPS) Market

Published:
Report ID: 63689

Navigation Imaging and Positioning Solutions Market

Published:
Report ID: 63677

Multicarrier Parcel Management Solutions Software Market

Published:
Report ID: 63643

Purchase Options

The report comes as a view-only PDF document, optimized for individual clients. This version is recommended for personal digital use and does not allow printing.
$4699

To meet the needs of modern corporate teams, our report comes in two formats: a printable PDF and a data-rich Excel sheet. This package is optimized for internal analysis and multi-location access, making it an excellent choice for organizations with distributed workforce.
$5699

The report will be delivered in printable PDF format along with the report’s data Excel sheet. This license offers 100 Free Analyst hours where the client can utilize Credence Research Inc.’s research team. It is highly recommended for organizations seeking to execute short, customized research projects related to the scope of the purchased report.
$7699

Smallform of Sample request

Have a question?

User Profile

Don’t settle for less – trust Mitul to help you find the best solution.

Report delivery within 24 to 48 hours

– Other Info –

What people say?-

User Review

I am very impressed with the information in this report. The author clearly did their research when they came up with this product and it has already given me a lot of ideas.

Jana Schmidt
CEDAR CX Technologies

– Connect with us –

Phone

+91 6232 49 3207


support

24/7 Research Support


sales@credenceresearch.com

– Research Methodology –

Going beyond the basics: advanced techniques in research methodology

– Trusted By –

Pepshi, LG, Nestle
Motorola, Honeywell, Johnson and johnson
LG Chem, SIEMENS, Pfizer
Unilever, Samsonite, QIAGEN