Market Overview
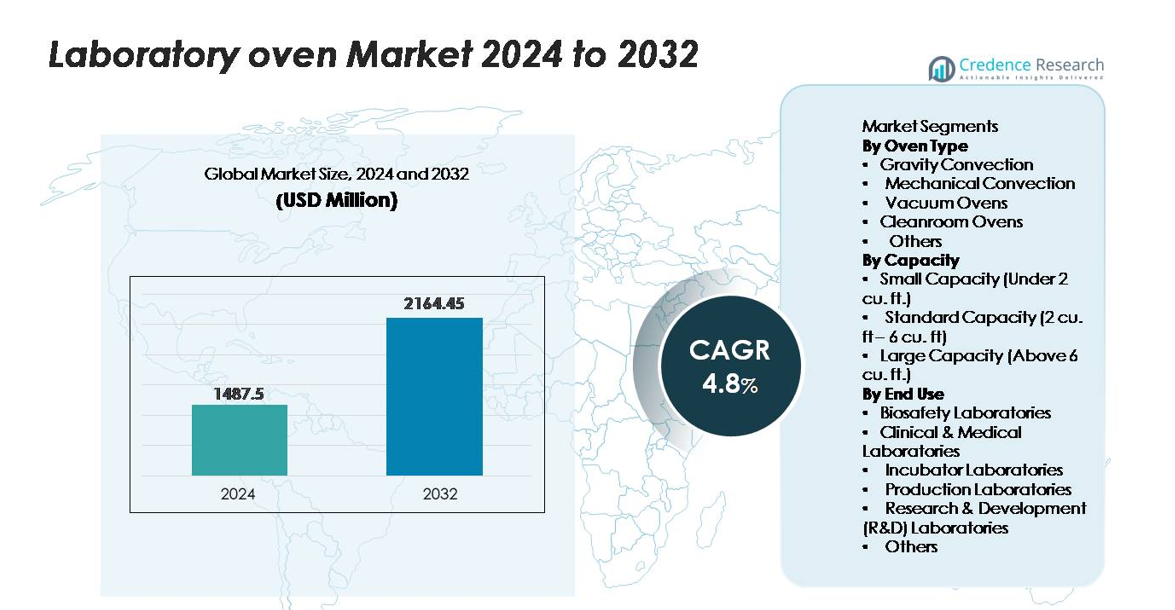
The global laboratory oven market was valued at USD 1,487.5 million in 2024 and is anticipated to reach USD 2,164.45 million by 2032, reflecting a CAGR of 4.8% over the forecast period.
| REPORT ATTRIBUTE |
DETAILS |
| Historical Period |
2020-2023 |
| Base Year |
2024 |
| Forecast Period |
2025-2032 |
| Laboratory Oven Market Size 2024 |
USD 1,487.5 million |
| Laboratory Oven Market, CAGR |
4.8% |
| Laboratory Oven Market Size 2032 |
USD 2,164.45 million |
The laboratory oven market features strong competition from global and specialized manufacturers, including Terra Universal, BMT Medical Technology, InterFocus, Agilent Technologies, SciQuip, Carbolite Gero, BINDER, JIM Engineering, Ted Pella, and Thermo Fisher Scientific. These companies compete by offering advanced temperature-uniformity systems, cleanroom-ready ovens, validated thermal controls, and digital interfaces suited for regulated laboratory environments. Thermo Fisher Scientific, BINDER, and Carbolite Gero hold notable influence due to extensive product portfolios and global distribution networks. Regionally, North America leads the market with approximately 32–34% share, driven by robust R&D infrastructure, high equipment modernization rates, and strong demand from clinical, pharmaceutical, and semiconductor laboratories.
Market Insights
- The laboratory oven market was valued at USD 1,487.5 million in 2024 and is projected to reach USD 2,164.45 million by 2032, expanding at a 4.8% CAGR during the forecast period.
- Demand continues to rise as laboratories require precise thermal processing for drying, curing, sterilization, and materials testing, with standard-capacity ovens (2–6 cu. ft.) holding the largest segment share due to their versatility and widespread adoption across research and clinical environments.
- Key market trends include accelerating uptake of digitally connected ovens with data logging, tighter temperature uniformity, and cleanroom-compatible designs that support semiconductor, pharmaceutical, and advanced materials applications.
- Competition intensifies as leading players such as Thermo Fisher Scientific, BINDER, Carbolite Gero, and Terra Universal advance energy-efficient heating systems, validated performance features, and automation-ready controls while smaller specialists focus on cost-effective niche configurations.
- Regionally, North America leads with 32–34%, followed by Europe at 27–29% and Asia Pacific at 24–26%, driven by investments in biotechnology, semiconductor fabrication, and expanding R&D infrastructure.
Access crucial information at unmatched prices!
Request your sample report today & start making informed decisions powered by Credence Research Inc.!
Download Sample
Market Segmentation Analysis:
By Oven Type
Gravity convection ovens lead the market as the dominant sub-segment due to their reliability, uniform heat distribution for routine drying, and lower operational costs, making them highly preferred in academic and standard testing laboratories. Mechanical convection ovens continue to gain traction because their forced-air circulation enables faster temperature recovery and higher productivity for intensive workflows. Vacuum ovens serve specialized applications involving moisture-sensitive or thermally labile samples, while cleanroom ovens support contamination-controlled environments in pharmaceutical and semiconductor production. The “Others” category includes niche high-temperature and customized ovens designed for unique thermal-processing requirements.
- For instance, BINDER’s ED-Series gravity-convection ovens use the APT.line™ preheating chamber technology and achieve a temperature uniformity of ±2.0 °C at 150 °C, with chamber capacities ranging from 53 L to 720 L.
By Capacity
Standard capacity ovens (2–6 cu. ft.) dominate the market because they balance throughput, footprint efficiency, and compatibility with diverse laboratory protocols, making them the preferred choice across clinical labs, industrial quality-control units, and research facilities. Small-capacity models remain vital for space-constrained labs, point-of-care units, and decentralized testing environments requiring compact thermal-processing solutions. Large-capacity ovens serve heavy-duty applications in production labs, pilot-scale operations, and materials testing facilities where high sample volume and wide temperature ranges are essential for operational efficiency.
- For instance, BINDER’s FED-115 mechanical-convection oven falls within this range at 4.1 cu. ft. (118 L) and achieves a maximum temperature of 300 °C with heat-up times of 23 minutes to 150 °C, enabling efficient mid-volume thermal processing.
By End Use
Research & Development (R&D) laboratories represent the dominant sub-segment owing to continuous demand for precise thermal conditioning, moisture removal, and material characterization across biotechnology, materials science, and analytical chemistry workflows. Clinical and medical laboratories also represent a significant share, driven by growing diagnostic volumes and strict sterility requirements. Production laboratories rely on laboratory ovens for curing, component conditioning, and quality inspection in manufacturing settings. Biosafety and incubator laboratories use specialized ovens for sterilization, drying, and controlled heating tasks, while the “Others” category covers food testing labs, academic institutions, and environmental testing facilities supporting diverse heating applications
Key Growth Drivers
Rising Demand for Advanced Thermal Processing Across Scientific and Industrial Workflows
Growing adoption of laboratory ovens stems from the expanding need for precise thermal processing in analytical chemistry, biotechnology, material sciences, and clinical diagnostics. Laboratories now require tighter temperature uniformity, faster heating cycles, and improved chamber stability to support increasingly complex workflows such as moisture analysis, component curing, sterilization, and accelerated aging tests. Manufacturers are responding with ovens incorporating microprocessor-based temperature controllers, programmable cycles, enhanced airflow architecture, and robust insulation systems that improve reproducibility and operational efficiency. Expanding R&D budgets, rising academic research output, and growth in pharmaceutical and semiconductor testing labs further accelerate demand. The industry also benefits from the broader shift toward automated laboratory environments, in which thermally controlled sample preparation is a critical upstream step. As precision-driven research expands across global laboratories, high-performance ovens become indispensable, strengthening market growth.
Expansion of Regulated Industries Requiring Strict Thermal Compliance
Industries operating in regulated environments—including pharmaceuticals, medical devices, food safety, and electronics manufacturing—drive strong demand for ovens that meet stringent validation, calibration, and documentation standards. Increased emphasis on GMP, GLP, and ISO-compliant operations has encouraged laboratories to adopt ovens with validated temperature mapping, certified uniformity, and traceable performance documentation. Regulatory pressure to enhance sterility, contamination control, and product reliability fuels investments in high-precision ovens designed for stability testing, depyrogenation, and controlled drying workflows. As quality audits become more rigorous, laboratories are replacing legacy units with modern systems equipped with automated alarms, real-time monitoring, and user-lockout functions. Growth in drug formulation, bioprocessing, and clinical diagnostics adds to the requirement for highly stable thermal equipment. This regulatory-driven modernization cycle significantly contributes to market expansion across both developed and emerging regions.
- For instance, Memmert’s GMP-compliant oven series supports FDA 21 CFR Part 11–ready data logging through AtmoCONTROL software, offering temperature accuracy within ±0.3 K and integrated audit-trail and alarm functions that enable continuous documented operation for pharmaceutical processing environments.
Increasing Adoption of High-Throughput Testing and Production-Scale Laboratory Operations
The rise of high-volume processing in biotechnology, pharmaceuticals, and materials engineering strengthens demand for laboratory ovens capable of supporting continuous and large-batch workflows. Production laboratories increasingly use ovens for curing polymers, stabilizing components, aging adhesives, and processing microelectronics, requiring greater chamber capacity and faster recovery rates. The industry is also witnessing integration of ovens into semi-automated lab lines, where consistent sample throughput and minimal downtime are essential. Advancements in airflow management, energy-efficient heating elements, and improved chamber geometries support high-throughput demands by reducing cycle times and enhancing uniformity. Additionally, manufacturing expansions across medical devices, optical materials, and battery components create new process-driven applications for precision ovens. As pilot-scale and small-batch production operations expand within modern laboratory environments, robust ovens capable of industrial-grade performance become critical growth contributors.
- For instance, Thermo Fisher Scientific’s large-capacity Heratherm™ and Lindberg/Blue M forced-air ovens offer chamber volumes above 200 liters, with enhanced airflow systems designed to improve temperature stability and reduce recovery times during frequent door openings. These ovens support continuous operation in research and production environments through robust heating elements and optimized convection performance.
Key Trends & Opportunities
Shift Toward Smart, Digitally Connected, and Energy-Efficient Laboratory Ovens
The market is transitioning toward digitally integrated ovens that offer remote monitoring, automated control, and predictive maintenance capabilities. Modern laboratories increasingly prioritize equipment that interfaces with LIMS, cloud dashboards, and IoT platforms to streamline sample tracking and improve compliance documentation. Manufacturers are introducing ovens with advanced PID controllers, touchscreen HMIs, onboard data logging, and Ethernet/Wi-Fi connectivity, enabling real-time temperature audits and multi-user access. Energy efficiency also emerges as a major trend, with engineering improvements in insulation, heat recovery systems, and programmable standby modes reducing operational costs in high-utilization facilities. These developments create significant opportunities for equipment vendors offering smart, automated, and environmentally conscious solutions aligned with evolving laboratory digitization strategies.
- For instance, JIM Engineering’s industrial ovens often incorporate advanced digital controllers with trend display capabilities and support data logging for process monitoring. Many of their models offer optional features such as programmable controls, data loggers, and provisions for remote diagnostics through network integration, enabling improved maintenance across production lines.
Rising Opportunity for Specialized Ovens in Cleanrooms, Nanotechnology, and Semiconductor R&D
Growth in cleanroom-dependent industries such as semiconductor fabrication, nanomaterials research, and advanced electronics creates strong demand for contamination-controlled laboratory ovens. Cleanroom-compatible units with low particle emission, stainless steel interiors, HEPA/ULPA-filtered airflow, and precise thermal stabilization offer a competitive advantage for suppliers. As fabrication processes become increasingly sensitive to micro-contaminants, the requirement for specialized thermal equipment grows across wafer handling, photolithography support, optical coating, and micro-mechanical component processing. The expansion of nanotechnology R&D also opens opportunities for ovens tailored for delicate substrates, thermally labile materials, and vacuum-based drying. Vendors delivering application-specific configurations including inert-gas purging, low outgassing materials, and ultra-accurate uniformity stand to benefit significantly from these emerging high-tech laboratory environments.
- For instance, SciQuip distributes LTE Scientific’s Clean Air Oven (CAO series), which integrates a HEPA H14 filter rated at 99.997% efficiency at 0.3 µm and maintains positive pressure airflow to prevent particle ingress, making it suitable for ISO-classified laboratory environments
Key Challenges
High Equipment Cost and Budget Constraints in Smaller Laboratories
Despite rising demand, laboratory ovens face adoption barriers due to high upfront costs associated with advanced models offering precise thermal control, enhanced uniformity, and compliance features. Smaller laboratories, academic institutions, and resource-limited clinical settings often operate under constrained budgets, making it difficult to justify upgrades from legacy systems. Energy consumption, recurring calibration expenses, and maintenance requirements further strain operational budgets. The challenge intensifies when facilities require specialized ovens such as vacuum, cleanroom, or high-temperature units, which carry significantly higher price points. As research workloads increase, labs must balance performance needs with financial constraints, slowing replacement cycles in cost-sensitive environments and influencing procurement decisions in developing regions.
Technical Limitations in Temperature Uniformity, Contamination Control, and Process Standardization
Maintaining consistent temperature uniformity across chamber zones remains a technical challenge, especially in large-capacity, high-throughput, or multi-shelf ovens. Variations in airflow patterns, loading density, and heat distribution can affect sample integrity and compromise repeatability in tightly regulated workflows. Contamination risks—including particle generation, outgassing, or cross-sample exposure—pose additional issues in pharmaceutical, semiconductor, and materials laboratories requiring ultra-clean conditions. Standardizing oven cycles across diverse applications is complex, as different materials respond uniquely to thermal stress. These limitations demand continuous engineering improvements in insulation, airflow design, and chamber architecture. Vendors must also address end-user expectations for reproducibility, traceability, and environmental control to meet evolving laboratory requirements.
Regional Analysis
North America
North America holds the largest share at approximately 32–34% of the global laboratory oven market, supported by strong investment in biotechnology, pharmaceutical manufacturing, and academic research institutions. The region benefits from a mature regulatory environment, extensive adoption of advanced thermal-processing technologies, and continuous modernization of research infrastructure. High R&D spending from U.S. federal agencies and private-sector laboratories accelerates demand for precision ovens with enhanced temperature uniformity and compliance features. Growth in clinical diagnostics, semiconductor R&D, and medical device production further boosts uptake of mechanical convection, cleanroom-compatible, and large-capacity units across the region.
Europe
Europe accounts for around 27–29% of the market, driven by its strong pharmaceutical manufacturing base, expanding chemical-materials research, and strict regulatory standards for laboratory operations. Demand is reinforced by the presence of leading research universities, clinical laboratories, and biotechnology clusters across Germany, France, the U.K., and the Nordics. The region’s emphasis on GMP/GLP compliance and quality-assured thermal processing encourages adoption of validated laboratory ovens with traceable performance features. Growth in cleanroom infrastructure, electronics R&D, and food safety laboratories also contributes to steady market expansion, with increasing preference for cleanroom ovens and energy-efficient mechanical convection units.
Asia Pacific
Asia Pacific represents the fastest-growing region with a market share of nearly 24–26%, driven by the expansion of pharmaceutical manufacturing, advanced materials research, and semiconductor fabrication in China, Japan, South Korea, and India. Rapid industrialization, government-funded R&D initiatives, and rising investment in life sciences infrastructure propel adoption of high-capacity and application-specific ovens. Growth in microelectronics production, petrochemical testing, and food-quality laboratories strengthens demand for cleanroom-compatible and precision-controlled thermal systems. Increasing laboratory automation, combined with the establishment of new biotechnology clusters, positions Asia Pacific as a key growth engine for technologically advanced and competitively priced laboratory ovens.
Latin America
Latin America holds approximately 6–8% of the global market, supported by expanding clinical diagnostics networks, pharmaceutical packaging operations, and academic research programs. Brazil and Mexico lead regional adoption as they invest in modern laboratory infrastructure and quality-assurance capabilities. Demand is strongest for standard-capacity and economically priced convection ovens used in routine testing, stability analysis, and component preparation. While budget constraints limit large-scale technology upgrades, rising interest in biotechnology research, food-quality testing, and environmental laboratories creates opportunities for manufacturers offering durable, energy-efficient, and compliant ovens tailored to cost-sensitive laboratory environments.
Middle East & Africa
The Middle East & Africa region accounts for about 5–6% of global market share, driven by growing investments in healthcare diagnostics, petrochemical quality labs, and food-safety testing facilities. The Gulf Cooperation Council (GCC) countries lead demand due to ongoing development of hospital laboratories, research centers, and industrial testing units. Precision thermal systems are increasingly required for water-quality testing, pharmaceutical inspection, and materials research. However, limited R&D infrastructure in parts of Africa slows market penetration. Despite this, rising investments in medical laboratories and industrial modernization create steady opportunities for mid-range and robust convection-based laboratory ovens.
Market Segmentations:
By Oven Type
- Gravity Convection
- Mechanical Convection
- Vacuum Ovens
- Cleanroom Ovens
- Others
By Capacity
- Small Capacity (Under 2 cu. ft.)
- Standard Capacity (2 cu. ft – 6 cu. ft)
- Large Capacity (Above 6 cu. ft.)
By End Use
- Biosafety Laboratories
- Clinical & Medical Laboratories
- Incubator Laboratories
- Production Laboratories
- Research & Development (R&D) Laboratories
- Others
By Geography
- North America
- Europe
- Germany
- France
- U.K.
- Italy
- Spain
- Rest of Europe
- Asia Pacific
- China
- Japan
- India
- South Korea
- South-east Asia
- Rest of Asia Pacific
- Latin America
- Brazil
- Argentina
- Rest of Latin America
- Middle East & Africa
- GCC Countries
- South Africa
- Rest of the Middle East and Africa
Competitive Landscape
The competitive landscape of the laboratory oven market is characterized by a mix of global manufacturers and specialized regional suppliers focused on precision heating technologies, compliance-ready designs, and application-specific solutions. Leading companies compete through advancements in temperature uniformity, energy-efficient heating elements, improved airflow architectures, and digital control systems with integrated data logging. Many vendors emphasize product validation, GMP/GLP compliance, and cleanroom compatibility to capture demand from pharmaceutical, biotechnology, and semiconductor industries. Strategic initiatives include capacity expansions, product line diversification, and partnerships with automation and laboratory-integration technology providers. Competitors also invest in IoT-enabled monitoring, predictive maintenance capabilities, and user-centric interfaces to differentiate in high-performance segments. Additionally, suppliers target growth in Asia Pacific by offering competitively priced models without compromising reliability. As laboratory environments evolve toward higher throughput, tighter regulatory expectations, and advanced materials research, manufacturers increasingly focus on modular designs, enhanced safety controls, and custom configurations to strengthen their market positions.
Shape Your Report to Specific Countries or Regions & Enjoy 30% Off!
Key Player Analysis
Recent Developments
- In October 2024, Memmert GmbH forged a strategic partnership with Aralab to expand their presence in life-science and pharmaceutical stability markets in China and the U
Report Coverage
The research report offers an in-depth analysis based onOven type, Capacity, End-Use and Geography. It details leading market players, providing an overview of their business, product offerings, investments, revenue streams, and key applications. Additionally, the report includes insights into the competitive environment, SWOT analysis, current market trends, as well as the primary drivers and constraints. Furthermore, it discusses various factors that have driven market expansion in recent years. The report also explores market dynamics, regulatory scenarios, and technological advancements that are shaping the industry. It assesses the impact of external factors and global economic changes on market growth. Lastly, it provides strategic recommendations for new entrants and established companies to navigate the complexities of the market.
Future Outlook
- Demand for high-precision laboratory ovens will continue to expand as research workflows require tighter temperature control and improved thermal stability.
- Digitally connected ovens with remote monitoring, automated logging, and IoT-enabled diagnostics will gain widespread adoption.
- Cleanroom-compatible models will see increased use as semiconductor, nanotechnology, and pharmaceutical environments tighten contamination standards.
- Growth in bioprocessing, materials science, and advanced electronics will drive demand for application-specific convection and vacuum ovens.
- Energy-efficient heating designs and improved insulation technologies will become standard as laboratories prioritize sustainability.
- Manufacturers will integrate predictive maintenance and self-calibration features to enhance equipment reliability.
- Mid-range, compact ovens will gain traction in decentralized and small-scale laboratory setups with limited space.
- Large-capacity ovens will see stronger uptake in production laboratories and pilot-scale testing environments.
- Regulatory requirements for GMP/GLP compliance will increase demand for validated and traceable oven configurations.
- Emerging markets in Asia Pacific and the Middle East will drive new installation growth as research infrastructure modernizes.


