Market Overview
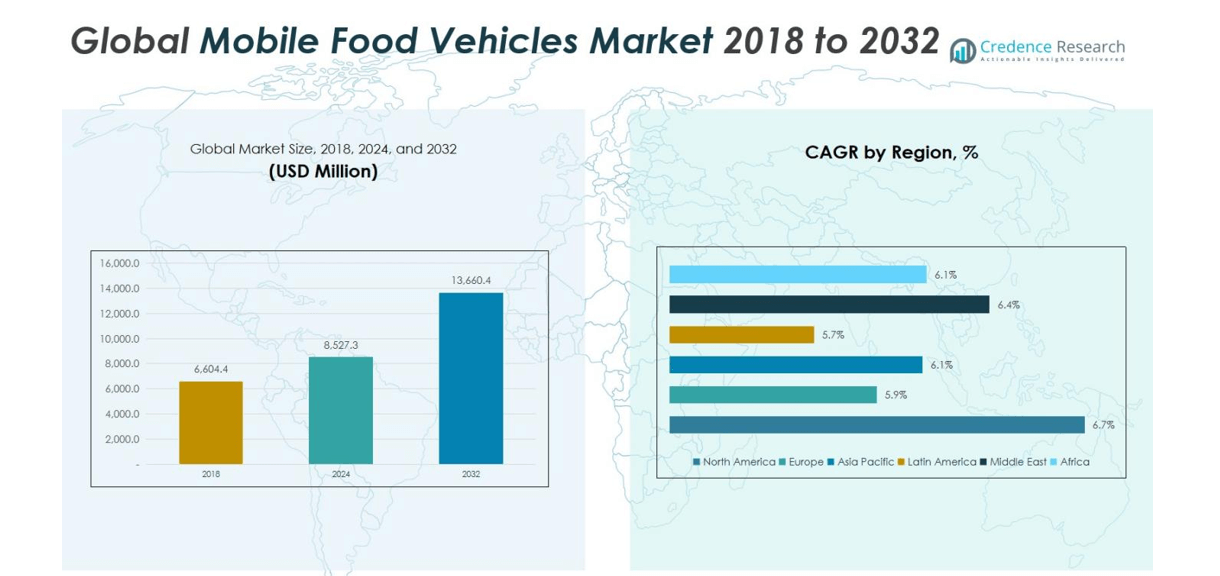
Mobile Food Vehicles Market size was valued at USD 6,604.4 Million in 2018, rising to USD 8,527.3 Million in 2024, and is anticipated to reach USD 13,660.4 Million by 2032, growing at a CAGR of 6.19% during the forecast period.
| REPORT ATTRIBUTE |
DETAILS |
| Historical Period |
2020-2023 |
| Base Year |
2024 |
| Forecast Period |
2025-2032 |
| Microfluidic Devices Market Size 2024 |
USD 8,527.3 Million |
| Microfluidic Devices Market, CAGR |
6.19% |
| Microfluidic Devices Market Size 2032 |
USD 13,660.4 Million |
The Mobile Food Vehicles Market is highly competitive, led by key players such as Prestige Food Trucks, United Food Truck, Veicoli Speciali, MSM Catering Trucks MFG. INC., and The Fud Trailer. These companies are driving growth through innovative vehicle designs, customized solutions, and expansion into emerging markets. They focus on enhancing operational efficiency, incorporating electric and hybrid vehicles, and offering modular kitchen setups to meet diverse consumer needs. Regionally, Asia Pacific leads the market with a 33% share, fueled by rapid urbanization, rising disposable incomes, and a growing street food culture in countries like China, India, and Japan. Europe follows with 28%, supported by urban food festivals and sustainable initiatives, while North America holds 21%, driven by strong food truck adoption and regulatory support. Collectively, these players and leading regions are shaping market dynamics and expanding mobile food vehicle adoption globally.
Market Insights
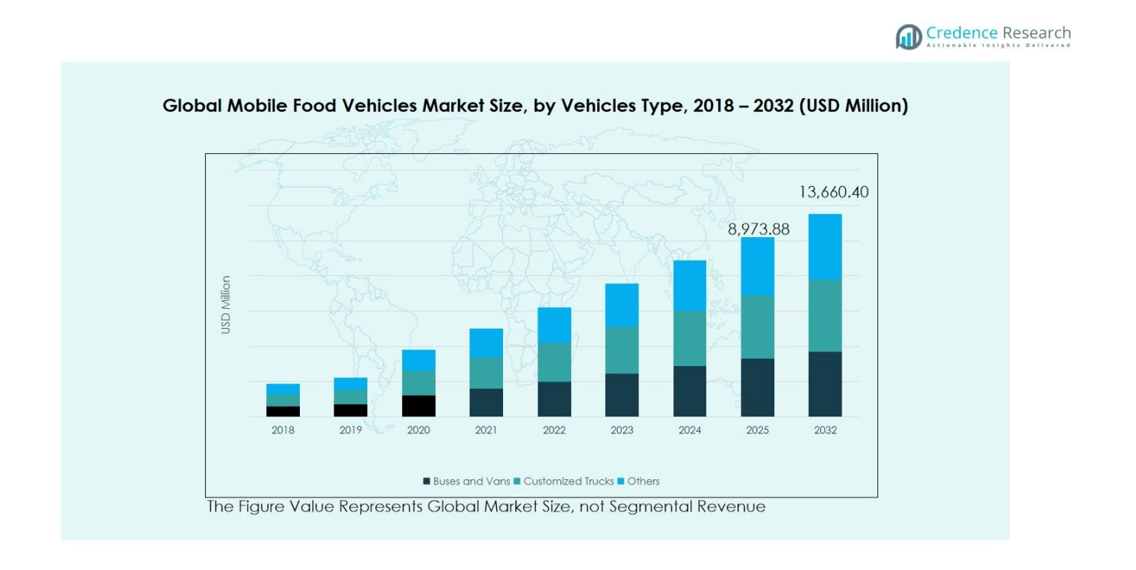
- The Mobile Food Vehicles Market was valued at USD 8,527.3 Million in 2024 and is projected to reach USD 13,660.4 Million by 2032, growing at a CAGR of 6.19%. Buses and Vans dominate the vehicle type segment with a 45% share, Diesel/Gasoline leads the power segment with 50%, and Fast Food holds 40% of the application segment.
- Rising urbanization and fast-paced lifestyles are driving demand for convenient, on-the-go dining, encouraging entrepreneurs and established food chains to expand mobile food fleets.
- Adoption of electric and hybrid vehicles, along with expansion of specialty and niche food offerings, are key market trends providing growth opportunities for operators and manufacturers.
- The market is competitive, with major players including Prestige Food Trucks, United Food Truck, Veicoli Speciali, MSM Catering Trucks MFG. INC., and The Fud Trailer focusing on innovation, modular designs, and regional expansion.
- Regionally, Asia Pacific leads with 33% share, Europe holds 28%, North America 21%, followed by Latin America 7%, Middle East 5%, and Africa 2.5%.
Access crucial information at unmatched prices!
Request your sample report today & start making informed decisions powered by Credence Research Inc.!
Download Sample
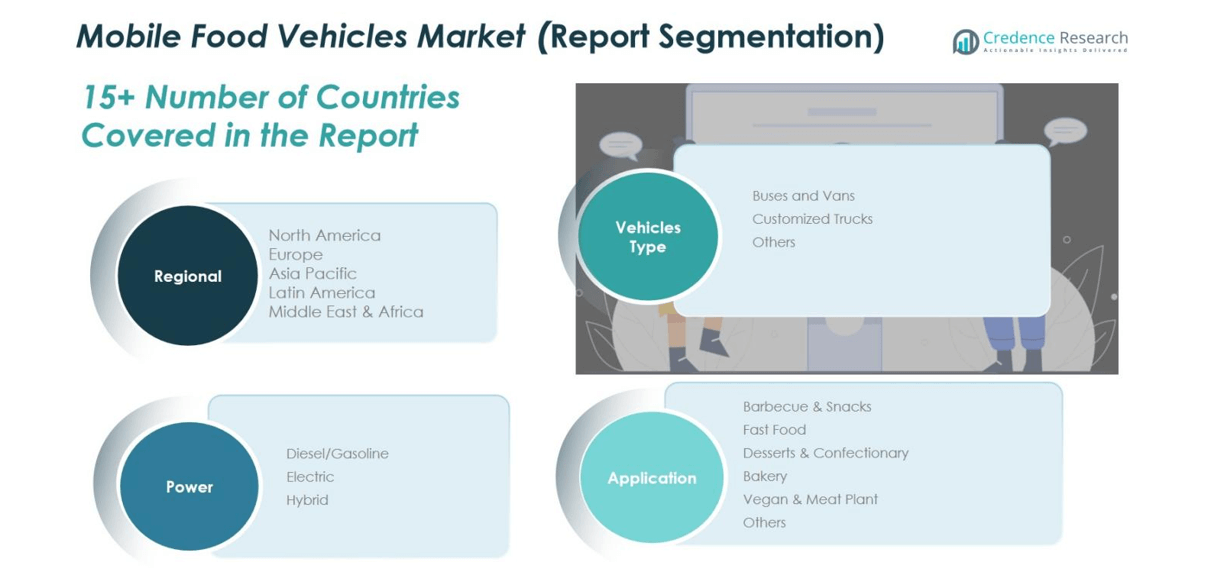
Market Segmentation Analysis:
By Vehicle Type:
Buses and Vans dominate the vehicle type segment, capturing approximately 45% of the market share. Their popularity stems from cost-efficiency, ease of customization, and suitability for urban food service operations. Customized Trucks follow closely, offering flexibility for specialized food setups and larger storage capacity, accounting for 35% of the segment share. The remaining 20% is contributed by other vehicle types, including trailers and small carts. Rising demand for on-the-go dining experiences and increasing adoption of mobile food businesses are driving growth across all vehicle types, with buses and vans leading due to lower initial investment and faster deployment.
By Power:
Diesel/Gasoline vehicles dominate this segment with a 50% share, owing to established infrastructure, reliable engine performance, and lower upfront costs compared to alternatives. Electric vehicles hold a 30% share, driven by increasing environmental regulations, government incentives, and a shift toward zero-emission solutions in urban centers. Hybrids account for the remaining 20%, benefiting from fuel efficiency and versatility. The segment growth is propelled by rising awareness of sustainability, regulatory pressure to reduce emissions, and expanding urban mobility, which encourages operators to adopt cleaner and more efficient mobile food vehicle options.
- For instance, in 2024, Ford’s Transit and Mercedes-Benz Sprinter vans remained top choices for mobile food operators due to their adaptability and service reliability across commercial fleets.
By Application:
Fast Food remains the dominant application, holding a 40% market share, due to high consumer demand for convenient meals and rapid service. Barbecue & Snacks and Desserts & Confectionery segments account for 20% and 15%, respectively, driven by niche consumer preferences and local culinary trends. Bakery and Vegan & Meat Plant applications collectively represent the remaining 25%, expanding as health-conscious and specialty diets gain traction. Growth is supported by urbanization, rising disposable incomes, and the increasing trend of food.
- For instance, Yum China expanded its barbecue-inspired “KFC Chuan” menu, catering to regional flavor profiles, while Baskin-Robbins introduced plant-based dessert lines to tap into healthier indulgence trends.
Key Growth Drivers
Rising Demand for On-the-Go Dining
Increasing urbanization and fast-paced lifestyles are driving the demand for convenient, ready-to-eat food options, propelling the growth of mobile food vehicles. Consumers prefer quick meals with minimal wait times, making food trucks and vans ideal solutions. This surge in demand encourages entrepreneurs and established food chains to expand their mobile fleets. The accessibility and flexibility of mobile food vehicles allow operators to reach multiple locations efficiently, fueling revenue growth and increasing market adoption across both urban and semi-urban regions.
- For instance, Starbucks launched its first mobile coffee truck pilot across several U.S. college campuses, allowing students to access beverages without visiting a café.
Low Capital Investment and Operational Flexibility
Mobile food vehicles require significantly lower initial investment compared to traditional brick-and-mortar restaurants, making them attractive for startups and small businesses. Their operational flexibility enables vendors to shift locations based on demand, events, and seasonal opportunities. This adaptability reduces fixed costs while maximizing revenue potential, encouraging rapid market entry. Additionally, mobile food vehicles can cater to targeted demographics and high-footfall areas, enhancing profitability. The combination of affordability and operational agility remains a major driver supporting continuous market expansion.
- For instance, HungryWheels’ Food Pods exemplify operational flexibility by allowing vendors to move locations easily to capitalize on high-foot-traffic and event-centric areas, thereby optimizing revenue.
Government Support and Regulatory Incentives
Governments across various regions are offering incentives such as permits, subsidies, and low-interest loans to promote entrepreneurship in the food truck industry. Supportive regulations for street food vending and eco-friendly vehicles are encouraging operators to adopt mobile food solutions. Such initiatives reduce bureaucratic barriers, enhance compliance, and promote sustainable business practices. Combined with growing urban food festivals and community events, these government-backed measures strengthen market confidence, stimulate investment, and accelerate the deployment of mobile food vehicles, fostering sustained industry growth.
Key Trends & Opportunities
Adoption of Electric and Hybrid Vehicles
The shift toward electric and hybrid mobile food vehicles is gaining momentum as operators seek to reduce fuel costs and comply with environmental regulations. Electric vehicles offer zero emissions and lower operating expenses, while hybrid solutions balance efficiency and performance. This trend presents opportunities for manufacturers to innovate and provide advanced powertrain solutions tailored for food trucks. With growing environmental awareness among consumers and cities implementing green initiatives, adopting electric and hybrid mobile food vehicles enhances brand reputation and market competitiveness.
- For instance, Toyota Australia introduced the FCV Express Diner, a hydrogen-powered food truck equipped with induction cooktops and an oven powered by fuel cells, showcasing a zero-emission mobile kitchen solution.
Expansion of Niche and Specialty Food Offerings
Consumers increasingly seek unique culinary experiences, creating opportunities for mobile food vendors to offer specialized menus such as vegan, organic, or gourmet options. Food trucks provide a cost-effective platform to test new concepts and reach targeted audiences without committing to permanent locations. This trend allows brands to differentiate themselves, build loyal customer bases, and capitalize on evolving taste preferences. The growing popularity of food festivals and pop-up events further amplifies demand, creating a favorable environment for innovative mobile food services to flourish.
- For instance, Sushi trucks providing fresh sushi rolls, sashimi, and nigiri with innovative ingredients such as tempura shrimp and mango, appealing to sophisticated tastes.
Key Challenges
High Maintenance and Operational Costs
Despite lower initial investment, mobile food vehicles face significant operational challenges, including maintenance, fuel costs, and frequent repairs. Engine wear, refrigeration systems, and kitchen equipment require regular upkeep to ensure compliance with health and safety standards. Unexpected downtime can lead to revenue loss and operational disruption. Additionally, fluctuating fuel prices and the need for specialized staff increase operating expenses. These cost pressures can impact profitability and deter smaller operators from scaling their mobile food ventures efficiently.
Stringent Regulatory and Licensing Requirements
Navigating complex regulations and obtaining necessary permits pose challenges for mobile food vehicle operators. Different cities and regions impose varying standards on health, safety, parking, and emissions compliance. Failure to meet these requirements can result in fines, license revocation, or operational restrictions. The complexity of adhering to multiple jurisdictional rules limits expansion and may discourage new entrants. Operators must invest time and resources to ensure full regulatory compliance while balancing operational efficiency, making this a persistent challenge in the market.
Regional Analysis
North America
North America held a significant position in the Mobile Food Vehicles Market, with a market size of USD 1,431.17 Million in 2018. The region accounted for approximately 21% of the global market share, driven by the U.S. and Canada’s urbanization and high consumer spending on convenient dining options. By 2024, the market is expected to reach USD 1,903.77 Million and expand to USD 3,169.21 Million by 2032, growing at a CAGR of 6.7%. Growth is supported by a robust food truck culture, increasing adoption of eco-friendly vehicles, and a strong regulatory framework for street food operations.
Europe
Europe recorded a market size of USD 1,886.21 Million in 2018, capturing nearly 28% of the global market share. The market growth is driven by urban food festivals, rising disposable incomes, and adoption of mobile food solutions across key countries such as the UK, Germany, and France. The region is projected to reach USD 2,403.23 Million by 2024 and USD 3,781.20 Million by 2032, expanding at a CAGR of 5.9%. Sustainability initiatives, growing consumer preference for specialty cuisines, and government support for mobile vending significantly contribute to market expansion.
Asia Pacific
Asia Pacific led the market in early adoption with a size of USD 2,252.75 Million in 2018, holding around 33% of the global share. Rapid urbanization, rising disposable incomes, and a growing food culture in countries like China, India, and Japan drive demand. By 2024, the market is expected to reach USD 2,896.59 Million, expanding to USD 4,614.48 Million by 2032, at a CAGR of 6.1%. Increasing street food culture, government incentives for small businesses, and rising awareness of mobile food vehicle efficiency further bolster growth across the region.
Latin America
Latin America’s market stood at USD 483.44 Million in 2018, representing approximately 7% of the global market share. Growth is fueled by the popularity of street food, expanding urbanization, and rising entrepreneurial ventures in Brazil and Argentina. By 2024, the market is anticipated to reach USD 608.48 Million, and by 2032, USD 941.20 Million, growing at a CAGR of 5.7%. The increasing adoption of mobile food solutions for both fast food and traditional cuisines, combined with supportive government regulations, drives steady expansion in the region.
Middle East
The Middle East mobile food vehicles market was valued at USD 381.73 Million in 2018, accounting for roughly 5% of the global market share. Growth is propelled by rising urbanization, tourism, and demand for quick-service food in GCC countries, Israel, and Turkey. The market is expected to reach USD 497.63 Million by 2024 and expand to USD 807.33 Million by 2032, growing at a CAGR of 6.4%. Increasing adoption of modern food trucks, disposable income growth, and government initiatives supporting small-scale food enterprises drive the market forward.
Africa
Africa recorded a market size of USD 169.07 Million in 2018, capturing about 2.5% of the global market share. The market is growing steadily, driven by urban food culture, expanding food festivals, and increasing entrepreneurship in countries like South Africa and Egypt. By 2024, the market is projected to reach USD 217.57 Million, growing to USD 346.97 Million by 2032, at a CAGR of 6.1%. Rising consumer demand for convenient and diverse food options, coupled with expanding regulatory frameworks for mobile vendors, supports growth across the region.
Market Segmentations:
By Vehicle Type:
- Buses and Vans
- Customized Trucks
- Others
By Power:
- Diesel/Gasoline
- Electric
- Hybrid
By Application:
- Barbecue & Snacks
- Fast Food
- Desserts & Confectionery
- Bakery
- Vegan & Meat Plant
- Others
By Region
- North America
- Europe
- Germany
- France
- U.K.
- Italy
- Spain
- Rest of Europe
- Asia Pacific
- China
- Japan
- India
- South Korea
- South-east Asia
- Rest of Asia Pacific
- Latin America
- Brazil
- Argentina
- Rest of Latin America
- Middle East & Africa
- GCC Countries
- South Africa
- Rest of the Middle East and Africa
Competitive Landscape
The competitive landscape of the Mobile Food Vehicles Market is dominated by key players such as Prestige Food Trucks, United Food Truck, Veicoli Speciali, MSM Catering Trucks MFG. INC., and The Fud Trailer. These companies lead through product innovation, customized vehicle solutions, and expanding service networks to meet rising consumer demand for mobile food services. Market players are focusing on electric and hybrid vehicle offerings to address environmental regulations and reduce operational costs, while enhancing the flexibility and efficiency of their fleets. Strategic partnerships, mergers, and regional expansions are common approaches to strengthen market presence. The competition also emphasizes high-quality kitchen equipment, modular designs, and after-sales support, which differentiate offerings in a fragmented market. Overall, companies are leveraging technology, sustainability, and operational agility to capture a larger market share, meet urban mobility demands, and address evolving consumer preferences across diverse applications and regions globally.
Shape Your Report to Specific Countries or Regions & Enjoy 30% Off!
Key Player Analysis
- Prestige Food Trucks
- United Food Truck
- Veicoli Speciali
- MSM Catering Trucks MFG. INC.
- The Fud Trailer
- Food Truck Company
- Bostonian Body, Inc
- MK Mallick Engineering Construction
- Saltrino
- Lacomma Food Truck
- Other Key Players
Recent Developments
- In June 2023, Shore Capital Partners LLC, a Chicago-based private equity firm, announced a strategic partnership with Roaming Hunger Inc., a leading food truck booking service, to support food truck owners and pop-up operators with new revenue opportunities.
- In April 2023, Toyota Australia launched the FCV Express Diner, a hydrogen fuel-cell powered food truck concept equipped with induction cooktops, oven, fridge/freezer, and hot/cold water all powered by its fuel cell; designed for mobile food service and as a mobile generator.
- In August 2025, Hormel Foods Corporation (via its SPAM® brand) rolled out the “SPAM Musubi Mobile” food truck shaped like a SPAM® product in Southern California as part of a promotional campaign accompanying its nationwide sushi product launch at Kroger Family Stores
Report Coverage
The research report offers an in-depth analysis based on Vehicle Type, Power, Application and Region. It details leading market players, providing an overview of their business, product offerings, investments, revenue streams, and key applications. Additionally, the report includes insights into the competitive environment, SWOT analysis, current market trends, as well as the primary drivers and constraints. Furthermore, it discusses various factors that have driven market expansion in recent years. The report also explores market dynamics, regulatory scenarios, and technological advancements that are shaping the industry. It assesses the impact of external factors and global economic changes on market growth. Lastly, it provides strategic recommendations for new entrants and established companies to navigate the complexities of the market.
Future Outlook
- The Mobile Food Vehicles Market is expected to grow steadily, driven by rising urbanization and fast-paced lifestyles.
- Increasing consumer demand for convenient, on-the-go dining will fuel market expansion globally.
- Adoption of electric and hybrid vehicles will gain momentum due to environmental regulations and sustainability trends.
- Entrepreneurs and small businesses will increasingly prefer mobile food vehicles for low-capital, flexible operations.
- Expansion of specialty and niche food offerings will create new growth opportunities in diverse culinary segments.
- Government incentives and regulatory support will encourage the deployment of mobile food solutions in urban areas.
- Rising popularity of food festivals, events, and street food culture will boost regional market penetration.
- Technological integration, including smart kitchen equipment and mobile apps, will enhance operational efficiency.
- Strategic partnerships, mergers, and collaborations among key players will strengthen market competitiveness.
- The market will continue to innovate with modular designs, sustainable materials, and improved customer experience.


