Market Overview
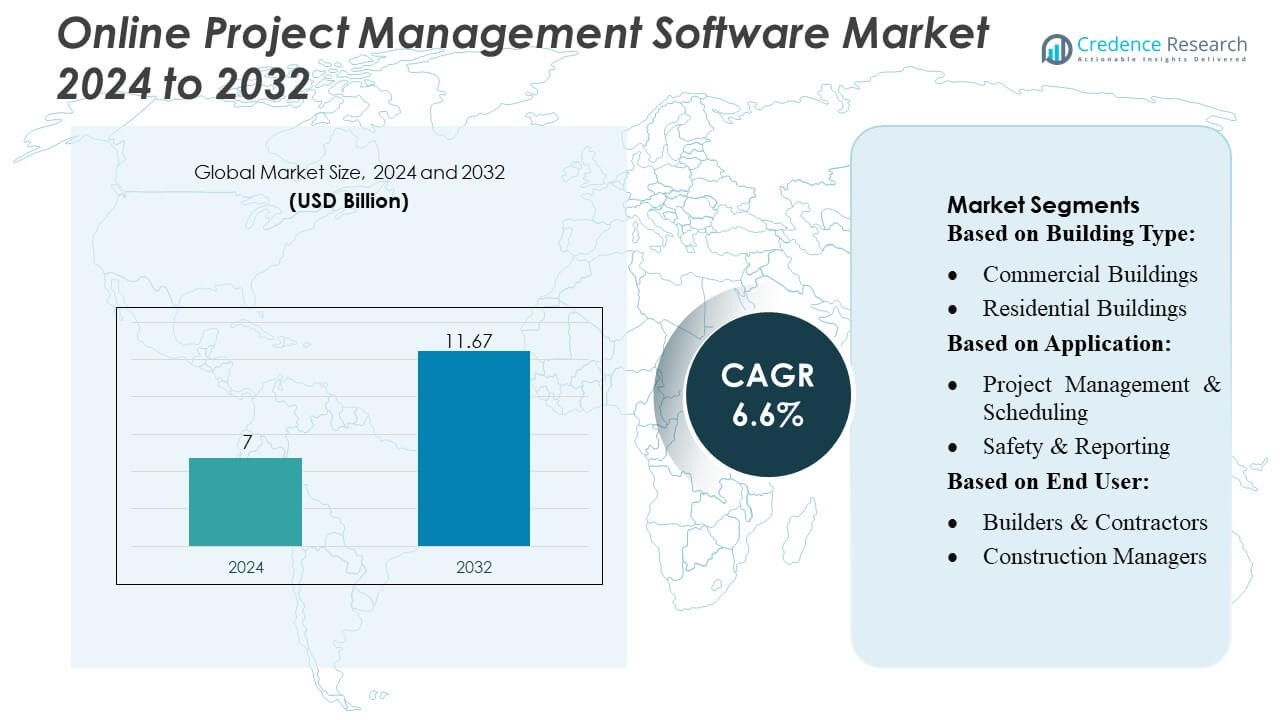
Online Project Management Software Market size was valued USD 7 billion in 2024 and is anticipated to reach USD 11.67 billion by 2032, at a CAGR of 6.6% during the forecast period.
| REPORT ATTRIBUTE |
DETAILS |
| Historical Period |
2020-2023 |
| Base Year |
2024 |
| Forecast Period |
2025-2032 |
| Online Project Management Software Market Size 2024 |
USD 7 Billion |
| Online Project Management Software Market, CAGR |
6.6% |
| Online Project Management Software Market Size 2032 |
USD 11.67 Billion |
The Online Project Management Software Market is highly competitive, with key players including Planisware, Adobe Inc., Zoho Corporation Pvt. Ltd., Broadcom Inc., Microsoft Corporation, Plainview, Inc., SAP SE, ServiceNow, Atlassian Corporation Plc, and Oracle Corporation. These companies focus on continuous innovation, cloud-based solutions, AI integration, and enhanced collaboration features to strengthen their market presence. North America leads the market, holding approximately 38% of the global share, driven by advanced construction technologies, high adoption of digital solutions, and large-scale commercial and residential projects. The region’s demand is fueled by enterprises prioritizing real-time project tracking, cost optimization, and workflow efficiency. Strong regulatory standards and widespread use of mobile-accessible and cloud-enabled platforms further reinforce North America’s dominance, while leading players leverage technological advancements and strategic partnerships to capture market opportunities and expand their footprint globally.
Access crucial information at unmatched prices!
Request your sample report today & start making informed decisions powered by Credence Research Inc.!
Download Sample
Market Insights
- The Online Project Management Software Market size was valued at USD 7 billion in 2024 and is projected to reach USD 11.67 billion by 2032, growing at a CAGR of 6.6% during the forecast period.
- Market growth is driven by increasing adoption of cloud-based and mobile-accessible platforms, rising demand for real-time project tracking, and the need for cost and resource optimization across commercial and residential construction projects.
- Key trends include integration with AI, predictive analytics, BIM, and ERP systems, along with the use of IoT-enabled devices for enhanced workflow monitoring and automation.
- The market is highly competitive, with leading players such as Planisware, Adobe, Zoho, Broadcom, Microsoft, SAP, ServiceNow, Atlassian, Oracle, and Plainview focusing on innovation, cloud solutions, and strategic partnerships to expand their global presence.
- North America leads the market with a 38% share, followed by Europe and Asia-Pacific, while project management and scheduling represent the dominant application segment driving software adoption.
Market Segmentation Analysis:
By Building Type
The commercial buildings segment dominates the Online Project Management Software Market, accounting for approximately 62% of the market share. Demand is driven by large-scale infrastructure projects, corporate offices, and retail complexes that require advanced project scheduling, resource allocation, and real-time collaboration. Enterprises prioritize software solutions that streamline multi-department coordination, enhance productivity, and ensure timely project delivery. Residential buildings, while growing steadily, rely more on cost-effective and simplified project management tools. The increasing adoption of cloud-based platforms and mobile accessibility further fuels software implementation across commercial construction projects.
- For instance, Planisware supports 9,000 projects managed by 6,000 users, enabling real-time portfolio oversight and improved project throughput compared to legacy systems. Globally, the company serves over 600 clients with more than 800,000 users across its platforms.
By Application
Project Management & Scheduling emerges as the leading application, representing nearly 55% of market share. The dominance is fueled by the need for efficient task allocation, timeline tracking, and milestone management across complex construction projects. Safety & Reporting and Cost Accounting are also gaining traction, driven by regulatory compliance requirements and the necessity to monitor budgets in real time. The shift towards digital transformation in construction workflows, integration with BIM (Building Information Modeling) tools, and real-time analytics strengthens the adoption of these applications. Field Service Management is rapidly expanding with mobile-first solutions.
- For instance, Zoho reports that as of early 2025, the company serves over 900,000 customers globally with more than 120 million users — underlining the scale and adoption of its project‑management suite.
By End-User
Builders & Contractors hold the largest share, around 50%, leveraging online project management software to coordinate labor, materials, and subcontractors effectively. Construction Managers follow closely, using software for scheduling, compliance, and performance tracking. Engineers & Architects, although smaller in share, increasingly adopt platforms for project design integration and collaboration. Market growth is driven by the demand for improved operational efficiency, reduction of project delays, and enhanced transparency in resource management. The trend toward cloud-based collaboration tools and mobile-friendly interfaces further boosts adoption among all end-user categories.
Key Growth Drivers
- Increasing Construction Project Complexity:
The rising complexity of construction projects drives the demand for online project management software. Multi-location projects, diverse contractor networks, and intricate workflows require centralized tools for scheduling, task allocation, and resource optimization. Software solutions enable real-time collaboration, milestone tracking, and automated reporting, reducing delays and cost overruns. Additionally, integration with digital tools such as BIM (Building Information Modeling) enhances planning efficiency. The need for streamlined coordination across stakeholders in both commercial and residential projects continues to fuel software adoption globally.
- For instance, Broadcom announced its third-generation 200G-per-lane Co-Packaged Optics (CPO) product line — a leap from its earlier 100G-per-lane CPO. This announcement followed demonstrations and progress shared earlier at the Optical Fiber Communications Conference (OFC 2025) in March.
- Cloud-Based and Mobile Accessibility:
The adoption of cloud-based platforms and mobile-friendly project management tools significantly contributes to market growth. Cloud solutions provide secure, real-time access to project data, enabling teams to collaborate remotely and manage resources efficiently. Mobile applications allow on-site personnel to update progress, submit reports, and track schedules instantly. This flexibility enhances decision-making speed, reduces miscommunication, and supports remote project monitoring. Increasing smartphone penetration and enterprise mobility initiatives across the construction sector further reinforce the preference for online project management software.
- For instance, New Relic added over 20 new capabilities to its Intelligent Observability Platform. The platform now supports 780+ integrations and offers “unlimited scale” in telemetry ingest.
- Focus on Cost and Time Efficiency:
Cost control and timely project completion are critical drivers for adopting online project management software. These platforms offer features such as budget tracking, automated reporting, and resource allocation analytics, helping reduce inefficiencies and avoid cost overruns. By streamlining workflows, project managers can prevent delays, optimize labor, and enhance productivity. Increasing pressure on contractors and builders to deliver projects within stipulated budgets and deadlines drives widespread adoption. Enhanced visibility into project status and performance metrics also strengthens accountability across all stakeholders.
Key Trends & Opportunities
- Integration with BIM and IoT Technologies:
Integration of project management software with Building Information Modeling (BIM) and IoT devices is emerging as a key trend. This enables real-time monitoring of construction progress, predictive maintenance, and automated reporting, improving decision-making and reducing errors. IoT-connected sensors provide data on equipment usage, material consumption, and site safety, which can be managed within the software. These capabilities create opportunities for enhanced operational efficiency and reduced resource wastage, positioning software providers to capture demand from technologically advanced construction firms.
- For instance, Microsoft’s 2025 Environmental Sustainability Report highlights how its platform manages high volumes of sustainability data records daily through Microsoft Sustainability Manager, which automates Scope 1, 2, and 3 emission calculations aligned with GHG Protocol standards.
- Adoption of AI and Analytics Tools:
Artificial intelligence and analytics are increasingly being incorporated into project management software to optimize workflows. Predictive analytics helps forecast project risks, schedule delays, and cost overruns, while AI-powered automation streamlines repetitive tasks. Machine learning algorithms analyze historical project data to recommend resource allocation and workflow improvements. This trend presents opportunities for providers to offer value-added solutions, attracting enterprises focused on data-driven decision-making and efficiency improvements in construction project execution.
- For instance, Mack Trucks has surpassed a milestone of 200,000 Class 8 trucks built with its proprietary telematics gateway since 2014. This confirms the active truck figure cited.
- Expansion in Emerging Markets:
Emerging markets in Asia-Pacific, Latin America, and the Middle East present significant growth opportunities due to rapid urbanization and infrastructure development. Rising construction investments, government initiatives, and adoption of digital solutions by SMEs encourage online project management software deployment. Providers can capitalize on these markets by offering scalable, cost-effective, and localized solutions. Increasing awareness of productivity and efficiency benefits in these regions further drives adoption, enabling market expansion beyond traditional developed markets.
Key Challenges
- Data Security and Privacy Concerns:
Data security and privacy remain critical challenges for online project management software adoption. Construction projects involve sensitive information, including contracts, financial data, and intellectual property, making software platforms potential targets for cyberattacks. Ensuring secure cloud storage, encrypted communication, and compliance with regional data protection regulations is complex. Small and medium-sized contractors often lack resources to implement robust security measures, limiting adoption. Providers must continually enhance cybersecurity protocols to maintain client trust and safeguard project information.
- Resistance to Digital Adoption:
Resistance from traditional construction teams poses a challenge to market growth. Many stakeholders, including contractors, on-site supervisors, and subcontractors, are accustomed to manual processes and paper-based documentation. The learning curve, reluctance to change, and lack of technical skills can hinder software implementation. Training programs, user-friendly interfaces, and mobile accessibility are essential to overcoming adoption barriers. Until digital transformation becomes widespread across all tiers of the construction industry, resistance may slow penetration in certain regions and project segments.
Regional Analysis
North America
North America leads the Online Project Management Software Market, accounting for approximately 38% of the global market share. The region’s dominance is driven by advanced construction technologies, high adoption of cloud-based solutions, and significant investments in commercial and residential infrastructure projects. The presence of major software providers and tech-savvy construction firms further fuels growth. Demand is particularly strong in the United States and Canada, where builders and contractors prioritize real-time collaboration, project scheduling, and cost optimization. Regulatory compliance and focus on safety reporting also enhance software adoption across large-scale projects, solidifying North America’s market leadership.
Europe
Europe holds around 27% of the global Online Project Management Software Market, supported by the adoption of digital construction technologies and stringent regulatory standards. Countries like Germany, the UK, and France are investing in smart infrastructure, urban development, and sustainable building practices, increasing demand for project management solutions. Integration with BIM and ERP systems enhances workflow efficiency and collaboration among architects, engineers, and contractors. Cloud-based and mobile solutions are particularly favored for on-site project monitoring. The emphasis on cost control, timely project delivery, and environmental compliance continues to drive adoption across commercial and residential construction segments in the region.
Asia-Pacific
Asia-Pacific is rapidly emerging as a key growth region, accounting for approximately 25% of the market share. Strong urbanization, industrialization, and government infrastructure initiatives in countries like China, India, Japan, and Australia fuel the adoption of online project management software. Builders and contractors increasingly rely on cloud-based platforms for project scheduling, field service management, and cost accounting. Mobile accessibility and integration with IoT-enabled construction tools provide real-time data insights. The region presents significant opportunities due to large-scale residential and commercial projects, increasing foreign investments, and rising awareness of digital efficiency solutions among construction professionals.
Latin America
Latin America represents around 6% of the global market share, with growth driven by infrastructure development, urban expansion, and modernization projects in countries such as Brazil, Mexico, and Chile. Adoption of online project management software is gradually increasing, as construction firms seek improved project tracking, collaboration, and cost efficiency. Cloud-based solutions are gaining traction due to their flexibility and scalability, allowing small and medium-sized enterprises to manage projects effectively. The growing demand for efficient workflow management, regulatory compliance, and timely project completion presents opportunities for software providers in the region, despite slower digital adoption compared to North America and Europe.
Middle East & Africa
The Middle East & Africa accounts for approximately 4% of the global market share, driven by large-scale infrastructure, commercial, and residential projects in countries like the UAE, Saudi Arabia, and South Africa. Investments in smart city projects, industrial parks, and transportation networks increase the demand for efficient project management solutions. Cloud-based and mobile platforms are preferred to facilitate real-time collaboration, safety reporting, and cost tracking. While adoption is limited by traditional practices in some areas, growing government initiatives and rising awareness of digital construction tools create opportunities for software providers to expand their footprint in the region.
Market Segmentations:
By Building Type:
- Commercial Buildings
- Residential Buildings
By Application:
- Project Management & Scheduling
- Safety & Reporting
By End User:
- Builders & Contractors
- Construction Managers
By Geography
- North America
- Europe
- Germany
- France
- U.K.
- Italy
- Spain
- Rest of Europe
- Asia Pacific
- China
- Japan
- India
- South Korea
- South-east Asia
- Rest of Asia Pacific
- Latin America
- Brazil
- Argentina
- Rest of Latin America
- Middle East & Africa
- GCC Countries
- South Africa
- Rest of the Middle East and Africa
Competitive Landscape
The Online Project Management Software Market include Planisware, Adobe Inc., Zoho Corporation Pvt. Ltd., Broadcom Inc., Microsoft Corporation, Plainview, Inc., SAP SE, ServiceNow, Atlassian Corporation Plc, and Oracle Corporation. The Online Project Management Software Market is highly competitive, driven by continuous innovation in cloud-based, mobile-accessible, and AI-enabled solutions. Companies focus on enhancing user experience, improving real-time collaboration, and integrating project management tools with BIM, ERP, and analytics platforms. Market differentiation is achieved through scalability, security, and specialized features for construction, commercial, and residential projects. Strategic initiatives such as mergers, acquisitions, and partnerships are common to expand global reach and technological capabilities. Intense competition pushes providers to offer value-added services, advanced reporting, and predictive project management tools, addressing the growing demand for efficiency, cost optimization, and timely project delivery across diverse construction segments worldwide.
Shape Your Report to Specific Countries or Regions & Enjoy 30% Off!
Key Player Analysis
- Planisware
- Adobe Inc.
- Zoho Corporation Pvt. Ltd.
- Broadcom Inc.
- Microsoft Corporation
- Plainview, Inc.
- SAP SE
- ServiceNow
- Atlassian Corporation Plc
- Oracle Corporation
Recent Developments
- In April 2025, Planisware and ClearPlan Consulting announced a strategic partnership to strengthen support for the Aerospace and Defense (A&D) industry, not IT & Telecom.
- In February 2025, Oracle enhanced its supply chain management platform by integrating AI capabilities. This update enables the automation of various tasks for procurement professionals, such as generating standardized product descriptions and providing supplier recommendations, which can significantly streamline procurement processes.
- In January 2025, Block, a technology, announced the launch of Goose, an open-source AI agent designed to empower developers with customizable tools. Goose allows users to leverage various large language models, providing flexibility in its application across different tasks and industries.
- In November 2024, Microsoft unveiled cloud-connected software that enables customers to deploy Azure computing, networking, storage, and application services across various environments, including edge locations, on-premises data centers, and hybrid cloud setups.
Report Coverage
The research report offers an in-depth analysis based on Building Type, Application, End-User and Geography. It details leading market players, providing an overview of their business, product offerings, investments, revenue streams, and key applications. Additionally, the report includes insights into the competitive environment, SWOT analysis, current market trends, as well as the primary drivers and constraints. Furthermore, it discusses various factors that have driven market expansion in recent years. The report also explores market dynamics, regulatory scenarios, and technological advancements that are shaping the industry. It assesses the impact of external factors and global economic changes on market growth. Lastly, it provides strategic recommendations for new entrants and established companies to navigate the complexities of the market.
Future Outlook
- Adoption of cloud-based and mobile-accessible platforms will continue to expand across construction and engineering projects.
- Integration with AI and predictive analytics will enhance project planning and risk management.
- Increasing use of IoT and smart sensors will improve real-time monitoring of resources and site conditions.
- Demand for software that integrates seamlessly with BIM and ERP systems will grow.
- Focus on cost optimization and efficient resource allocation will drive wider adoption.
- Remote collaboration tools will become standard for multi-location project teams.
- Small and medium-sized construction firms will increasingly invest in scalable project management solutions.
- Enhanced cybersecurity features will be prioritized to protect sensitive project data.
- Cloud-based reporting and automated documentation will reduce administrative workloads.
- Expansion in emerging markets will contribute significantly to overall market growth.


