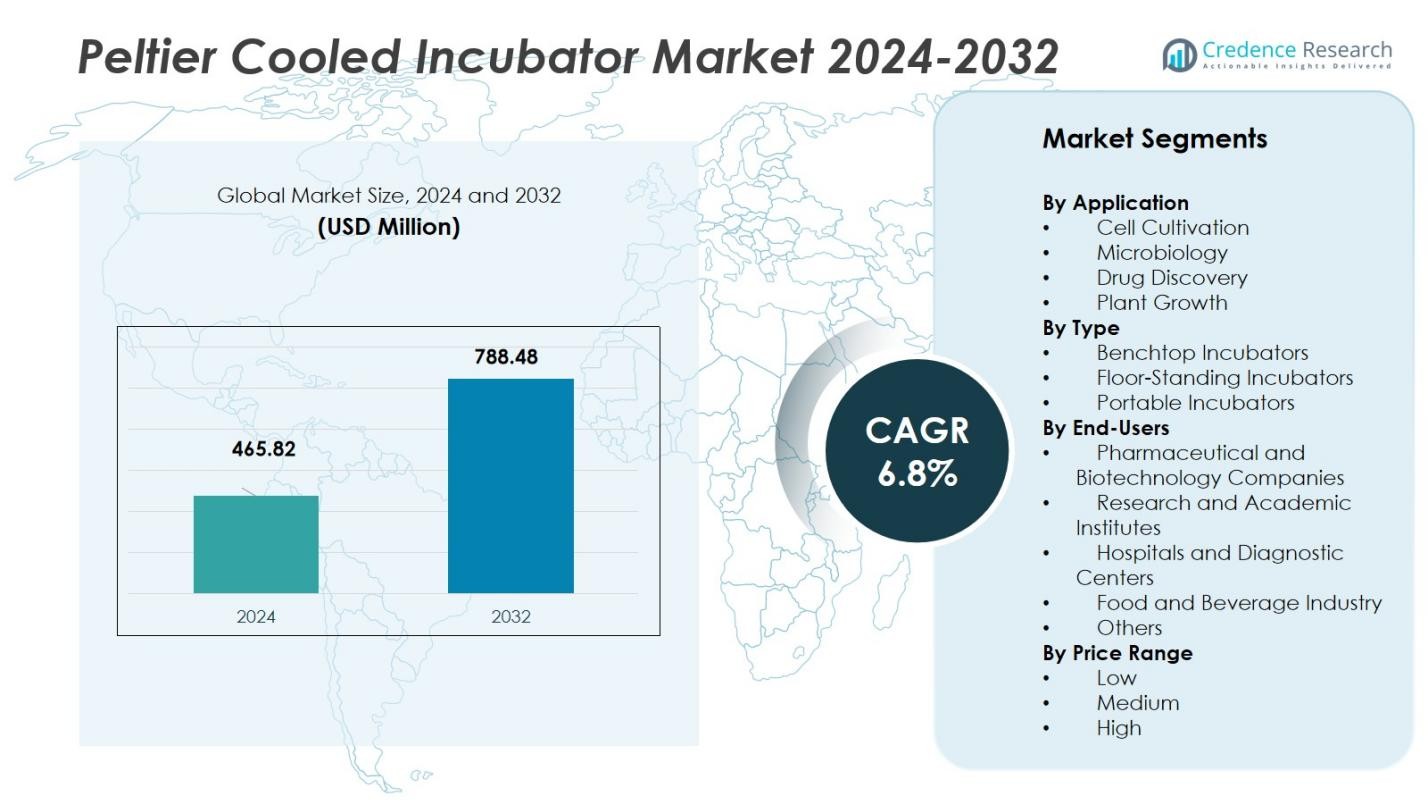
CHAPTER NO. 1 : INTRODUCTION 34
1.1. Report Description 34
1.1.1. Purpose of the Report 34
1.1.2. USP & Key Offerings 34
1.1.3. Key Benefits for Stakeholders 34
1.2. Target Audience 35
1.3. Report Scope 36
CHAPTER NO. 2 : EXECUTIVE SUMMARY 38
2.1. Peltier Cooled Incubator Market Snapshot 38
2.2. Global Peltier Cooled Incubator Market, 2017 – 2022 (K Units) (USD Million) 40
2.1. Insights from Primary Respondents 40
CHAPTER NO. 3 : IMPACT ANALYSIS OF COVID 19 & RUSSIA-UKRAINE WAR ON PELTIER COOLED INCUBATOR MARKET 41
3.1. Impact Assessment of COVID-19 Pandemic, By Region 41
3.1.1. Supply chain disruptions 41
3.1.2. Demand fluctuations 41
3.1.3. Shift in product mix 41
3.1.4. Reduced industrial activity 41
3.1.5. Temporary disruptions and delays 41
3.1.6. Shift in focus towards essential services 41
3.2. Russia-Ukraine War Impacts 42
3.2.1. Uncertainty and economic instability 42
3.2.2. Supply chain disruptions 42
3.2.3. Regional market shifts 42
3.2.4. Shift in government priorities 42
CHAPTER NO. 4 : PELTIER COOLED INCUBATOR MARKET – INDUSTRY ANALYSIS 43
4.1. Introduction 43
4.2. Market Drivers 44
4.2.1. Driving Factor 1 Analysis 44
4.2.2. Driving Factor 2 Analysis 45
4.3. Market Restraints 46
4.3.1. Restraining Factor Analysis 46
4.4. Market Opportunities 47
4.4.1. Market Opportunity Analysis 47
4.5. Porter’s Five Forces Analysis 48
4.6. Value Chain Analysis 49
4.7. Buying Criteria 50
CHAPTER NO. 5 : IMPORT EXPORT ANALYSIS 51
5.1. Import Analysis by Region 51
5.1.1. Global Peltier Cooled Incubator Market Import Volume/Revenue, By Region, 2017 – 2022 51
5.2. Export Analysis by Region 52
5.2.1. Global Peltier Cooled Incubator Market Export Volume/Revenue, By Region, 2017 – 2022 52
CHAPTER NO. 6 : DEMAND SUPPLY ANALYSIS 53
6.1. Demand Analysis by Region 53
6.1.1. Global Peltier Cooled Incubator Market Demand Volume/Revenue, By Region, 2017 – 2022 53
6.2. Supply Analysis by Region 54
6.2.1. Global Peltier Cooled Incubator Market Supply Volume/Revenue, By Region, 2017 – 2022 54
CHAPTER NO. 7 : PRODUCTION ANALYSIS 55
7.1. Production Analysis by Region 55
7.1.1. Global Peltier Cooled Incubator Market Production, By Region, 2017 – 2022 55
7.1.2. Global Peltier Cooled Incubator Market Production Volume, By Region, 2017 – 2022 (K Units) 55
CHAPTER NO. 8 : PRICE ANALYSIS 56
8.1. Price Analysis by Region 56
8.1.1. Global Peltier Cooled Incubator Market Price, By Region, 2017 – 2022 56
8.1.2. Global Type Market Price, By Region, 2017 – 2022 56
8.2. Price Analysis by Type 57
8.2.1. Global Peltier Cooled Incubator Market Price, By Type, 2017 – 2022 57
8.2.2. Global Type Market Price, By Type, 2017 – 2022 57
CHAPTER NO. 9 : RAW MATERIALS ANALYSIS 58
9.1. Key Raw Materials and Suppliers 58
9.2. Key Raw Materials Price Trend 58
CHAPTER NO. 10 : MANUFACTURING COST ANALYSIS 59
10.1. Manufacturing Cost Analysis 59
10.1.1. Manufacturing Cost Analysis 59
10.2. Manufacturing Process 59
10.2.1. Manufacturing Process 59
CHAPTER NO. 11 : ANALYSIS COMPETITIVE LANDSCAPE 60
11.1. Company Market Share Analysis – 2022 60
11.1.1. Global Peltier Cooled Incubator Market: Company Market Share, by Volume, 2022 60
11.1.2. Global Peltier Cooled Incubator Market: Company Market Share, by Revenue2022 61
11.1.3. Global Peltier Cooled Incubator Market: Top 6 Company Market Share, by Revenue2022 61
11.1.4. Global Peltier Cooled Incubator Market: Top 3 Company Market Share, by Revenue2022 62
11.1. Global Peltier Cooled Incubator Market Company Volume Market Share, 2022 63
11.2. Global Peltier Cooled Incubator Market Company Revenue Market Share, 2022 64
11.3. Company Assessment Metrics, 2022 65
11.3.1. Stars 65
11.3.2. Emerging Leaders 65
11.3.3. Pervasive Players 65
11.3.4. Participants 65
11.4. Strategic Developments 66
11.4.1. Acquisitions & Mergers 66
11.4.2. New Product Launch 66
11.4.3. Regional Expansion 66
11.5. Key Players Product Matrix 67
CHAPTER NO. 12 : PESTEL & ADJACENT MARKET ANALYSIS 68
12.1. PESTEL 68
12.1.1. Political Factors 68
12.1.2. Economic Factors 68
12.1.3. Social Factors 68
12.1.4. Technological Factors 68
12.1.5. Environmental Factors 68
12.1.6. Legal Factors 68
12.2. Adjacent Market Analysis 68
CHAPTER NO. 13 : PELTIER COOLED INCUBATOR MARKET – BY TYPE SEGMENT ANALYSIS 69
13.1. Peltier Cooled Incubator Market Overview, by Type Segment 69
13.1.1. Peltier Cooled Incubator Market Volume Share, By Type, 2022 & 2030 70
13.1.2. Peltier Cooled Incubator Market Revenue Share, By Type, 2022 & 2030 70
13.1.3. Peltier Cooled Incubator Market Attractiveness Analysis, By Type 71
13.1.4. Incremental Revenue Growth Opportunity, by Type, 2023 – 2030 71
13.1.5. Peltier Cooled Incubator Market Revenue, By Type, 2017, 2022, 2026 & 2030 72
13.2. Benchtop Incubators 73
13.2.1. Global Benchtop Incubators Peltier Cooled Incubator Market Volume & Revenue, By Region, 2017 – 2022 (K Units) (USD Million) 74
13.2.2. Global Benchtop Incubators Peltier Cooled Incubator Market Volume & Revenue, By Region, 2017 – 2022 (K Units) (USD Million) 74
13.3. Floor-standing Incubators 75
13.3.1. Global Floor-standing Incubators Peltier Cooled Incubator Market Volume & Revenue, By Region, 2017 – 2022 (K Units) (USD Million) 76
13.3.2. Global Floor-standing Incubators Peltier Cooled Incubator Market Volume & Revenue, By Region, 2017 – 2022 (K Units) (USD Million) 76
CHAPTER NO. 14 : PELTIER COOLED INCUBATOR MARKET – BY APPLICATION SEGMENT ANALYSIS 77
14.1. Peltier Cooled Incubator Market Overview, by Application Segment 77
14.1.1. Peltier Cooled Incubator Market Volume Share, By Application, 2022 & 2030 78
14.1.2. Peltier Cooled Incubator Market Revenue Share, By Application, 2022 & 2030 78
14.1.3. Peltier Cooled Incubator Market Attractiveness Analysis, By Application 79
14.1.4. Incremental Revenue Growth Opportunity, by Application, 2023 – 2030 79
14.1.5. Peltier Cooled Incubator Market Revenue, By Application, 2017, 2022, 2026 & 2030 80
14.2. Microbiological Analyses 81
14.2.1. Global Microbiological Analyses Peltier Cooled Incubator Market Volume & Revenue, By Region, 2017 – 2022 (K Units) (USD Million) 82
14.2.2. Global Microbiological Analyses Peltier Cooled Incubator Market Volume & Revenue, By Region, 2017 – 2022 (K Units) (USD Million) 82
14.3. Bacterial Count Determination 83
14.3.1. Global Bacterial Count Determination Peltier Cooled Incubator Market Volume & Revenue, By Region, 2017 – 2022 (K Units) (USD Million) 84
14.3.2. Global Bacterial Count Determination Peltier Cooled Incubator Market Volume & Revenue, By Region, 2017 – 2022 (K Units) (USD Million) 84
14.4. Cell Cultivation 85
14.4.1. Global Cell Cultivation Peltier Cooled Incubator Market Volume & Revenue, By Region, 2017 – 2022 (K Units) (USD Million) 86
14.4.2. Global Cell Cultivation Peltier Cooled Incubator Market Volume & Revenue, By Region, 2017 – 2022 (K Units) (USD Million) 86
14.5. Food & Beverage Testing 87
14.5.1. Global Food & Beverage Testing Peltier Cooled Incubator Market Volume & Revenue, By Region, 2017 – 2022 (K Units) (USD Million) 88
14.5.2. Global Food & Beverage Testing Peltier Cooled Incubator Market Volume & Revenue, By Region, 2017 – 2022 (K Units) (USD Million) 88
14.6. Others 89
14.6.1. Global Others Peltier Cooled Incubator Market Volume & Revenue, By Region, 2017 – 2022 (K Units) (USD Million) 90
14.6.2. Global Others Peltier Cooled Incubator Market Volume & Revenue, By Region, 2017 – 2022 (K Units) (USD Million) 90
CHAPTER NO. 15 : PELTIER COOLED INCUBATOR MARKET – BY END-USER SEGMENT ANALYSIS 91
15.1. Peltier Cooled Incubator Market Overview, by End-user Segment 91
15.1.1. Peltier Cooled Incubator Market Volume Share, By End-user, 2022 & 2030 92
15.1.2. Peltier Cooled Incubator Market Revenue Share, By End-user, 2022 & 2030 92
15.1.3. Peltier Cooled Incubator Market Attractiveness Analysis, By End-user 93
15.1.4. Incremental Revenue Growth Opportunity, by End-user, 2023 – 2030 93
15.1.5. Peltier Cooled Incubator Market Revenue, By End-user, 2017, 2022, 2026 & 2030 94
15.2. Research Laboratories 95
15.2.1. Global Research Laboratories Peltier Cooled Incubator Market Volume & Revenue, By Region, 2017 – 2022 (K Units) (USD Million) 96
15.2.2. Global Research Laboratories Peltier Cooled Incubator Market Volume & Revenue, By Region, 2023 – 2030 (K Units) (USD Million) 96
15.3. Pharmaceutical and Biotech Companies 97
15.3.1. Global Pharmaceutical and Biotech Companies Peltier Cooled Incubator Market Volume & Revenue, By Region, 2017 – 2022 (K Units) (USD Million) 98
15.3.2. Global Pharmaceutical and Biotech Companies Peltier Cooled Incubator Market Volume & Revenue, By Region, 2023 – 2030 (K Units) (USD Million) 98
15.4. Clinical Laboratories 99
15.4.1. Global Clinical Laboratories Peltier Cooled Incubator Market Volume & Revenue, By Region, 2017 – 2022 (K Units) (USD Million) 100
15.4.2. Global Clinical Laboratories Peltier Cooled Incubator Market Volume & Revenue, By Region, 2023 – 2030 (K Units) (USD Million) 100
15.5. Food and Beverage Industry 101
15.5.1. Global Food and Beverage Industry Peltier Cooled Incubator Market Volume & Revenue, By Region, 2017 – 2022 (K Units) (USD Million) 102
15.5.2. Global Food and Beverage Industry Peltier Cooled Incubator Market Volume & Revenue, By Region, 2023 – 2030 (K Units) (USD Million) 102
15.6. Others 103
15.6.1. Global Others Peltier Cooled Incubator Market Volume & Revenue, By Region, 2017 – 2022 (K Units) (USD Million) 104
15.6.2. Global Others Peltier Cooled Incubator Market Volume & Revenue, By Region, 2023 – 2030 (K Units) (USD Million) 104
CHAPTER NO. 16 : PELTIER COOLED INCUBATOR MARKET – BY TECHNOLOGY SEGMENT ANALYSIS 105
16.1. Peltier Cooled Incubator Market Overview, by Technology Segment 105
16.1.1. Peltier Cooled Incubator Market Revenue Share, By Technology, 2022 & 2030 106
16.1.2. Peltier Cooled Incubator Market Revenue Share, By Technology, 2022 & 2030 106
16.1.3. Peltier Cooled Incubator Market Attractiveness Analysis, By Technology 107
16.1.4. Incremental Revenue Growth Opportunity, by Technology, 2023 – 2030 107
16.1.5. Peltier Cooled Incubator Market Revenue, By Technology, 2017, 2022, 2026 & 2030 108
16.2. Single Display 109
16.2.1. Global Single Display Peltier Cooled Incubator Market Volume & Revenue, By Region, 2017 – 2022 (K Units) (USD Million) 110
16.2.2. Global Single Display Peltier Cooled Incubator Market Volume & Revenue, By Region, 2023 – 2030 (K Units) (USD Million) 110
CHAPTER NO. 17 : PELTIER COOLED INCUBATOR MARKET – BY CAPACITY SEGMENT ANALYSIS 111
17.1. Peltier Cooled Incubator Market Overview, by Capacity Segment 111
17.1.1. Peltier Cooled Incubator Market Revenue Share, By Capacity, 2022 & 2030 112
17.1.2. Peltier Cooled Incubator Market Revenue Share, By Capacity, 2022 & 2030 112
17.1.3. Peltier Cooled Incubator Market Attractiveness Analysis, By Capacity 113
17.1.4. Incremental Revenue Growth Opportunity, by Capacity, 2023 – 2030 113
17.1.5. Peltier Cooled Incubator Market Revenue, By Capacity, 2017, 2022, 2026 & 2030 114
17.2. Small 115
17.2.1. Global Small Peltier Cooled Incubator Market Volume & Revenue, By Region, 2017 – 2022 (K Units) (USD Million) 116
17.2.2. Global Small Peltier Cooled Incubator Market Volume & Revenue, By Region, 2023 – 2030 (K Units) (USD Million) 116
17.3. Medium 117
17.3.1. Global Medium Peltier Cooled Incubator Market Volume & Revenue, By Region, 2017 – 2022 (K Units) (USD Million) 118
17.3.2. Global Medium Peltier Cooled Incubator Market Volume & Revenue, By Region, 2023 – 2030 (K Units) (USD Million) 118
17.4. Large 119
17.4.1. Global Large Peltier Cooled Incubator Market Volume & Revenue, By Region, 2017 – 2022 (K Units) (USD Million) 120
17.4.2. Global Large Peltier Cooled Incubator Market Volume & Revenue, By Region, 2023 – 2030 (K Units) (USD Million) 120
CHAPTER NO. 18 : PELTIER COOLED INCUBATOR MARKET – REGIONAL ANALYSIS 121
18.1. Peltier Cooled Incubator Market Overview, by Regional Segments 121
18.2. Region 122
18.2.1. Global Peltier Cooled Incubator Market Volume Share, By Region, 2022 & 2030 122
18.2.2. Global Peltier Cooled Incubator Market Revenue Share, By Region, 2022 & 2030 122
18.2.3. Peltier Cooled Incubator Market Attractiveness Analysis, By Region 123
18.2.4. Incremental Revenue Growth Opportunity, by Region, 2023 – 2030 123
18.2.5. Peltier Cooled Incubator Market Revenue, By Region, 2017, 2022, 2026 & 2030 124
18.2.6. Global Peltier Cooled Incubator Market Volume & Revenue, By Region, 2017 – 2022 (K Units) (USD Million) 125
18.2.7. Global Peltier Cooled Incubator Market Volume & Revenue, By Region, 2023 – 2030 (K Units) (USD Million) 125
18.3. Type 126
18.3.1. Global Peltier Cooled Incubator Market Volume & Revenue, By Type, 2017 – 2022 (K Units) (USD Million) 126
18.3.2. Global Peltier Cooled Incubator Market Volume & Revenue, By Type, 2023 – 2030 (K Units) (USD Million) 126
18.4. Application 127
18.4.1. Global Peltier Cooled Incubator Market Volume & Revenue, By Application, 2017 – 2022 (K Units) (USD Million) 127
18.4.2. Global Peltier Cooled Incubator Market Volume & Revenue, By Application, 2023 – 2030 (K Units) (USD Million) 127
18.5. End-user 128
18.5.1. Global Peltier Cooled Incubator Market Volume & Revenue, By End-user, 2017 – 2022 (K Units) (USD Million) 128
18.5.2. Global Peltier Cooled Incubator Market Volume & Revenue, By End-user, 2023 – 2030 (K Units) (USD Million) 128
18.6. Technology 129
18.6.1. Global Peltier Cooled Incubator Market Volume & Revenue, By Technology, 2017 – 2022 (K Units) (USD Million) 129
18.6.2. Global Peltier Cooled Incubator Market Volume & Revenue, By Technology, 2023 – 2030 (K Units) (USD Million) 129
18.7. Capacity 130
18.7.1. Global Peltier Cooled Incubator Market Volume & Revenue, By Capacity, 2017 – 2022 (K Units) (USD Million) 130
18.7.2. Global Peltier Cooled Incubator Market Volume & Revenue, By Capacity, 2023 – 2030 (K Units) (USD Million) 130
CHAPTER NO. 19 : PELTIER COOLED INCUBATOR MARKET – NORTH AMERICA 131
19.1. North America 131
19.1. Key Highlights 131
19.1.1. North America Peltier Cooled Incubator Market Volume, By Country, 2017 – 2022 (K Units) 132
19.1.2. North America Peltier Cooled Incubator Market Revenue, By Country, 2017 – 2022 (USD Million) 133
19.1.2.1. North America Peltier Cooled Incubator Market Volume, By Type, 2017 – 2022 (K Units) 134
19.1.3. North America Peltier Cooled Incubator Market Revenue, By Type, 2017 – 2022 (USD Million) 135
19.1.4. North America Peltier Cooled Incubator Market Volume, By Application, 2017 – 2022 (K Units) 136
19.1.5. North America Peltier Cooled Incubator Market Revenue, By Application, 2017 – 2022 (USD Million) 137
19.1.6. North America Peltier Cooled Incubator Market Volume, By End-user, 2017 – 2022 (K Units) 138
19.1.7. North America Peltier Cooled Incubator Market Revenue, By End-user, 2017 – 2022 (USD Million) 139
19.1.8. North America Peltier Cooled Incubator Market Volume, By Technology, 2017 – 2022 (K Units) 140
19.1.9. North America Peltier Cooled Incubator Market Revenue, By Technology, 2017 – 2022 (USD Million) 141
19.1.10. North America Peltier Cooled Incubator Market Volume, By Capacity, 2017 – 2022 (K Units) 142
19.1.11. North America Peltier Cooled Incubator Market Revenue, By Capacity, 2017 – 2022 (USD Million) 143
19.1.12. U.S. 144
19.1.13. Canada 144
19.1.14. Mexico 144
CHAPTER NO. 20 : PELTIER COOLED INCUBATOR MARKET – EUROPE 145
20.1. Europe 145
20.2. Key Highlights 145
20.2.1. Europe Peltier Cooled Incubator Market Volume, By Country, 2017 – 2022 (K Units) 146
20.2.2. Europe Peltier Cooled Incubator Market Revenue, By Country, 2017 – 2022 (USD Million) 147
20.2.3. Europe Peltier Cooled Incubator Market Volume, By Type, 2017 – 2022 (K Units) 148
20.2.4. Europe Peltier Cooled Incubator Market Revenue, By Type, 2017 – 2022 (USD Million) 149
20.2.5. Europe Peltier Cooled Incubator Market Volume, By Application, 2017 – 2022 (K Units) 150
20.2.6. Europe Peltier Cooled Incubator Market Revenue, By Application, 2017 – 2022 (USD Million) 151
20.2.7. Europe Peltier Cooled Incubator Market Volume, By End-user, 2017 – 2022 (K Units) 152
20.2.8. Europe Peltier Cooled Incubator Market Revenue, By End-user, 2017 – 2022 (USD Million) 153
20.2.9. Europe Peltier Cooled Incubator Market Volume, By Technology, 2017 – 2022 (K Units) 154
20.2.10. Europe Peltier Cooled Incubator Market Revenue, By Technology, 2017 – 2022 (USD Million) 155
20.2.11. Europe Peltier Cooled Incubator Market Volume, By Capacity, 2017 – 2022 (K Units) 156
20.2.12. Europe Peltier Cooled Incubator Market Revenue, By Capacity, 2017 – 2022 (USD Million) 157
20.2.13. UK 158
20.2.14. France 158
20.2.15. Germany 158
20.2.16. Italy 158
20.2.17. Spain 158
20.2.18. Russia 158
20.2.19. BENELUX 158
20.2.20. Sweden 158
20.2.21. Denmark 158
20.2.22. Poland 158
20.2.23. Austria 158
20.2.24. Rest of Europe 158
CHAPTER NO. 21 : PELTIER COOLED INCUBATOR MARKET – ASIA PACIFIC 159
21.1. Asia Pacific 159
21.2. Key Highlights 159
21.2.1. Asia Pacific Peltier Cooled Incubator Market Volume, By Country, 2017 – 2022 (K Units) 160
21.2.2. Asia Pacific Peltier Cooled Incubator Market Revenue, By Country, 2017 – 2022 (USD Million) 161
21.2.3. Asia Pacific Peltier Cooled Incubator Market Volume, By Type, 2017 – 2022 (K Units) 162
21.2.4. Asia Pacific Peltier Cooled Incubator Market Revenue, By Type, 2017 – 2022 (USD Million) 163
21.2.5. Asia Pacific Peltier Cooled Incubator Market Volume, By Application, 2017 – 2022 (K Units) 164
21.2.6. Asia Pacific Peltier Cooled Incubator Market Revenue, By Application, 2017 – 2022 (USD Million) 165
21.2.7. Asia Pacific Peltier Cooled Incubator Market Volume, By End-user, 2017 – 2022 (K Units) 166
21.2.8. Asia Pacific Peltier Cooled Incubator Market Revenue, By End-user, 2017 – 2022 (USD Million) 167
21.2.9. Asia Pacific Peltier Cooled Incubator Market Volume, By Technology, 2017 – 2022 (K Units) 168
21.2.10. Asia Pacific Peltier Cooled Incubator Market Revenue, By Technology, 2017 – 2022 (USD Million) 169
21.2.11. Asia Pacific Peltier Cooled Incubator Market Volume, By Capacity, 2017 – 2022 (K Units) 170
21.2.12. Asia Pacific Peltier Cooled Incubator Market Revenue, By Capacity, 2017 – 2022 (USD Million) 171
21.2.13. China 172
21.2.14. Japan 172
21.2.15. South Korea 172
21.2.16. India 172
21.2.17. Thailand 172
21.2.18. Indonesia 172
21.2.19. Vietnam 172
21.2.20. Malaysia 172
21.2.21. Philippines 172
21.2.22. Taiwan 172
21.2.23. Rest of Asia Pacific 172
CHAPTER NO. 22 : PELTIER COOLED INCUBATOR MARKET – LATIN AMERICA 173
22.1. Latin America 173
22.2. Key Highlights 173
22.2.1. Latin America Peltier Cooled Incubator Market Volume, By Country, 2017 – 2022 (K Units) 174
22.2.2. Latin America Peltier Cooled Incubator Market Revenue, By Country, 2017 – 2022 (USD Million) 175
22.2.3. Latin America Peltier Cooled Incubator Market Volume, By Type, 2017 – 2022 (K Units) 176
22.2.4. Latin America Peltier Cooled Incubator Market Revenue, By Type, 2017 – 2022 (USD Million) 177
22.2.5. Latin America Peltier Cooled Incubator Market Volume, By Application, 2017 – 2022 (K Units) 178
22.2.6. Latin America Peltier Cooled Incubator Market Revenue, By Application, 2017 – 2022 (USD Million) 179
22.2.7. Latin America Peltier Cooled Incubator Market Volume, By End-user, 2017 – 2022 (K Units) 180
22.2.8. Latin America Peltier Cooled Incubator Market Revenue, By End-user, 2017 – 2022 (USD Million) 181
22.2.9. Latin America Peltier Cooled Incubator Market Volume, By Technology, 2017 – 2022 (K Units) 182
22.2.10. Latin America Peltier Cooled Incubator Market Revenue, By Technology, 2017 – 2022 (USD Million) 183
22.2.11. Latin America Peltier Cooled Incubator Market Volume, By Capacity, 2017 – 2022 (K Units) 184
22.2.12. Latin America Peltier Cooled Incubator Market Revenue, By Capacity, 2017 – 2022 (USD Million) 185
22.2.13. Brazil 186
22.2.14. Argentina 186
22.2.15. Colombia 186
22.2.16. Chile 186
22.2.17. Peru 186
22.2.18. Rest of Latin America 186
CHAPTER NO. 23 : PELTIER COOLED INCUBATOR MARKET – MIDDLE EAST 187
23.1. The Middle-East 187
23.2. Key Highlights 187
23.2.1. Middle East Peltier Cooled Incubator Market Volume, By Country, 2017 – 2022 (K Units) 188
23.2.2. Middle East Peltier Cooled Incubator Market Revenue, By Country, 2017 – 2022 (USD Million) 189
23.2.3. Middle East Peltier Cooled Incubator Market Volume, By Type, 2017 – 2022 (K Units) 190
23.2.4. Middle East Peltier Cooled Incubator Market Revenue, By Type, 2017 – 2022 (USD Million) 191
23.2.5. Middle East Peltier Cooled Incubator Market Volume, By Application, 2017 – 2022 (K Units) 192
23.2.6. Middle East Peltier Cooled Incubator Market Revenue, By Application, 2017 – 2022 (USD Million) 193
23.2.7. Middle East Peltier Cooled Incubator Market Volume, By End-user, 2017 – 2022 (K Units) 194
23.2.8. Middle East Peltier Cooled Incubator Market Revenue, By End-user, 2017 – 2022 (USD Million) 195
23.2.9. Middle East Peltier Cooled Incubator Market Volume, By Technology, 2017 – 2022 (K Units) 196
23.2.10. Middle East Peltier Cooled Incubator Market Revenue, By Technology, 2017 – 2022 (USD Million) 197
23.2.11. Middle East Peltier Cooled Incubator Market Volume, By Capacity, 2017 – 2022 (K Units) 198
23.2.12. Middle East Peltier Cooled Incubator Market Revenue, By Capacity, 2017 – 2022 (USD Million) 199
23.2.13. GCC Countries 200
23.2.14. Israel 200
23.2.15. Turkey 200
23.2.16. Iran 200
23.2.17. Rest of Middle East & Africa 200
CHAPTER NO. 24 : PELTIER COOLED INCUBATOR MARKET – AFRICA 201
24.1. Africa 201
24.2. Key Highlights 201
24.2.1. Africa Peltier Cooled Incubator Market Volume, By Country, 2017 – 2022 (K Units) 202
24.2.2. Africa Peltier Cooled Incubator Market Revenue, By Country, 2017 – 2022 (USD Million) 203
24.2.3. Africa Peltier Cooled Incubator Market Volume, By Type, 2017 – 2022 (K Units) 204
24.2.4. Africa Peltier Cooled Incubator Market Revenue, By Type, 2017 – 2022 (USD Million) 205
24.2.5. Africa Peltier Cooled Incubator Market Volume, By Application, 2017 – 2022 (K Units) 206
24.2.6. Africa Peltier Cooled Incubator Market Revenue, By Application, 2017 – 2022 (USD Million) 207
24.2.7. Africa Peltier Cooled Incubator Market Volume, By End-user, 2017 – 2022 (K Units) 208
24.2.8. Africa Peltier Cooled Incubator Market Revenue, By End-user, 2017 – 2022 (USD Million) 209
24.2.9. Africa Peltier Cooled Incubator Market Volume, By Technology, 2017 – 2022 (K Units) 210
24.2.10. Africa Peltier Cooled Incubator Market Revenue, By Technology, 2017 – 2022 (USD Million) 211
24.2.11. Africa Peltier Cooled Incubator Market Volume, By Capacity, 2017 – 2022 (K Units) 212
24.2.12. Africa Peltier Cooled Incubator Market Revenue, By Capacity, 2017 – 2022 (USD Million) 213
24.2.13. South Africa 214
24.2.14. Egypt 214
24.2.15. Nigeria 214
24.2.16. Algeria 214
24.2.17. Morocco 214
24.2.18. Rest of Africa 214
CHAPTER NO. 25 : COMPANY PROFILES 215
25.1. Memmert 215
25.1.1. Company Overview 215
25.1.2. Product Portfolio 215
25.1.3. Swot Analysis 215
25.1.4. Business Strategy 216
25.1.5. Financial Overview 216
25.2. Thermo Fisher 217
25.3. BINDER 217
25.4. Hettich 217
25.5. TRITEC 217
25.6. VWR International 217
25.7. Wiggens 217
25.8. Revolutionary Science 217
25.9. Amerex Instruments 217
25.10. Gilson 217
25.11. Benchmark Scientific 217
25.12. BEING Instrument 217
25.13. Panasonic Healthcare Co., Ltd. 217
25.14. Labcold Ltd. 217
25.15. NuAire, Inc. 217
25.16. Esco Micro Pte. Ltd. 217
CHAPTER NO. 26 : RESEARCH METHODOLOGY 218
26.1. Research Methodology 218
26.2. Phase I – Secondary Research 219
26.3. Phase II – Data Modeling 219
26.3.1. Company Share Analysis Model 220
26.3.2. Revenue Based Modeling 220
26.4. Phase III – Primary Research 221
26.5. Research Limitations 222
26.5.1. Assumptions 222
List of Figures
FIG NO. 1. Global Peltier Cooled Incubator Market Volume & Revenue, 2017 – 2022 (K Units) (USD Million) 40
FIG NO. 2. Porter’s Five Forces Analysis for Global Peltier Cooled Incubator Market 48
FIG NO. 3. Value Chain Analysis for Global Peltier Cooled Incubator Market 49
FIG NO. 4. Global Peltier Cooled Incubator Market Import Volume/Revenue, By Region, 2017 – 2022 51
FIG NO. 5. Global Peltier Cooled Incubator Market Export Volume/Revenue, By Region, 2017 – 2022 52
FIG NO. 6. Global Peltier Cooled Incubator Market Demand Volume/Revenue, By Region, 2017 – 2022 53
FIG NO. 7. Global Peltier Cooled Incubator Market Supply Volume/Revenue, By Region, 2017 – 2022 54
FIG NO. 8. Global Peltier Cooled Incubator Market Production, By Region, 2017 – 2022 55
FIG NO. 9. Global Peltier Cooled Incubator Market Price, By Region, 2017 – 2022 56
FIG NO. 10. Global Peltier Cooled Incubator Market Price, By Type, 2017 – 2022 57
FIG NO. 11. Raw Materials Price Trend Analysis, 2017 – 2022 58
FIG NO. 12. Manufacturing Cost Analysis 59
FIG NO. 13. Manufacturing Process 59
FIG NO. 14. Company Share Analysis, 2022 60
FIG NO. 15. Company Share Analysis, 2022 61
FIG NO. 16. Company Share Analysis, 2022 61
FIG NO. 17. Company Share Analysis, 2022 62
FIG NO. 18. Peltier Cooled Incubator Market – Company Volume Market Share, 2022 63
FIG NO. 19. Peltier Cooled Incubator Market – Company Revenue Market Share, 2022 64
FIG NO. 20. Peltier Cooled Incubator Market Volume Share, By Type, 2022 & 2030 70
FIG NO. 21. Peltier Cooled Incubator Market Revenue Share, By Type, 2022 & 2030 70
FIG NO. 22. Market Attractiveness Analysis, By Type 71
FIG NO. 23. Incremental Revenue Growth Opportunity by Type 71
FIG NO. 24. Peltier Cooled Incubator Market Revenue, By Type, 2017, 2022, 2026 & 2030 72
FIG NO. 25. Global Peltier Cooled Incubator Market for Benchtop Incubators, Volume & Revenue (K Units) (USD Million) 2017 – 2030 73
FIG NO. 26. Global Peltier Cooled Incubator Market for Floor-standing Incubators, Volume & Revenue (K Units) (USD Million) 2017 – 2030 75
FIG NO. 27. Peltier Cooled Incubator Market Volume Share, By Application, 2022 & 2030 78
FIG NO. 28. Peltier Cooled Incubator Market Revenue Share, By Application, 2022 & 2030 78
FIG NO. 29. Market Attractiveness Analysis, By Application 79
FIG NO. 30. Incremental Revenue Growth Opportunity by Application 79
FIG NO. 31. Peltier Cooled Incubator Market Revenue, By Application, 2017, 2022, 2026 & 2030 80
FIG NO. 32. Global Peltier Cooled Incubator Market for Microbiological Analyses, Volume & Revenue (K Units) (USD Million) 2017 – 2030 81
FIG NO. 33. Global Peltier Cooled Incubator Market for Bacterial Count Determination, Volume & Revenue (K Units) (USD Million) 2017 – 2030 83
FIG NO. 34. Global Peltier Cooled Incubator Market for Cell Cultivation, Volume & Revenue (K Units) (USD Million) 2017 – 2030 85
FIG NO. 35. Global Peltier Cooled Incubator Market for Food & Beverage Testing, Volume & Revenue (K Units) (USD Million) 2017 – 2030 87
FIG NO. 36. Global Peltier Cooled Incubator Market for Others, Volume & Revenue (K Units) (USD Million) 2017 – 2030 89
FIG NO. 37. Peltier Cooled Incubator Market Volume Share, By End-user, 2022 & 2030 92
FIG NO. 38. Peltier Cooled Incubator Market Revenue Share, By End-user, 2022 & 2030 92
FIG NO. 39. Market Attractiveness Analysis, By End-user 93
FIG NO. 40. Incremental Revenue Growth Opportunity by End-user 93
FIG NO. 41. Peltier Cooled Incubator Market Revenue, By End-user, 2017, 2022, 2026 & 2030 94
FIG NO. 42. Global Peltier Cooled Incubator Market for Research Laboratories, Volume & Revenue (K Units) (USD Million) 2017 – 2030 95
FIG NO. 43. Global Peltier Cooled Incubator Market for Pharmaceutical and Biotech Companies, Volume & Revenue (K Units) (USD Million) 2017 – 2030 97
FIG NO. 44. Global Peltier Cooled Incubator Market for Clinical Laboratories, Volume & Revenue (K Units) (USD Million) 2017 – 2030 99
FIG NO. 45. Global Peltier Cooled Incubator Market for Food and Beverage Industry, Volume & Revenue (K Units) (USD Million) 2017 – 2030 101
FIG NO. 46. Global Peltier Cooled Incubator Market for Others, Volume & Revenue (K Units) (USD Million) 2017 – 2030 103
FIG NO. 47. Peltier Cooled Incubator Market Revenue Share, By Technology, 2022 & 2030 106
FIG NO. 48. Peltier Cooled Incubator Market Revenue Share, By Technology, 2022 & 2030 106
FIG NO. 49. Market Attractiveness Analysis, By Technology 107
FIG NO. 50. Incremental Revenue Growth Opportunity by Technology 107
FIG NO. 51. Peltier Cooled Incubator Market Revenue, By Technology, 2017, 2022, 2026 & 2030 108
FIG NO. 52. Global Peltier Cooled Incubator Market for Single Display, Volume & Revenue (K Units) (USD Million) 2017 – 2030 109
FIG NO. 53. Peltier Cooled Incubator Market Revenue Share, By Capacity, 2022 & 2030 112
FIG NO. 54. Peltier Cooled Incubator Market Revenue Share, By Capacity, 2022 & 2030 112
FIG NO. 55. Market Attractiveness Analysis, By Capacity 113
FIG NO. 56. Incremental Revenue Growth Opportunity by Capacity 113
FIG NO. 57. Peltier Cooled Incubator Market Revenue, By Capacity, 2017, 2022, 2026 & 2030 114
FIG NO. 58. Global Peltier Cooled Incubator Market for Small, Volume & Revenue (K Units) (USD Million) 2017 – 2030 115
FIG NO. 59. Global Peltier Cooled Incubator Market for Medium, Volume & Revenue (K Units) (USD Million) 2017 – 2030 117
FIG NO. 60. Global Peltier Cooled Incubator Market for Large, Volume & Revenue (K Units) (USD Million) 2017 – 2030 119
FIG NO. 61. Global Peltier Cooled Incubator Market Volume Share, By Region, 2022 & 2030 122
FIG NO. 62. Global Peltier Cooled Incubator Market Revenue Share, By Region, 2022 & 2030 122
FIG NO. 63. Market Attractiveness Analysis, By Region 123
FIG NO. 64. Incremental Revenue Growth Opportunity by Region 123
FIG NO. 65. Peltier Cooled Incubator Market Revenue, By Region, 2017, 2022, 2026 & 2030 124
FIG NO. 66. North America Peltier Cooled Incubator Market Volume & Revenue, 2017 – 2022 (K Units) (USD Million) 131
FIG NO. 67. Europe Peltier Cooled Incubator Market Volume & Revenue, 2017 – 2022 (K Units) (USD Million) 145
FIG NO. 68. Asia Pacific Peltier Cooled Incubator Market Volume & Revenue, 2017 – 2022 (K Units) (USD Million) 159
FIG NO. 69. Latin America Peltier Cooled Incubator Market Volume & Revenue, 2017 – 2022 (K Units) (USD Million) 173
FIG NO. 70. The Middle-East Peltier Cooled Incubator Market Volume & Revenue, 2017 – 2022 (K Units) (USD Million) 187
FIG NO. 71. Africa Peltier Cooled Incubator Market Volume & Revenue, 2017 – 2022 (K Units) (USD Million) 201
FIG NO. 72. Research Methodology – Detailed View 218
FIG NO. 73. Research Methodology 219
List of Tables
TABLE NO. 1. : Global Peltier Cooled Incubator Market: Snapshot 37
TABLE NO. 2. : Drivers for the Peltier Cooled Incubator Market: Impact Analysis 43
TABLE NO. 3. : Restraints for the Peltier Cooled Incubator Market: Impact Analysis 45
TABLE NO. 4. : Global Peltier Cooled Incubator Market Volume & Revenue, By Region, 2017 – 2022 (K Units) 54
TABLE NO. 5. : Global Peltier Cooled Incubator Market Volume & Revenue, By Region, 2017 – 2022 55
TABLE NO. 6. : Global Peltier Cooled Incubator Market Volume & Revenue, By Type, 2017 – 2022 56
TABLE NO. 7. : Key Raw Materials & Suppliers 57
TABLE NO. 8. : Global Benchtop Incubators Peltier Cooled Incubator Market Volume & Revenue, By Region, 2017 – 2022 (K Units) (USD Million) 73
TABLE NO. 9. : Global Benchtop Incubators Peltier Cooled Incubator Market Volume & Revenue, By Region, 2023– 2030 (K Units) (USD Million) 73
TABLE NO. 10. : Global Floor-standing Incubators Peltier Cooled Incubator Market Volume & Revenue, By Region, 2017 – 2022 (K Units) (USD Million) 75
TABLE NO. 11. : Global Floor-standing Incubators Peltier Cooled Incubator Market Volume & Revenue, By Region, 2023– 2030 (K Units) (USD Million) 75
TABLE NO. 12. : Global Microbiological Analyses Peltier Cooled Incubator Market Volume & Revenue, By Region, 2017 – 2022 (K Units) (USD Million) 81
TABLE NO. 13. : Global Microbiological Analyses Peltier Cooled Incubator Market Volume & Revenue, By Region, 2023– 2030 (K Units) (USD Million) 81
TABLE NO. 14. : Global Bacterial Count Determination Peltier Cooled Incubator Market Volume & Revenue, By Region, 2017 – 2022 (K Units) (USD Million) 83
TABLE NO. 15. : Global Bacterial Count Determination Peltier Cooled Incubator Market Volume & Revenue, By Region, 2023– 2030 (K Units) (USD Million) 83
TABLE NO. 16. : Global Cell Cultivation Peltier Cooled Incubator Market Volume & Revenue, By Region, 2017 – 2022 (K Units) (USD Million) 85
TABLE NO. 17. : Global Cell Cultivation Peltier Cooled Incubator Market Volume & Revenue, By Region, 2023– 2030 (K Units) (USD Million) 85
TABLE NO. 18. : Global Food & Beverage Testing Peltier Cooled Incubator Market Volume & Revenue, By Region, 2017 – 2022 (K Units) (USD Million) 87
TABLE NO. 19. : Global Food & Beverage Testing Peltier Cooled Incubator Market Volume & Revenue, By Region, 2023– 2030 (K Units) (USD Million) 87
TABLE NO. 20. : Global Others Peltier Cooled Incubator Market Volume & Revenue, By Region, 2017 – 2022 (K Units) (USD Million) 89
TABLE NO. 21. : Global Others Peltier Cooled Incubator Market Volume & Revenue, By Region, 2023– 2030 (K Units) (USD Million) 89
TABLE NO. 22. : Global Research Laboratories Peltier Cooled Incubator Market Volume & Revenue, By Region, 2017 – 2022 (K Units) (USD Million) 95
TABLE NO. 23. : Global Research Laboratories Peltier Cooled Incubator Market Volume & Revenue, By Region, 2023– 2030 (K Units) (USD Million) 95
TABLE NO. 24. : Global Pharmaceutical and Biotech Companies Peltier Cooled Incubator Market Volume & Revenue, By Region, 2017 – 2022 (K Units) (USD Million) 97
TABLE NO. 25. : Global Pharmaceutical and Biotech Companies Peltier Cooled Incubator Market Volume & Revenue, By Region, 2023– 2030 (K Units) (USD Million) 97
TABLE NO. 26. : Global Clinical Laboratories Peltier Cooled Incubator Market Volume & Revenue, By Region, 2017 – 2022 (K Units) (USD Million) 99
TABLE NO. 27. : Global Clinical Laboratories Peltier Cooled Incubator Market Volume & Revenue, By Region, 2023– 2030 (K Units) (USD Million) 99
TABLE NO. 28. : Global Food and Beverage Industry Peltier Cooled Incubator Market Volume & Revenue, By Region, 2017 – 2022 (K Units) (USD Million) 101
TABLE NO. 29. : Global Food and Beverage Industry Peltier Cooled Incubator Market Volume & Revenue, By Region, 2023– 2030 (K Units) (USD Million) 101
TABLE NO. 30. : Global Others Peltier Cooled Incubator Market Volume & Revenue, By Region, 2017 – 2022 (K Units) (USD Million) 103
TABLE NO. 31. : Global Others Peltier Cooled Incubator Market Volume & Revenue, By Region, 2023– 2030 (K Units) (USD Million) 103
TABLE NO. 32. : Global Single Display Peltier Cooled Incubator Market Volume & Revenue, By Region, 2017 – 2022 (K Units) (USD Million) 109
TABLE NO. 33. : Global Single Display Peltier Cooled Incubator Market Volume & Revenue, By Region, 2023– 2030 (K Units) (USD Million) 109
TABLE NO. 34. : Global Small Peltier Cooled Incubator Market Volume & Revenue, By Region, 2017 – 2022 (K Units) (USD Million) 115
TABLE NO. 35. : Global Small Peltier Cooled Incubator Market Volume & Revenue, By Region, 2023– 2030 (K Units) (USD Million) 115
TABLE NO. 36. : Global Medium Peltier Cooled Incubator Market Volume & Revenue, By Region, 2017 – 2022 (K Units) (USD Million) 117
TABLE NO. 37. : Global Medium Peltier Cooled Incubator Market Volume & Revenue, By Region, 2023– 2030 (K Units) (USD Million) 117
TABLE NO. 38. : Global Large Peltier Cooled Incubator Market Volume & Revenue, By Region, 2017 – 2022 (K Units) (USD Million) 119
TABLE NO. 39. : Global Large Peltier Cooled Incubator Market Volume & Revenue, By Region, 2023– 2030 (K Units) (USD Million) 119
TABLE NO. 40. : Global Peltier Cooled Incubator Market Volume & Revenue, By Region, 2017 – 2022 (K Units) (USD Million) 124
TABLE NO. 41. : Global Peltier Cooled Incubator Market Volume & Revenue, By Region, 2023– 2030 (K Units) (USD Million) 124
TABLE NO. 42. : Global Peltier Cooled Incubator Market Volume & Revenue, By Type, 2017 – 2022 (K Units) (USD Million) 125
TABLE NO. 43. : Global Peltier Cooled Incubator Market Volume & Revenue, By Type, 2023– 2030 (K Units) (USD Million) 125
TABLE NO. 44. : Global Peltier Cooled Incubator Market Volume & Revenue, By Application, 2017 – 2022 (K Units) (USD Million) 126
TABLE NO. 45. : Global Peltier Cooled Incubator Market Volume & Revenue, By Application, 2023– 2030 (K Units) (USD Million) 126
TABLE NO. 46. : Global Peltier Cooled Incubator Market Volume & Revenue, By End-user, 2017 – 2022 (K Units) (USD Million) 127
TABLE NO. 47. : Global Peltier Cooled Incubator Market Volume & Revenue, By End-user, 2023– 2030 (K Units) (USD Million) 127
TABLE NO. 48. : Global Peltier Cooled Incubator Market Volume & Revenue, By Technology, 2017 – 2022 (K Units) (USD Million) 128
TABLE NO. 49. : Global Peltier Cooled Incubator Market Volume & Revenue, By Technology, 2023– 2030 (K Units) (USD Million) 128
TABLE NO. 50. : Global Peltier Cooled Incubator Market Volume & Revenue, By Capacity, 2017 – 2022 (K Units) (USD Million) 129
TABLE NO. 51. : Global Peltier Cooled Incubator Market Volume & Revenue, By Capacity, 2023– 2030 (K Units) (USD Million) 129
TABLE NO. 52. : North America Peltier Cooled Incubator Market Volume, By Country, 2017 – 2022 (K Units) 131
TABLE NO. 53. : North America Peltier Cooled Incubator Market Volume, By Country, 2023– 2030 (K Units) 131
TABLE NO. 54. : North America Peltier Cooled Incubator Market Revenue, By Country, 2017 – 2022 (USD Million) 132
TABLE NO. 55. : North America Peltier Cooled Incubator Market Revenue, By Country, 2023– 2030 (USD Million) 132
TABLE NO. 56. : North America Peltier Cooled Incubator Market Volume, By Type, 2017 – 2022 (K Units) 133
TABLE NO. 57. : North America Peltier Cooled Incubator Market Volume, By Type, 2023– 2030 (K Units) 133
TABLE NO. 58. : North America Peltier Cooled Incubator Market Revenue, By Type, 2017 – 2022 (USD Million) 134
TABLE NO. 59. : North America Peltier Cooled Incubator Market Revenue, By Type, 2023– 2030 (USD Million) 134
TABLE NO. 60. : North America Peltier Cooled Incubator Market Volume, By Application, 2017 – 2022 (K Units) 135
TABLE NO. 61. : North America Peltier Cooled Incubator Market Volume, By Application, 2023– 2030 (K Units) 135
TABLE NO. 62. : North America Peltier Cooled Incubator Market Revenue, By Application, 2017 – 2022 (USD Million) 136
TABLE NO. 63. : North America Peltier Cooled Incubator Market Revenue, By Application, 2023– 2030 (USD Million) 136
TABLE NO. 64. : North America Peltier Cooled Incubator Market Volume, By End-user, 2017 – 2022 (K Units) 137
TABLE NO. 65. : North America Peltier Cooled Incubator Market Volume, By End-user, 2023– 2030 (K Units) 137
TABLE NO. 66. : North America Peltier Cooled Incubator Market Revenue, By End-user, 2017 – 2022 (USD Million) 138
TABLE NO. 67. : North America Peltier Cooled Incubator Market Revenue, By End-user, 2023– 2030 (USD Million) 138
TABLE NO. 68. : North America Peltier Cooled Incubator Market Volume, By Technology, 2017 – 2022 (K Units) 139
TABLE NO. 69. : North America Peltier Cooled Incubator Market Volume, By Technology, 2023– 2030 (K Units) 139
TABLE NO. 70. : North America Peltier Cooled Incubator Market Revenue, By Technology, 2017 – 2022 (USD Million) 140
TABLE NO. 71. : North America Peltier Cooled Incubator Market Revenue, By Technology, 2023– 2030 (USD Million) 140
TABLE NO. 72. : North America Peltier Cooled Incubator Market Volume, By Capacity, 2017 – 2022 (K Units) 141
TABLE NO. 73. : North America Peltier Cooled Incubator Market Volume, By Capacity, 2023– 2030 (K Units) 141
TABLE NO. 74. : North America Peltier Cooled Incubator Market Revenue, By Capacity, 2017 – 2022 (USD Million) 142
TABLE NO. 75. : North America Peltier Cooled Incubator Market Revenue, By Capacity, 2023– 2030 (USD Million) 142
TABLE NO. 76. : Europe Peltier Cooled Incubator Market Volume, By Country, 2017 – 2022 (K Units) 145
TABLE NO. 77. : Europe Peltier Cooled Incubator Market Volume, By Country, 2023– 2030 (K Units) 145
TABLE NO. 78. : Europe Peltier Cooled Incubator Market Revenue, By Country, 2017 – 2022 (USD Million) 146
TABLE NO. 79. : Europe Peltier Cooled Incubator Market Revenue, By Country, 2023– 2030 (USD Million) 146
TABLE NO. 80. : Europe Peltier Cooled Incubator Market Volume, By Type, 2017 – 2022 (K Units) 147
TABLE NO. 81. : Europe Peltier Cooled Incubator Market Volume, By Type, 2023– 2030 (K Units) 147
TABLE NO. 82. : Europe Peltier Cooled Incubator Market Revenue, By Type, 2017 – 2022 (USD Million) 148
TABLE NO. 83. : Europe Peltier Cooled Incubator Market Revenue, By Type, 2023– 2030 (USD Million) 148
TABLE NO. 84. : Europe Peltier Cooled Incubator Market Volume, By Application, 2017 – 2022 (K Units) 149
TABLE NO. 85. : Europe Peltier Cooled Incubator Market Volume, By Application, 2023– 2030 (K Units) 149
TABLE NO. 86. : Europe Peltier Cooled Incubator Market Revenue, By Application, 2017 – 2022 (USD Million) 150
TABLE NO. 87. : Europe Peltier Cooled Incubator Market Revenue, By Application, 2023– 2030 (USD Million) 150
TABLE NO. 88. : Europe Peltier Cooled Incubator Market Volume, By End-user, 2017 – 2022 (K Units) 151
TABLE NO. 89. : Europe Peltier Cooled Incubator Market Volume, By End-user, 2023– 2030 (K Units) 151
TABLE NO. 90. : Europe Peltier Cooled Incubator Market Revenue, By End-user, 2017 – 2022 (USD Million) 152
TABLE NO. 91. : Europe Peltier Cooled Incubator Market Revenue, By End-user, 2023– 2030 (USD Million) 152
TABLE NO. 92. : Europe Peltier Cooled Incubator Market Volume, By Technology, 2017 – 2022 (K Units) 153
TABLE NO. 93. : Europe Peltier Cooled Incubator Market Volume, By Technology, 2023– 2030 (K Units) 153
TABLE NO. 94. : Europe Peltier Cooled Incubator Market Revenue, By Technology, 2017 – 2022 (USD Million) 154
TABLE NO. 95. : Europe Peltier Cooled Incubator Market Revenue, By Technology, 2023– 2030 (USD Million) 154
TABLE NO. 96. : Europe Peltier Cooled Incubator Market Volume, By Capacity, 2017 – 2022 (K Units) 155
TABLE NO. 97. : Europe Peltier Cooled Incubator Market Volume, By Capacity, 2023– 2030 (K Units) 155
TABLE NO. 98. : Europe Peltier Cooled Incubator Market Revenue, By Capacity, 2017 – 2022 (USD Million) 156
TABLE NO. 99. : Europe Peltier Cooled Incubator Market Revenue, By Capacity, 2023– 2030 (USD Million) 156
TABLE NO. 100. : Asia Pacific Peltier Cooled Incubator Market Volume, By Country, 2017 – 2022 (K Units) 159
TABLE NO. 101. : Asia Pacific Peltier Cooled Incubator Market Volume, By Country, 2023– 2030 (K Units) 159
TABLE NO. 102. : Asia Pacific Peltier Cooled Incubator Market Revenue, By Country, 2017 – 2022 (USD Million) 160
TABLE NO. 103. : Asia Pacific Peltier Cooled Incubator Market Revenue, By Country, 2023– 2030 (USD Million) 160
TABLE NO. 104. : Asia Pacific Peltier Cooled Incubator Market Volume, By Type, 2017 – 2022 (K Units) 161
TABLE NO. 105. : Asia Pacific Peltier Cooled Incubator Market Volume, By Type, 2023– 2030 (K Units) 161
TABLE NO. 106. : Asia Pacific Peltier Cooled Incubator Market Revenue, By Type, 2017 – 2022 (USD Million) 162
TABLE NO. 107. : Asia Pacific Peltier Cooled Incubator Market Revenue, By Type, 2023– 2030 (USD Million) 162
TABLE NO. 108. : Asia Pacific Peltier Cooled Incubator Market Volume, By Application, 2017 – 2022 (K Units) 163
TABLE NO. 109. : Asia Pacific Peltier Cooled Incubator Market Volume, By Application, 2023– 2030 (K Units) 163
TABLE NO. 110. : Asia Pacific Peltier Cooled Incubator Market Revenue, By Application, 2017 – 2022 (USD Million) 164
TABLE NO. 111. : Asia Pacific Peltier Cooled Incubator Market Revenue, By Application, 2023– 2030 (USD Million) 164
TABLE NO. 112. : Asia Pacific Peltier Cooled Incubator Market Volume, By End-user, 2017 – 2022 (K Units) 165
TABLE NO. 113. : Asia Pacific Peltier Cooled Incubator Market Volume, By End-user, 2023– 2030 (K Units) 165
TABLE NO. 114. : Asia Pacific Peltier Cooled Incubator Market Revenue, By End-user, 2017 – 2022 (USD Million) 166
TABLE NO. 115. : Asia Pacific Peltier Cooled Incubator Market Revenue, By End-user, 2023– 2030 (USD Million) 166
TABLE NO. 116. : Asia Pacific Peltier Cooled Incubator Market Volume, By Technology, 2017 – 2022 (K Units) 167
TABLE NO. 117. : Asia Pacific Peltier Cooled Incubator Market Volume, By Technology, 2023– 2030 (K Units) 167
TABLE NO. 118. : Asia Pacific Peltier Cooled Incubator Market Revenue, By Technology, 2017 – 2022 (USD Million) 168
TABLE NO. 119. : Asia Pacific Peltier Cooled Incubator Market Revenue, By Technology, 2023– 2030 (USD Million) 168
TABLE NO. 120. : Asia Pacific Peltier Cooled Incubator Market Volume, By Capacity, 2017 – 2022 (K Units) 169
TABLE NO. 121. : Asia Pacific Peltier Cooled Incubator Market Volume, By Capacity, 2023– 2030 (K Units) 169
TABLE NO. 122. : Asia Pacific Peltier Cooled Incubator Market Revenue, By Capacity, 2017 – 2022 (USD Million) 170
TABLE NO. 123. : Asia Pacific Peltier Cooled Incubator Market Revenue, By Capacity, 2023– 2030 (USD Million) 170
TABLE NO. 124. : Latin America Peltier Cooled Incubator Market Volume, By Country, 2017 – 2022 (K Units) 173
TABLE NO. 125. : Latin America Peltier Cooled Incubator Market Volume, By Country, 2023– 2030 (K Units) 173
TABLE NO. 126. : Latin America Peltier Cooled Incubator Market Revenue, By Country, 2017 – 2022 (USD Million) 174
TABLE NO. 127. : Latin America Peltier Cooled Incubator Market Revenue, By Country, 2023– 2030 (USD Million) 174
TABLE NO. 128. : Latin America Peltier Cooled Incubator Market Volume, By Type, 2017 – 2022 (K Units) 175
TABLE NO. 129. : Latin America Peltier Cooled Incubator Market Volume, By Type, 2023– 2030 (K Units) 175
TABLE NO. 130. : Latin America Peltier Cooled Incubator Market Revenue, By Type, 2017 – 2022 (USD Million) 176
TABLE NO. 131. : Latin America Peltier Cooled Incubator Market Revenue, By Type, 2023– 2030 (USD Million) 176
TABLE NO. 132. : Latin America Peltier Cooled Incubator Market Volume, By Application, 2017 – 2022 (K Units) 177
TABLE NO. 133. : Latin America Peltier Cooled Incubator Market Volume, By Application, 2023– 2030 (K Units) 177
TABLE NO. 134. : Latin America Peltier Cooled Incubator Market Revenue, By Application, 2017 – 2022 (USD Million) 178
TABLE NO. 135. : Latin America Peltier Cooled Incubator Market Revenue, By Application, 2023– 2030 (USD Million) 178
TABLE NO. 136. : Latin America Peltier Cooled Incubator Market Volume, By End-user, 2017 – 2022 (K Units) 179
TABLE NO. 137. : Latin America Peltier Cooled Incubator Market Volume, By End-user, 2023– 2030 (K Units) 179
TABLE NO. 138. : Latin America Peltier Cooled Incubator Market Revenue, By End-user, 2017 – 2022 (USD Million) 180
TABLE NO. 139. : Latin America Peltier Cooled Incubator Market Revenue, By End-user, 2023– 2030 (USD Million) 180
TABLE NO. 140. : Latin America Peltier Cooled Incubator Market Volume, By Technology, 2017 – 2022 (K Units) 181
TABLE NO. 141. : Latin America Peltier Cooled Incubator Market Volume, By Technology, 2023– 2030 (K Units) 181
TABLE NO. 142. : Latin America Peltier Cooled Incubator Market Revenue, By Technology, 2017 – 2022 (USD Million) 182
TABLE NO. 143. : Latin America Peltier Cooled Incubator Market Revenue, By Technology, 2023– 2030 (USD Million) 182
TABLE NO. 144. : Latin America Peltier Cooled Incubator Market Volume, By Capacity, 2017 – 2022 (K Units) 183
TABLE NO. 145. : Latin America Peltier Cooled Incubator Market Volume, By Capacity, 2023– 2030 (K Units) 183
TABLE NO. 146. : Latin America Peltier Cooled Incubator Market Revenue, By Capacity, 2017 – 2022 (USD Million) 184
TABLE NO. 147. : Latin America Peltier Cooled Incubator Market Revenue, By Capacity, 2023– 2030 (USD Million) 184
TABLE NO. 148. : Middle East Peltier Cooled Incubator Market Volume, By Country, 2017 – 2022 (K Units) 187
TABLE NO. 149. : Middle East Peltier Cooled Incubator Market Volume, By Country, 2023– 2030 (K Units) 187
TABLE NO. 150. : Middle East Peltier Cooled Incubator Market Revenue, By Country, 2017 – 2022 (USD Million) 188
TABLE NO. 151. : Middle East Peltier Cooled Incubator Market Revenue, By Country, 2023– 2030 (USD Million) 188
TABLE NO. 152. : Middle East Peltier Cooled Incubator Market Volume, By Type, 2017 – 2022 (K Units) 189
TABLE NO. 153. : Middle East Peltier Cooled Incubator Market Volume, By Type, 2023– 2030 (K Units) 189
TABLE NO. 154. : Middle East Peltier Cooled Incubator Market Revenue, By Type, 2017 – 2022 (USD Million) 190
TABLE NO. 155. : Middle East Peltier Cooled Incubator Market Revenue, By Type, 2023– 2030 (USD Million) 190
TABLE NO. 156. : Middle East Peltier Cooled Incubator Market Volume, By Application, 2017 – 2022 (K Units) 191
TABLE NO. 157. : Middle East Peltier Cooled Incubator Market Volume, By Application, 2023– 2030 (K Units) 191
TABLE NO. 158. : Middle East Peltier Cooled Incubator Market Revenue, By Application, 2017 – 2022 (USD Million) 192
TABLE NO. 159. : Middle East Peltier Cooled Incubator Market Revenue, By Application, 2023– 2030 (USD Million) 192
TABLE NO. 160. : Middle East Peltier Cooled Incubator Market Volume, By End-user, 2017 – 2022 (K Units) 193
TABLE NO. 161. : Middle East Peltier Cooled Incubator Market Volume, By End-user, 2023– 2030 (K Units) 193
TABLE NO. 162. : Middle East Peltier Cooled Incubator Market Revenue, By End-user, 2017 – 2022 (USD Million) 194
TABLE NO. 163. : Middle East Peltier Cooled Incubator Market Revenue, By End-user, 2023– 2030 (USD Million) 194
TABLE NO. 164. : Middle East Peltier Cooled Incubator Market Volume, By Technology, 2017 – 2022 (K Units) 195
TABLE NO. 165. : Middle East Peltier Cooled Incubator Market Volume, By Technology, 2023– 2030 (K Units) 195
TABLE NO. 166. : Middle East Peltier Cooled Incubator Market Revenue, By Technology, 2017 – 2022 (USD Million) 196
TABLE NO. 167. : Middle East Peltier Cooled Incubator Market Revenue, By Technology, 2023– 2030 (USD Million) 196
TABLE NO. 168. : Middle East Peltier Cooled Incubator Market Volume, By Capacity, 2017 – 2022 (K Units) 197
TABLE NO. 169. : Middle East Peltier Cooled Incubator Market Volume, By Capacity, 2023– 2030 (K Units) 197
TABLE NO. 170. : Middle East Peltier Cooled Incubator Market Revenue, By Capacity, 2017 – 2022 (USD Million) 198
TABLE NO. 171. : Middle East Peltier Cooled Incubator Market Revenue, By Capacity, 2023– 2030 (USD Million) 198
TABLE NO. 172. : Africa Peltier Cooled Incubator Market Volume, By Country, 2017 – 2022 (K Units) 201
TABLE NO. 173. : Africa Peltier Cooled Incubator Market Volume, By Country, 2023– 2030 (K Units) 201
TABLE NO. 174. : Africa Peltier Cooled Incubator Market Revenue, By Country, 2017 – 2022 (USD Million) 202
TABLE NO. 175. : Africa Peltier Cooled Incubator Market Revenue, By Country, 2023– 2030 (USD Million) 202
TABLE NO. 176. : Africa Peltier Cooled Incubator Market Volume, By Type, 2017 – 2022 (K Units) 203
TABLE NO. 177. : Africa Peltier Cooled Incubator Market Volume, By Type, 2023– 2030 (K Units) 203
TABLE NO. 178. : Africa Peltier Cooled Incubator Market Revenue, By Type, 2017 – 2022 (USD Million) 204
TABLE NO. 179. : Africa Peltier Cooled Incubator Market Revenue, By Type, 2023– 2030 (USD Million) 204
TABLE NO. 180. : Africa Peltier Cooled Incubator Market Volume, By Application, 2017 – 2022 (K Units) 205
TABLE NO. 181. : Africa Peltier Cooled Incubator Market Volume, By Application, 2023– 2030 (K Units) 205
TABLE NO. 182. : Africa Peltier Cooled Incubator Market Revenue, By Application, 2017 – 2022 (USD Million) 206
TABLE NO. 183. : Africa Peltier Cooled Incubator Market Revenue, By Application, 2023– 2030 (USD Million) 206
TABLE NO. 184. : Africa Peltier Cooled Incubator Market Volume, By End-user, 2017 – 2022 (K Units) 207
TABLE NO. 185. : Africa Peltier Cooled Incubator Market Volume, By End-user, 2023– 2030 (K Units) 207
TABLE NO. 186. : Africa Peltier Cooled Incubator Market Revenue, By End-user, 2017 – 2022 (USD Million) 208
TABLE NO. 187. : Africa Peltier Cooled Incubator Market Revenue, By End-user, 2023– 2030 (USD Million) 208
TABLE NO. 188. : Africa Peltier Cooled Incubator Market Volume, By Technology, 2017 – 2022 (K Units) 209
TABLE NO. 189. : Africa Peltier Cooled Incubator Market Volume, By Technology, 2023– 2030 (K Units) 209
TABLE NO. 190. : Africa Peltier Cooled Incubator Market Revenue, By Technology, 2017 – 2022 (USD Million) 210
TABLE NO. 191. : Africa Peltier Cooled Incubator Market Revenue, By Technology, 2023– 2030 (USD Million) 210
TABLE NO. 192. : Africa Peltier Cooled Incubator Market Volume, By Capacity, 2017 – 2022 (K Units) 211
TABLE NO. 193. : Africa Peltier Cooled Incubator Market Volume, By Capacity, 2023– 2030 (K Units) 211
TABLE NO. 194. : Africa Peltier Cooled Incubator Market Revenue, By Capacity, 2017 – 2022 (USD Million) 212
TABLE NO. 195. : Africa Peltier Cooled Incubator Market Revenue, By Capacity, 2023– 2030 (USD Million) 212