
Blowout Preventers (BOP) Market Overview:
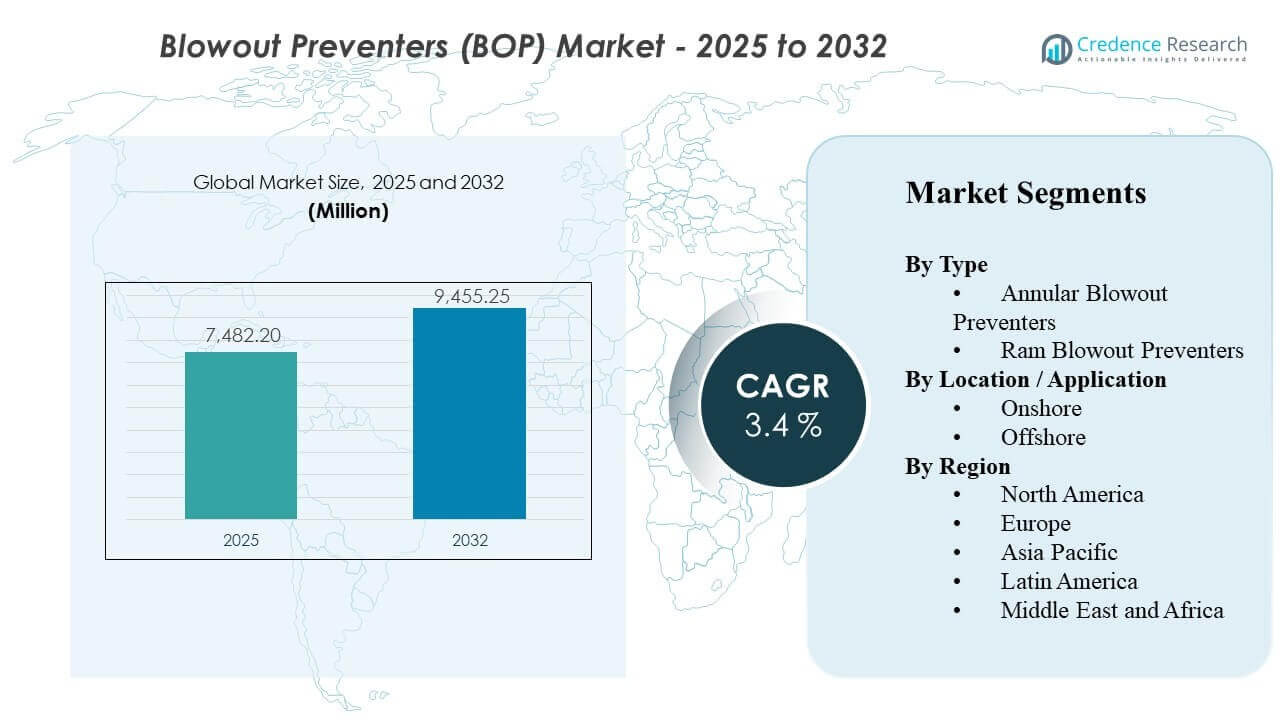
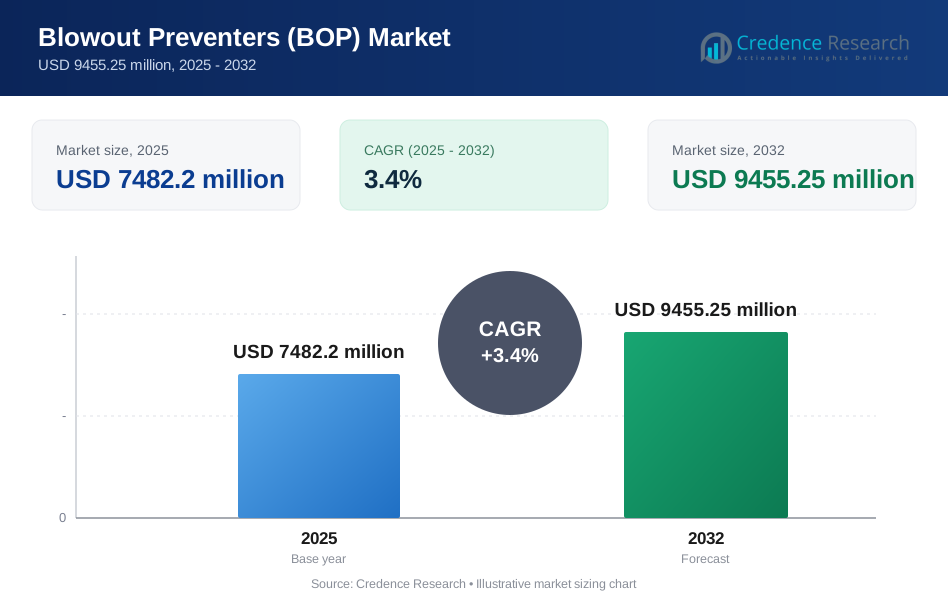
The global Blowout Preventers (BOP) Market size was estimated at USD 7482.2 million in 2025 and is expected to reach USD 9455.25 million by 2032, growing at a CAGR of 3.4% from 2025 to 2032. Expansion in offshore drilling programs and sustained investment in pressure-control infrastructure continue to support demand for blowout preventers because operators are prioritizing well integrity, safety compliance, and system reliability in complex drilling environments. Additional momentum comes from replacement demand in mature oilfields and the need for higher-specification equipment across deepwater and high-pressure applications.
| REPORT ATTRIBUTE | DETAILS |
|---|---|
| Historical Period | 2020-2024 |
| Base Year | 2025 |
| Forecast Period | 2026-2032 |
| Blowout Preventers (BOP) Market Size 2025 | USD 7482.2 million |
| Blowout Preventers (BOP) Market, CAGR | 3.4% |
| Blowout Preventers (BOP) Market Size 2032 | USD 9455.25 million |
Key Market Trends & Insights
- The Blowout Preventers (BOP) Market was valued at USD 7482.2 million in 2025 and is projected to reach USD 9455.25 million by 2032.
- The Blowout Preventers (BOP) Market is forecast to expand at a CAGR of 3.4% from 2025 to 2032.
- Ram Blowout Preventers accounted for the largest share of 48.2% in 2025, reflecting strong usage in high-pressure drilling environments.
- Onshore operations held 65.4% of market revenue in 2025, supported by the broad installed base of land drilling activity.
- North America led the regional landscape with 35.8% share in 2025, followed by Europe at 27.6% and Asia Pacific at 25.8%.
Segment Analysis
The Blowout Preventers (BOP) Market is shaped by a combination of equipment performance requirements, drilling location economics, and operational risk management priorities. Demand remains closely linked to upstream capital spending, rig activity, and the complexity of well conditions. Higher-pressure wells and deepwater developments typically require more advanced and higher-value well-control systems, which supports premium demand for robust BOP configurations. Replacement demand also plays a meaningful role because operators continue to upgrade aging fleets to improve safety, compliance, and maintenance efficiency. As drilling conditions become more complex, buyers are increasingly focused on equipment durability, sealing performance, and integration with digital monitoring systems.
Operational priorities in the Blowout Preventers (BOP) Market continue to favor products that reduce downtime and improve reliability under harsh conditions. Buyers are placing greater emphasis on lifecycle value rather than initial equipment cost alone, especially in offshore and technically demanding projects. Aftermarket services, inspection support, and refurbishment capabilities remain important differentiators because BOP performance is closely tied to maintenance quality and regulatory readiness. Procurement decisions are also influenced by pressure ratings, deployment environment, and response speed during well-control events. This keeps the market centered on engineering performance, installed-base support, and compliance-driven purchasing behavior.
By Type Insights
Ram Blowout Preventers accounted for the largest share of 48.2% in 2025. Ram systems lead because they are widely preferred in high-pressure drilling environments that require strong sealing capability and dependable shutoff performance. Operators use ram configurations extensively in both offshore and challenging onshore wells where pressure-control integrity is essential. Demand is also supported by stricter safety standards and the need for reliable performance in deeper and more complex drilling programs. The segment benefits further from its suitability for advanced well-control systems used across critical drilling and intervention operations.
By Location Insights
Onshore accounted for the largest share of 65.4% in 2025. The onshore segment leads because land drilling activity remains broader in volume than offshore projects across many producing regions. Large numbers of active and replacement wells create consistent demand for BOP installations, servicing, and refurbishment across conventional and unconventional fields. Onshore buyers also benefit from faster deployment cycles and comparatively simpler logistics than offshore operators. Continued shale and mature field development supports steady equipment demand, even as offshore projects contribute higher specification value per installation.
By Application Insights
Oil & Gas Drilling accounted for the largest share of 85.9% in 2025. This segment leads because blowout preventers are core safety systems in active drilling operations and remain mandatory for controlling unexpected pressure events. Procurement is strongly tied to rig deployment, drilling intensity, and the technical demands of deeper and higher-pressure wells. Exploration campaigns and development drilling programs both reinforce equipment demand, particularly where operators need dependable shut-in capability and compliance with strict well-control standards. The segment also benefits from ongoing investment in modernized drilling fleets and safety-focused infrastructure.
Blowout Preventers (BOP) Market Drivers
Rising Offshore and Deepwater Drilling Activity
Offshore and deepwater drilling activity continues to be a major demand driver for the Blowout Preventers (BOP) Market because these projects require highly reliable and technically advanced pressure-control systems. Deepwater wells operate under more demanding pressure conditions and require stronger well-control infrastructure than many conventional onshore sites. This raises average equipment value and supports demand for premium BOP stacks and related control systems. As offshore investment recovers across key producing basins, BOP procurement is expected to remain closely linked to project execution and subsea development activity.
Increasing Focus on Well Safety and Regulatory Compliance
Safety compliance remains central to purchasing decisions in the Blowout Preventers (BOP) Market because BOP systems serve as the first line of defense against uncontrolled well events. Operators are under continuous pressure to maintain high equipment integrity, pass inspections, and reduce the risk of operational failures. This has increased replacement cycles for older systems and reinforced demand for upgraded products with improved control, monitoring, and response performance. Strong regulatory oversight across major drilling regions continues to support long-term investment in dependable pressure-control technologies.
Ongoing Upgrades of Aging Drilling Equipment Fleets
A large installed base of aging drilling equipment is driving steady replacement and refurbishment demand in the Blowout Preventers (BOP) Market. Many operators are modernizing fleets to improve reliability, lower maintenance risk, and meet evolving performance requirements in both onshore and offshore fields. BOP upgrades are often prioritized because well-control systems directly affect operational continuity and regulatory readiness. This creates a recurring demand stream beyond new rig additions alone. The aftermarket opportunity also expands as inspection, servicing, and replacement part requirements increase across mature operating assets.
- For instance, STREICHER states that it is the only independent company in Europe holding both API 16A and API 16D licenses for well-control equipment recertification, and it says its BOP recertification work is performed to 100% API 16AR conformity, highlighting the technical depth now required in refurbishment and life-extension programs for older equipment fleets.
Growing Need for High-Performance Systems in Complex Wells
More complex drilling programs are increasing demand for advanced blowout preventers that can operate reliably in high-pressure and technically challenging environments. Horizontal wells, deeper reservoirs, and harsher offshore conditions require systems with stronger sealing capability and more precise control functionality. Buyers are therefore giving greater importance to engineering quality, redundancy, and durability during equipment selection. This trend supports demand for higher-value configurations, especially in projects where downtime or failure carries substantial financial and operational consequences. Complexity in drilling programs continues to lift the strategic importance of premium BOP solutions.
- For instance, SLB OneSubsea secured a deepwater EPC contract from PTTEP for the Kikeh 3B project in water depths of 1,300-1,400 meters, covering three subsea trees, a manifold, a subsea distribution unit, and integrated control systems, which reflects the rising preference for high-reliability equipment in technically demanding well environments.
Blowout Preventers (BOP) Market Challenges
The Blowout Preventers (BOP) Market faces persistent cost pressure because advanced systems require high upfront capital investment, rigorous inspection routines, and ongoing servicing to maintain regulatory compliance. Smaller operators may delay procurement or extend refurbishment cycles when upstream budgets tighten. The market is also exposed to volatility in oil and gas prices, which can quickly affect drilling activity and capital expenditure plans. This creates uneven order visibility for equipment suppliers and can slow replacement demand during periods of reduced exploration and development spending.
- For instance, NOV delivered two 20,000-psi subsea BOP stacks for Transocean, and its 20K lower stack includes 108 ROV panels and just under 4 miles of hard piping and tubing, which highlights the scale, integration burden, and service intensity associated with next-generation well-control equipment.
Technical complexity also remains a significant challenge for the Blowout Preventers (BOP) Market because system failure is not acceptable in critical well-control environments. Buyers expect strong performance across extreme operating conditions, which raises engineering, testing, and certification requirements for manufacturers. Long qualification cycles and strict acceptance standards can lengthen sales timelines and increase supplier costs. In addition, offshore logistics, maintenance downtime, and the need for trained service personnel make lifecycle support more demanding, particularly for international deployments and remote operating environments.
Blowout Preventers (BOP) Market Trends and Opportunities
Digitalization is becoming an important trend in the Blowout Preventers (BOP) Market as operators seek better visibility into system condition, maintenance needs, and inspection readiness. Interest is increasing in predictive maintenance tools, remote diagnostics, and control architectures that improve uptime and reduce unexpected service interruptions. These capabilities strengthen lifecycle value and help suppliers differentiate beyond core hardware performance. The shift toward smarter well-control systems also creates opportunities for vendors that can combine equipment engineering with data-enabled service solutions and long-term aftermarket support.
- For instance, Cameron's (SLB) Mark IV HA subsea BOP control system improved operational availability to as much as 98% and reduced the likelihood of a POD-related stack pull by up to 73% compared to conventional systems demonstrating how digitally integrated control architectures directly cut unplanned retrieval events.
Another important opportunity lies in offshore project expansion across deepwater basins, where more complex well conditions support demand for premium pressure-control equipment. High-specification projects typically require stronger technical support, customized configurations, and more rigorous maintenance programs. This creates room for suppliers to expand through service contracts, refurbishment programs, and integrated lifecycle offerings. Emerging offshore developments in Latin America, Asia Pacific, and selected Middle East and African markets are expected to broaden the addressable opportunity set for companies with strong engineering and field-service capabilities.
Regional Insights
North America
North America accounted for the largest share of 35.8% in 2025. Regional demand is supported by extensive upstream infrastructure, established well-control regulations, and sustained activity in the United States. The market benefits from a large installed base of drilling equipment that continues to generate replacement and servicing demand. Gulf of Mexico projects and broad land-based drilling programs strengthen procurement across both offshore and onshore environments. Strong technical service availability and aftermarket support also reinforce the region’s leading position.
Europe
Europe accounted for 27.6% of the Blowout Preventers (BOP) Market in 2025. Regional demand is supported by North Sea offshore activity, mature well-control practices, and a continued focus on safe and reliable drilling operations. Operators in the region emphasize compliance, performance consistency, and lifecycle support when selecting pressure-control systems. Demand remains concentrated in offshore developments where technical requirements are stricter and equipment quality is critical. Europe also benefits from a well-established service ecosystem and a stable base of experienced offshore operators.
Asia Pacific
Asia Pacific accounted for 25.8% of the Blowout Preventers (BOP) Market in 2025. Regional growth is supported by expanding offshore exploration, rising upstream investment, and industrial development across several energy-producing countries. Demand is increasing as operators pursue more technically demanding wells and strengthen pressure-control standards. Markets such as China, Australia, and Southeast Asia are contributing to equipment demand through a mix of offshore and land-based drilling activity. Asia Pacific also presents long-term opportunity as domestic energy programs and offshore developments continue to advance.
Latin America
Latin America accounted for 6.1% of the Blowout Preventers (BOP) Market in 2025. Regional demand is influenced mainly by offshore investment, particularly in Brazil where deepwater development supports the need for high-specification well-control systems. Procurement is generally tied to the pace of subsea and offshore project execution. The region offers meaningful opportunity because technically complex drilling programs typically require advanced BOP equipment and ongoing servicing support. Supplier participation is therefore shaped by offshore project timing, local operating conditions, and lifecycle service capability.
Middle East & Africa
Middle East & Africa accounted for 4.7% of the Blowout Preventers (BOP) Market in 2025. Regional demand is supported by upstream investment, pressure-control requirements in conventional and offshore developments, and continued focus on operational safety. Several markets in the region maintain steady drilling activity that supports procurement of reliable well-control infrastructure. Demand is also influenced by field modernization and the need to support long-life production assets with compliant equipment. Growth opportunities remain linked to upstream expansion and service support across key producing countries.
Competitive Landscape
Competition remains influenced by offshore project activity, drilling technology requirements, and customer preference for proven equipment in critical safety applications. Suppliers continue to strengthen positioning through modernization of control systems, support for predictive maintenance, and service-led customer retention strategies. The market also reflects a balance between large multinational suppliers and specialized manufacturers with strong regional or application-specific expertise. High compliance requirements and long qualification cycles continue to favor companies with established operating histories.
The Blowout Preventers (BOP) Market is characterized by competition centered on engineering reliability, pressure-handling capability, lifecycle service strength, and installed-base relationships with upstream operators. Leading participants compete through product durability, offshore suitability, control system capability, and aftermarket support rather than price alone. Market positioning is also shaped by refurbishment expertise, field-service responsiveness, and the ability to support complex drilling environments across multiple geographies. Companies with strong brand credibility and integrated service networks tend to retain advantage in high-specification projects.
Major companies operating in the Blowout Preventers (BOP) Market include
- SLB / Cameron, Baker Hughes Company,
- NOV Inc. (National Oilwell Varco)
- Weatherford International
- Halliburton
- TechnipFMC
- Dril-Quip
- Aker Solutions
- Shandong Kerui Holding Group
- Uztel S.A.
Qualitative and quantitative analysis of companies has been conducted to help clients understand the wider business environment as well as the strengths and weaknesses of key industry players. Data is qualitatively analyzed to categorize companies as pure play, category-focused, industry-focused, and diversified; it is quantitatively analyzed to categorize companies as dominant, leading, strong, tentative, and weak.
Recent Developments
- In March 2025, SLB/Cameron launched its latest Electric Well Control technology, an all-electric system that enables drillers to control and monitor BOPs onshore and offshore with real-time pressure visibility.
- In a March 2025 announcement, SLB introduced its electric well control technology for drilling operations, including a compact BOP control system that replaces conventional accumulators with an electric system to deliver continuous pressure and real-time BOP monitoring onshore and offshore. In the same update, SLB said it had also secured a front-end engineering and design contract for a custom electric well control BOP system for a North Sea operator, showing early commercial traction for the new technology.
- In a June 26, 2024 announcement, INTLEF launched its QL-type new-generation blowout preventer for large-bore, high-pressure applications. The company said the new ram BOP uses a boltless bonnet composite structure to speed bonnet opening and closing, cut replacement time, and improve operational safety and efficiency during drilling
Report Scope
| Report Attribute | Details |
| Market size value in 2025 | USD 7482.2 million |
| Revenue forecast in 2032 | USD 9455.25 million |
| Growth rate (CAGR) | 3.4% (2025–2032) |
| Base year | 2025 |
| Forecast period | 2025-2032 |
| Quantitative units | USD million |
| Segments covered | Type Outlook: Annular Blowout Preventers, Ram Blowout Preventers; Location Outlook: Onshore, Offshore; Application Outlook: Oil & Gas Drilling, Well Control / Pressure Control Operations, Exploration & Production Activities |
| Regional scope | North America, Europe, Asia Pacific, Latin America, Middle East & Africa |
| Key companies profiled | SLB / Cameron, Baker Hughes Company, NOV Inc. (National Oilwell Varco), Weatherford International, Halliburton, TechnipFMC, Dril-Quip, Aker Solutions, Shandong Kerui Holding Group, Uztel S.A. |
| No.of Pages | 324 |
Segmentation
By Type
- Annular Blowout Preventers
- Ram Blowout Preventers
By Location
- Onshore
- Offshore
By Application
- Oil & Gas Drilling
- Well Control / Pressure Control Operations
- Exploration & Production Activities
By Region
- North America
- U.S.
- Canada
- Mexico
- Europe
- Germany
- France
- U.K.
- Italy
- Spain
- Rest of Europe
- Asia Pacific
- China
- Japan
- India
- South Korea
- South-east Asia
- Rest of Asia Pacific
- Latin America
- Brazil
- Argentina
- Rest of Latin America
- Middle East & Africa
- GCC Countries
- South Africa
- Rest of the Middle East and Africa
Request a Free Sample
Fill in your details and we'll send you a free sample report.
- Sample data tables & charts
- Research methodology
Need a Custom Version of This Report?
Tailor the scope, geography, or segments to your exact requirements.
- Custom geography or segment scope
- Direct access to our analyst team
Frequently Asked Questions
What is the current size of the Blowout Preventers (BOP) Market and what is the forecast for 2032?
What is the CAGR of the Blowout Preventers (BOP) Market?
Which is the largest segment in the Blowout Preventers (BOP) Market?
What factors are driving growth in the Blowout Preventers (BOP) Market?
Who are the leading companies in the Blowout Preventers (BOP) Market?
Which region leads the Blowout Preventers (BOP) Market?
Table of Content
Chapter 1. Report Introduction
- 1.1 Report Description & Purpose
- 1.1.1 Report Title & Market Definition
- 1.1.2 Unique Selling Propositions (USP) & Key Differentiators
- 1.1.3 Value Proposition for Stakeholders
- 1.2 Research Objectives
- 1.2.1 Market Sizing Objectives (Volume & Revenue)
- 1.2.2 Segmentation Objectives
- 1.2.3 Competitive Intelligence Objectives
- 1.2.4 Forecast & Scenario Objectives
- 1.3 Report Scope
- 1.3.1 Blowout Preventers (BOP) Scope – Types & Subtypes Covered
- 1.3.2 Geographic Scope – Regions & Countries Covered
- 1.3.3 Historical Period, Base Year & Forecast Period (2025; forecast to 2032)
- 1.3.4 Inclusions & Exclusions
- 1.4 HS Code & Classification Framework
- 1.5 Currency, Units & Pricing Basis
- 1.6 Target Stakeholders
- 1.7 Limitations & Assumptions
Chapter 2. Executive Summary
- 2.1 Global Blowout Preventers (BOP) Market Snapshot
- 2.1.1 Market Size – Historical (2025) & Forecast (2025-2032) (2025: USD 7482.2 million → 2032: USD 9455.25 million)
- 2.1.2 Volume & Revenue – Global Totals
- 2.1.3 Key Market Highlights – Top Five Facts
- 2.2 Blowout Preventers (BOP) Market Segmentation Snapshot
- 2.2.1 Market Split by Region – 2025 vs. 2032
- 2.3 Competitive Snapshot
- 2.3.1 Top 10 Players by Revenue Share – 2025
- 2.3.2 Top 10 Players by Volume Share – 2025
- 2.3.3 Recent Strategic Developments (18-Month Summary)
- 2.4 Key Investment Highlights & Strategic Conclusions
Chapter 3. Blowout Preventers (BOP) Market Dynamics & Industry Analysis
- 3.1 Market Overview & Context
- 3.1.1 Blowout Preventers (BOP) Market Position in the Broader Automotive Value Chain
- 3.1.2 OEM vs. Replacement Market Dynamics
- 3.1.3 Market Maturity & Development Stage by Region
- 3.2 Blowout Preventers (BOP) Market Drivers
- 3.3 Blowout Preventers (BOP) Market Restraints & Challenges
- 3.4 Blowout Preventers (BOP) Market Opportunities
- 3.5 Porter's Five Forces Analysis
- 3.5.1 Threat of New Entrants
- 3.5.2 Bargaining Power of Suppliers
- 3.5.3 Bargaining Power of Buyers
- 3.5.4 Threat of Substitutes
- 3.5.5 Competitive Rivalry – Intensity Assessment
- 3.6 Blowout Preventers (BOP) Value Chain Analysis
- 3.6.1 Upstream – Raw Material/Input Suppliers
- 3.6.1.1 Raw Material/Input 1
- 3.6.1.2 Raw Material/Input 2
- 3.6.1.3 Raw Material/Input 3
- 3.6.2 Midstream – Production/Manufacturing/Service Delivery
- 3.6.2.1 Production/Process Overview
- 3.6.2.2 Key Facility Locations & Capacity by Manufacturer
- 3.6.3 Downstream – Distribution & End Consumer
- 3.6.3.1 Primary Channel – B2B/OEM
- 3.6.3.2 Secondary Channels – Dealer, Retail, Online, Direct
- 3.6.4 Value Chain Profitability Analysis
- 3.6.1 Upstream – Raw Material/Input Suppliers
- 3.7 PESTEL Analysis
- 3.7.1 Political Factors
- 3.7.2 Economic Factors
- 3.7.3 Social Factors
- 3.7.4 Technological Factors
- 3.7.5 Environmental Factors
- 3.7.6 Legal Factors
- 3.8 Blowout Preventers (BOP) Supply Chain Analysis
- 3.8.1 Raw Material/Input Supply Risk Assessment
- 3.8.2 Manufacturing Concentration Risk (Geographic Exposure)
- 3.8.3 Trade Disruption Impact Analysis
- 3.9 Regulatory & Policy Landscape
Note: The regulatory and policy landscape section covers regulations based on their applicability to the market, Blowout Preventers (BOP) category, geography, and scope of the study. Only regulatory frameworks with a material impact on operations, compliance, trade, sustainability, or market access are analyzed in detail.
Chapter 4. Key Investment Pockets & Opportunity Analysis
- 4.1 Blowout Preventers (BOP) Market Attractiveness Analysis
- 4.1.1 By Region – Investment Attractiveness Matrix (Volume × CAGR)
- 4.2 Absolute Revenue Growth Opportunity
- 4.2.1 By Region – Absolute USD Growth Through 2032
- 4.3 Incremental Volume Opportunity
- 4.3.1 By Region – Incremental Volume Through 2032
- 4.3.2 Segment – Incremental Volume
- 4.4 Emerging Submarket Opportunity Deep Dive (Subject to Applicability)
- 4.5 Emerging Market Opportunity Scorecards
- 4.5.1 United States
- 4.5.2 Europe
- 4.5.3 Asia
- 4.5.4 Middle East & Africa
Note: Emerging Market Opportunity Scorecards will be included based on relevance and strategic importance. Regions listed are indicative and may vary depending on data availability and market dynamics.
Chapter 5. Blowout Preventers (BOP) Import-Export Analysis & Trade Flows
- 5.1 Global Trade Overview
- 5.1.1 Global Export Value by Country (2025)
- 5.1.2 Global Export Volume by Country (2025)
- 5.1.3 Global Import Value by Country (2025)
- 5.1.4 Global Import Volume by Country (2025)
- 5.1.5 Net Trade Balance by Country (2025)
- 5.2 Export Analysis – Segment
- 5.2.1 Type 1 (HS Code)
- 5.2.2 Type 2 (HS Code)
- 5.2.3 Type 3 (HS Code)
- 5.2.4 Type 4 (HS Code)
- 5.2.5 Type 5 (HS Code)
- 5.3 Import Analysis – Segment
- 5.3.1 Type 1 (HS Code)
- 5.3.2 Type 2 (HS Code)
- 5.3.3 Type 3 (HS Code)
- 5.3.4 Type 4 (HS Code)
- 5.3.5 Type 5 (HS Code)
- 5.4 Average Unit Trade Prices
- 5.4.1 Average Export Price – Segment & Country
- 5.4.2 Average Import Price – Segment & Source Country
- 5.4.3 Price Trends (2025)
- 5.5 Key Trade Route Analysis
- 5.5.1 Trade Route 1
- 5.5.2 Trade Route 2
- 5.5.3 Trade Route 3
- 5.5.4 Trade Route 4
- 5.5.5 Trade Route 5
- 5.6 Trade Policy Impact Assessment
- 5.6.1 US Anti-Dumping & Section 301 Tariffs
- 5.6.2 EU Customs Union Impact
- 5.6.3 Major Free Trade Agreements
- 5.6.4 USMCA Rules of Origin
Note: Trade policy analysis will be included only where relevant to the Blowout Preventers (BOP) market.
Chapter 6. Competitive Landscape & Company Benchmarking
- 6.1 Blowout Preventers (BOP) Market Concentration & Structure
- 6.1.1 Herfindahl-Hirschman Index (HHI) – vs. 2025
- 6.1.2 Tier 1, Tier 2 & Tier 3 Market Structure
- 6.1.3 Global, Regional & Local Player Dynamics
- 6.2 Blowout Preventers (BOP) Market Share Analysis – 2025
- 6.2.1 Global Revenue Share by Company
- 6.2.2 Global Volume Share by Company
- 6.2.3 Regional Revenue Share
- 6.2.4 Market Share Evolution ( vs. 2025)
- 6.2.5 OEM Segment Share by Company
- 6.2.6 Replacement Segment Share by Company
- 6.3 Production/Delivery Capacity & Facility Analysis
- 6.3.1 Global Installed Capacity
- 6.3.2 Capacity Utilization Rates
- 6.3.3 Production/Output Volume
- 6.3.4 Facility Locations & Capacity Map
- 6.3.5 Planned Capacity Additions
- 6.4 Blowout Preventers (BOP) Competitive Benchmarking Matrix
- 6.4.1 Revenue, Volume, CAGR & Profitability Comparison
- 6.4.2 Channel Revenue Mix
- 6.4.3 Geographic Revenue Exposure
- 6.4.4 R&D Intensity
- 6.4.5 Sustainability Maturity
- 6.5 Strategic Developments in Blowout Preventers (BOP) (Last 24 Months)
- 6.5.1 Mergers, Acquisitions & Divestments
- 6.5.2 New Blowout Preventers (BOP) Launches
- 6.5.3 Facility Expansions
- 6.5.4 Strategic Alliances, Joint Ventures & Partnerships
- 6.5.5 Distribution Expansion & Market Entry
- 6.5.6 Sustainability & ESG Initiatives
- 6.6 Competitive Strategy Mapping
- 6.6.1 Leader, Challenger, Follower & Niche Classification
- 6.6.2 Pricing Strategy Comparison
- 6.6.3 Channel Strategy Matrix
Note: Strategic developments are included based on their materiality and the availability of reliable information.
Chapter 7. Global Blowout Preventers (BOP) Market – By Distribution Channel
- 7.1 Segment Overview
- 7.1.1 Volume & Revenue Split by Channel (2025 & 2032)
- 7.1.2 Channel Mix Evolution (2025-2032)
Chapter 8. Regional Market Analysis – Global Overview
- 8.1 Global Regional Overview
- 8.1.1 Regional Volume Share
- 8.1.2 Regional Revenue Share
- 8.1.3 Regional Volume by Region
- 8.1.4 Regional Revenue by Region
- 8.1.5 Regional Forecast Through 2032
- 8.2 Cross-Regional Segment Analysis
- 8.2.1 By Distribution Channel
- 8.2.2 By Brand/Price Tier
Chapter 9. North America Blowout Preventers (BOP) Market
- 9.1 United States
- 9.2 Canada
- 9.3 Mexico
Chapter 10. Europe Blowout Preventers (BOP) Market
- 10.1 Germany
- 10.2 France
- 10.3 Italy
- 10.4 United Kingdom
- 10.5 Spain
- 10.6 Poland
- 10.7 Russia
- 10.8 Netherlands
- 10.9 Belgium
- 10.10 Sweden
- 10.11 Denmark
- 10.12 Norway
- 10.13 Rest of Europe
Chapter 11. Asia Pacific Blowout Preventers (BOP) Market
- 11.1 China
- 11.2 India
- 11.3 Japan
- 11.4 South Korea
- 11.5 Thailand
- 11.6 Indonesia
- 11.7 Vietnam
- 11.8 Malaysia
- 11.9 Australia
- 11.10 Rest of Asia Pacific
Chapter 12. Latin America Blowout Preventers (BOP) Market
- 12.1 Brazil
- 12.2 Argentina
- 12.3 Colombia
- 12.4 Chile
- 12.5 Rest of Latin America
Chapter 13. Middle East Blowout Preventers (BOP) Market
- 13.1 Saudi Arabia
- 13.2 United Arab Emirates
- 13.3 Turkey
- 13.4 Israel
- 13.5 Iran
- 13.6 Rest of the Middle East
Chapter 14. Africa Blowout Preventers (BOP) Market
- 14.1 South Africa
- 14.2 Egypt
- 14.3 Nigeria
- 14.4 Morocco
- 14.5 Rest of Africa
Chapter 15. Blowout Preventers (BOP) Company Profiles
- 15.1 [Company 01]
- 15.1.1 Company Overview
- 15.1.2 Key Management Personnel
- 15.1.3 Products & Services Portfolio
- 15.1.4 Financial Performance
- 15.1.5 Key Market Focus & Geographic Presence
- 15.1.6 Recent Developments & Strategic Initiatives
Note: The company profile list is preliminary and may change based on research findings, market developments, data availability, and client requirements.
Chapter 16. Appendices
- Appendix A – List of Abbreviations & Acronyms
- Appendix B – Industry Classification Code Reference – Full Series
- Appendix C – Production & Capacity Data Tables
- Appendix D – End-Use & Demand Base Tables
- Appendix E – Consumption & Replacement Rate Assumptions
- Appendix F – ASP Reference Tables
- Appendix G – Manufacturing & Facility Database
- Appendix H – Import-Export Data Tables
- Appendix I – Regulatory Summary Tables
- Appendix J – Primary Research Participant List (Anonymized)
- Appendix K – Primary Research Questionnaire Framework
- Appendix L – Data Sources & Bibliography
- Appendix M – Market Size Divergence & Source Comparison
Chapter 17. Research Methodology
- 17.1 Research Framework & Philosophy
- 17.2 Secondary Research – Sources, Hierarchy & Data Extraction
- 17.3 Data Modeling – Bottom-Up & Top-Down Market Sizing
- 17.4 Primary Research – Stakeholder Framework, LOI & Sample Sizes
- 17.5 Forecast Methodology – Regression, Scenario & Sensitivity Analysis
- 17.6 Quality Control – Four-Layer Validation Framework
- 17.7 Limitations & Standard Assumptions
- 17.8 Disclaimer
