
Submerged Arc Furnace Market Overview:
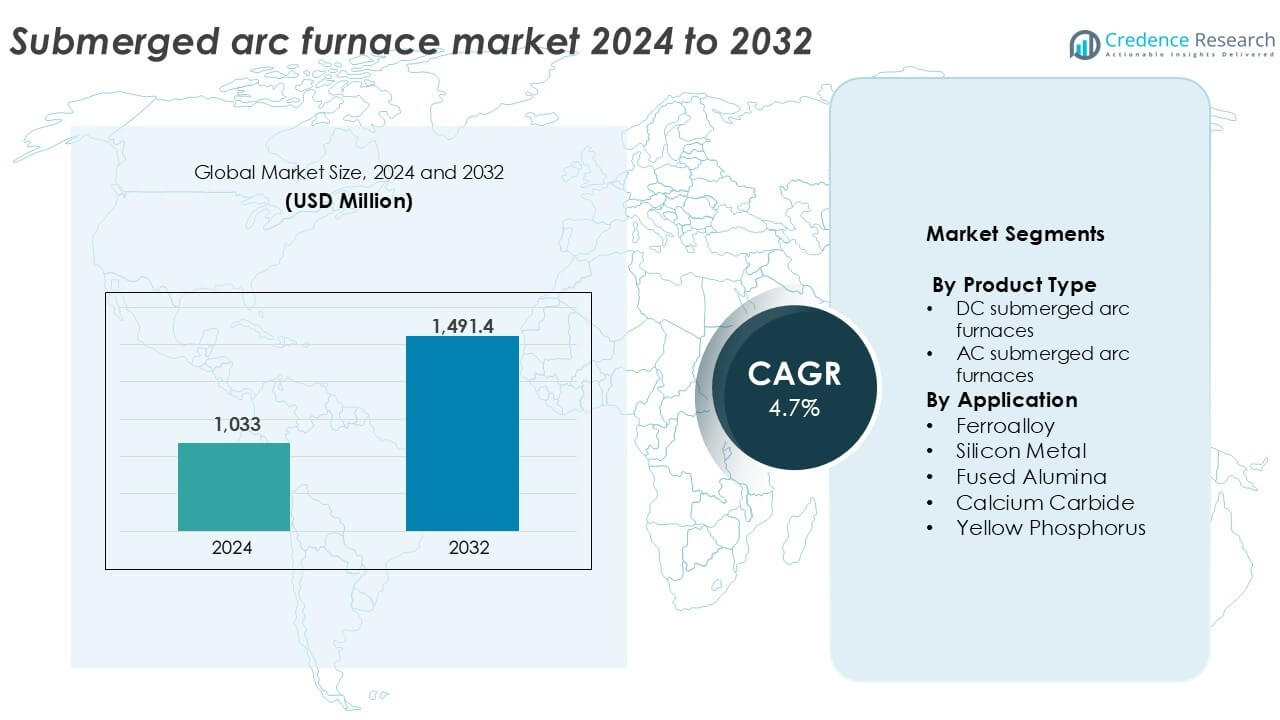
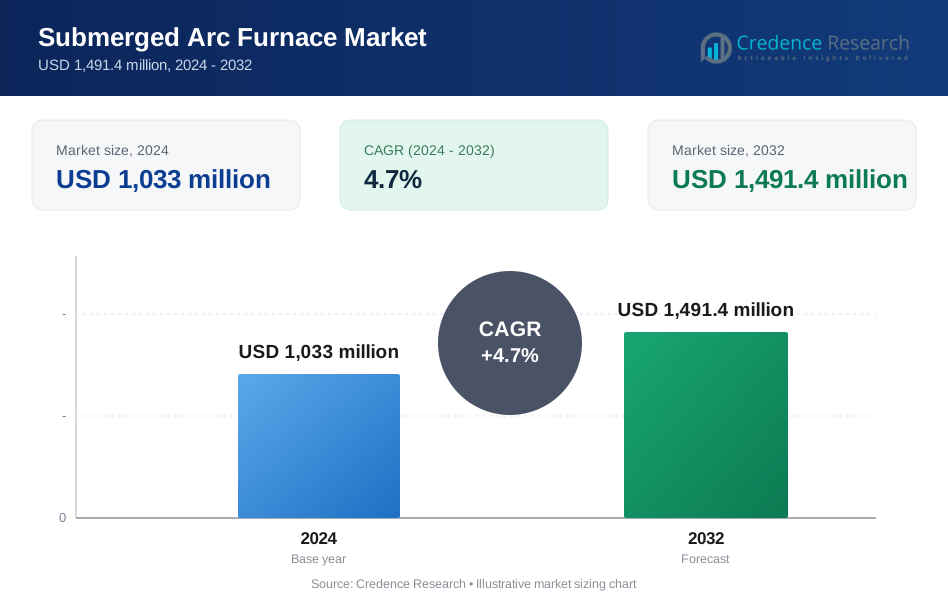
The Submerged Arc Furnace market size was valued at USD 1,033 million in 2024 and is anticipated to reach USD 1,491.4 million by 2032, growing at a CAGR of 4.7% during the forecast period.
| REPORT ATTRIBUTE | DETAILS |
|---|---|
| Historical Period | 2020-2023 |
| Base Year | 2024 |
| Forecast Period | 2025-2032 |
| Submerged Arc Furnace Market Size 2024 | USD 1,033 million |
| Submerged Arc Furnace Market, CAGR | 4.7% |
| Submerged Arc Furnace Market Size 2032 | USD 1,491.4 million |
Submerged Arc Furnace Market Insights
- Market growth is driven by rising demand for ferroalloys and silicon metal in steelmaking, solar, and battery applications, particularly across Asia Pacific and Latin America.
- Key trends include the adoption of energy-efficient, digitally controlled SAFs and vertical integration among ferroalloy producers to reduce operational costs and ensure supply stability.
- Competition is led by SMS Group, Tenova, Danieli, and Primetals Technologies, while regional players like Electrotherm and Doshi Technologies serve cost-sensitive markets with compact solutions.
- Asia Pacific holds over 50% market share, led by China and India, while Europe contributes around 18%; the ferroalloy segment dominates application share with more than 45% due to high steel output.
Submerged Arc Furnace Market Segmentation Analysis:
By Product Type
AC submerged arc furnaces dominate the product type segment, accounting for over 65% of the global market share in 2024. Their established presence in large-scale metallurgical operations, cost efficiency, and adaptability to various ferroalloy processes drive demand. AC furnaces support high-capacity production and are widely used in mature markets, including Asia and Europe. Meanwhile, DC submerged arc furnaces gain traction in applications requiring precise thermal control and reduced electrode consumption. Their adoption is rising in silicon metal and specialty alloy production due to better energy efficiency and stable arc operation under varying loads.
- For instance, SMS group has supplied AC submerged arc furnaces with transformer ratings above 100 MVA for ferroalloy plants operating in China and Norway.
By Application
The ferroalloy segment holds the largest share in the application segment, contributing more than 45% of the global market in 2024. Growing stainless steel and carbon steel output across China, India, and Brazil supports steady furnace demand. The silicon metal segment follows, driven by rising use in solar photovoltaics, semiconductors, and aluminum alloys. Fused alumina and calcium carbide segments also show healthy growth, supported by construction and chemicals industries. Yellow phosphorus applications remain niche, but consistent in fertilizer and flame retardant production, ensuring continued usage of submerged arc furnaces in specific geographic markets.
- For instance, Elkem runs SAF-based silicon plants with single-furnace capacities exceeding 75,000 tons per year, serving solar and aluminum markets.
Key Growth Drivers
Rising Demand for Ferroalloys in Steelmaking
Global steel production continues to expand, especially in Asia-Pacific and Latin America, creating strong demand for ferroalloys such as ferromanganese, ferrochrome, and ferrosilicon. Submerged arc furnaces (SAFs) are the preferred technology for bulk ferroalloy production due to their high energy efficiency and suitability for continuous large-scale operations. Rapid infrastructure growth and automotive manufacturing in countries like China and India boost steel consumption, indirectly accelerating SAF installations. Additionally, the shift toward electric arc furnace (EAF)-based steelmaking further strengthens SAF demand, as ferroalloys are essential additives in EAF operations. Government-backed infrastructure development projects and growing renewable energy capacity also push alloy demand, especially in wind and solar energy components.
- For instance, Tata Steel sources ferromanganese and ferrosilicon from SAF-based units supporting crude steel capacity above 35 million tons per year.
Expansion of Silicon Metal Applications
Silicon metal is gaining significant traction in solar photovoltaics, semiconductors, aluminum alloys, and lithium-ion batteries. Submerged arc furnaces remain essential for converting quartz and carbonaceous materials into metallurgical-grade silicon. The global solar energy transition drives consistent silicon consumption for photovoltaic cells, especially in China, which dominates the solar manufacturing chain. Rising electric vehicle (EV) adoption also boosts demand for silicon-enhanced aluminum and battery components. With governments worldwide supporting decarbonization goals, investments in silicon metal capacity are surging, translating to higher furnace demand. SAFs’ ability to operate continuously at high temperatures with minimal operational interruptions makes them ideal for large-volume silicon metal production.
- For instance, Elkem’s Salten plant in Norway operates submerged arc furnaces converting quartz to metallurgical silicon for photovoltaic use. Solar manufacturing growth lifts silicon
Industrialization in Emerging Economies
Emerging markets in Southeast Asia, Africa, and South America are witnessing a wave of industrialization across mining, metallurgy, and infrastructure sectors. This structural transformation increases demand for ferroalloys, calcium carbide, and fused minerals, directly impacting SAF adoption. Local governments support industrial clusters and special economic zones with incentives for downstream processing. Countries rich in mineral reserves, such as South Africa (manganese) and Brazil (bauxite), invest in value addition within their borders. Submerged arc furnaces provide a cost-effective method for converting raw ores into higher-value intermediate products. Furthermore, the need for self-sufficiency in metal and chemical production encourages regional players to deploy SAFs in new processing plants.
Key Trends & Opportunities
Shift Toward Energy-Efficient and Digital SAFs
Manufacturers increasingly adopt advanced submerged arc furnaces equipped with digital monitoring, real-time data analysis, and automated control systems. These smart SAFs improve productivity, reduce electrode consumption, and enhance safety. Energy optimization features like waste heat recovery and variable frequency drives gain popularity amid rising energy prices and stricter environmental regulations. European and Japanese companies lead innovation in green and energy-efficient SAFs, while developing nations explore retrofit opportunities. As decarbonization pressure rises, operators seek technologies that reduce specific energy consumption without compromising output. This digital transition presents a clear opportunity for OEMs offering automation-ready and eco-friendly SAF solutions.
- For instance, SMS group has deployed digital SAF control platforms that enable continuous tracking of furnace current, voltage, and electrode position across furnaces rated above 90 MVA.
Vertical Integration by Ferroalloy Producers
Major ferroalloy producers are increasingly investing in integrated operations, including mining, smelting, and downstream alloy processing. This trend boosts demand for in-house SAF installations to improve supply chain control and reduce reliance on third-party processors. Companies in China, India, and the Middle East are leading this push, using SAFs to ensure consistent quality and cost control across operations. Vertical integration also helps producers respond faster to market fluctuations and regulatory changes. By investing in customized furnace solutions, operators can optimize output for specific alloy grades, opening opportunities for specialized SAF system suppliers and engineering firms.
Key Challenges
High Capital and Operational Costs
Submerged arc furnaces require significant upfront investment in infrastructure, refractory materials, and power systems. For many small and medium enterprises (SMEs), the capital intensity remains a major barrier. Operational costs are also high, particularly due to large electricity requirements and periodic maintenance. Fluctuations in electrode pricing and raw material costs further impact profitability. Regions with high power tariffs face slower SAF adoption, especially in non-integrated facilities. Additionally, environmental compliance—such as fume collection and waste handling—adds to overall cost. These financial hurdles restrict entry of new players and delay upgrades of older furnace units.
Environmental and Regulatory Pressure
Submerged arc furnace operations emit significant levels of dust, CO₂, and other particulates, especially when processing carbon-rich feedstock. With tightening emission norms and industrial decarbonization goals, operators face growing regulatory pressure to invest in cleaner technologies and pollution control systems. Compliance often requires expensive upgrades, such as advanced baghouse filters and off-gas treatment systems. In regions with strict environmental norms like the EU, older furnaces are being phased out or retrofitted. For new entrants or operators in developing countries, balancing cost with regulatory demands remains a key challenge that affects the overall growth pace of the market.
Regional Analysis
Asia Pacific
Asia Pacific leads the submerged arc furnace market, holding over 50% of the global market share in 2024. China, India, and South Korea dominate regional demand due to strong steel, silicon metal, and ferroalloy production. Rapid industrialization, urban infrastructure development, and large-scale metal exports fuel continued furnace adoption. China’s dominance in solar PV and EV supply chains supports high silicon output, driving SAF utilization. India’s growing ferroalloy exports and infrastructure investments further boost installations. Government initiatives favoring domestic manufacturing and metallurgical self-sufficiency enhance the region’s long-term market potential.
Europe
Europe holds around 18% of the global submerged arc furnace market, supported by mature steel and specialty alloy industries. Countries like Germany, France, and Norway lead in energy-efficient and advanced SAF technologies. Strict emission regulations drive retrofitting and modernization of existing units, while R&D investments promote digital SAF integration. The region also shows steady demand for silicon metal in renewable energy and semiconductors. While growth is moderate compared to Asia, Europe maintains technological leadership and focuses on sustainable production practices, which supports high-margin opportunities for advanced SAF systems.
North America
North America accounts for approximately 15% of the global SAF market in 2024, with the U.S. as the key contributor. The region benefits from integrated steel plants, growing infrastructure renewal, and rising silicon demand for electronics and solar. Strategic reshoring of semiconductor supply chains also boosts local SAF installations. North America emphasizes energy-efficient furnaces and compliance with emission norms, encouraging the adoption of upgraded systems. Continued investment in automation and safety features within metallurgical operations helps sustain demand. However, the market faces moderate growth due to limited new capacity expansion.
Latin America
Latin America captures about 9% of the global submerged arc furnace market, driven primarily by Brazil, Argentina, and Chile. Brazil leads in ferroalloy production due to abundant manganese and chromite reserves. Ongoing investments in mining and steel industries drive SAF installations across the region. Local production of calcium carbide and silicon for agriculture and chemical sectors adds to market momentum. However, high electricity costs and political uncertainties in some countries may limit furnace adoption. Overall, the region offers growth potential due to its raw material availability and growing domestic consumption.
Middle East & Africa
The Middle East & Africa region holds nearly 8% of the global SAF market in 2024. South Africa dominates ferroalloy production, particularly ferromanganese and ferrochrome, due to rich mineral reserves. GCC countries invest in metallurgical industries as part of economic diversification efforts, boosting furnace demand. SAF adoption grows across industrial clusters in UAE and Saudi Arabia, particularly for fused alumina and silicon metal. However, infrastructure gaps and energy pricing disparities in some African nations limit widespread deployment. Regional expansion will rely on improved power access, economic stability, and industrial policy support.
Submerged Arc Furnace Market Segmentations:
By Product Type
- DC submerged arc furnaces
- AC submerged arc furnaces
By Application
- Ferroalloy
- Silicon Metal
- Fused Alumina
- Calcium Carbide
- Yellow Phosphorus
By Geography
- North America
- U.S.
- Canada
- Mexico
- Europe
- Germany
- France
- U.K.
- Italy
- Spain
- Rest of Europe
- Asia Pacific
- China
- Japan
- India
- South Korea
- South-east Asia
- Rest of Asia Pacific
- Latin America
- Brazil
- Argentina
- Rest of Latin America
- Middle East & Africa
- GCC Countries
- South Africa
- Rest of the Middle East and Africa
Competitive Landscape
The submerged arc furnace market features a mix of global engineering firms and regional technology providers competing on design innovation, energy efficiency, and custom furnace solutions. Leading players such as SMS Group, Tenova, Danieli, and Primetals Technologies hold significant market share through turnkey project capabilities and global deployment networks. Companies like Metso Outotec, Paul Wurth, and Hatch focus on process integration and advanced metallurgical design. Electrotherm and Doshi Technologies serve cost-sensitive markets in Asia with compact and mid-scale SAF units. Innovation centers around automation, digital control systems, and environmentally compliant designs. Strategic partnerships and after-sales service offerings enhance market positioning. Growing demand for silicon metal, ferroalloys, and fused minerals drives technology licensing and capacity expansion, particularly in Asia-Pacific and Africa. Competitors increasingly invest in R&D to reduce electrode wear, improve energy efficiency, and enable higher throughput, while maintaining operational safety and regulatory compliance across diverse industrial environments.
Key Player Analysis
- Thermtronix
- Xi’an Abundance Electric Technology
- Hatch
- Doshi Technologies
- Siemens
- SMS Group
- Outotec Oyj
- Paul Wurth
- Shanghai Electric
- Primetals Technologies
- Tenova
- Electrotherm
- Metso Outotec
- Thyssenkrupp Industrial
- Danieli
Recent Developments
- In July 2025, Thyssenkrupp Industrial launched a new high-tech facility at their production site in Duisburg, Germany. With investment of around €800 million the facility is poised to modernize the company’s production lines and automate the process. This new automated facility will help the company in maintaining its position as key player of the market.
- In October 2024, Tenova entered into a signed contract with Tata Steel for installation of an arc furnace in its Port Talbot facility in Wales. The furnace is poised to be operational by end of 2027 and is expected to boost production facility of Tata Steel in the Western Europe region.
- In January 2024, Metso received a major order from FACOR (Ferro Alloys Corporation Limited) for its plant in Bhadrak, Odisha, India. The deal includes two 75MVA submerged arc furnaces with preheating technology for smelting applications, alongside a 6-meter-wide sintering plant. These furnaces are expected to provide a combined output of approximately 300,000 tons of ferrochrome per year.
Report Coverage
The research report offers an in-depth analysis based on Product Type, Application and Geography. It details leading market players, providing an overview of their business, product offerings, investments, revenue streams, and key applications. Additionally, the report includes insights into the competitive environment, SWOT analysis, current market trends, as well as the primary drivers and constraints. Furthermore, it discusses various factors that have driven market expansion in recent years. The report also explores market dynamics, regulatory scenarios, and technological advancements that are shaping the industry. It assesses the impact of external factors and global economic changes on market growth. Lastly, it provides strategic recommendations for new entrants and established companies to navigate the complexities of the market.
Future Outlook
- Submerged arc furnace adoption will grow steadily with rising ferroalloy and silicon metal demand.
- Asia Pacific will remain the dominant market due to strong industrial and steel sector expansion.
- Energy-efficient and low-emission furnace technologies will see increased investment and deployment.
- Digital control systems and automation will become standard features in new SAF installations.
- Emerging economies in Africa and Southeast Asia will offer new growth opportunities for mid-scale SAF units.
- Integration of waste heat recovery systems will improve operational efficiency across modern SAF setups.
- Growing use of SAFs in renewable energy material production will support long-term market expansion.
- Retrofitting of older furnaces to meet stricter environmental regulations will drive aftermarket demand.
- Strategic partnerships between furnace makers and alloy producers will accelerate customized furnace development.
- Demand for compact and modular SAFs will rise in regions with limited infrastructure and power supply.
Request a Free Sample
Fill in your details and we'll send you a free sample report.
- Sample data tables & charts
- Research methodology
Need a Custom Version of This Report?
Tailor the scope, geography, or segments to your exact requirements.
- Custom geography or segment scope
- Direct access to our analyst team
Frequently Asked Questions
What is the current market size for the Submerged arc furnace market, and what is its projected size in 2032?
At what Compound Annual Growth Rate is the Submerged arc furnace market projected to grow between 2024 and 2032?
Which Submerged arc furnace market segment held the largest share in 2024?
What are the primary factors fueling the growth of the Submerged arc furnace market?
Who are the leading companies in the Submerged arc furnace market?
Which region commanded the largest share of the Submerged arc furnace market in 2024?
Table of Content
Chapter 1. Report Introduction
- 1.1 Report Description & Purpose
- 1.1.1 Report Title & Market Definition
- 1.1.2 Unique Selling Propositions (USP) & Key Differentiators
- 1.1.3 Value Proposition for Stakeholders
- 1.2 Research Objectives
- 1.2.1 Market Sizing Objectives (Volume & Revenue)
- 1.2.2 Segmentation Objectives
- 1.2.3 Competitive Intelligence Objectives
- 1.2.4 Forecast & Scenario Objectives
- 1.3 Report Scope
- 1.3.1 Submerged Arc Furnace Scope – Types & Subtypes Covered
- 1.3.2 Geographic Scope – Regions & Countries Covered
- 1.3.3 Historical Period, Base Year & Forecast Period (2024; forecast to 2032)
- 1.3.4 Inclusions & Exclusions
- 1.4 HS Code & Classification Framework
- 1.5 Currency, Units & Pricing Basis
- 1.6 Target Stakeholders
- 1.7 Limitations & Assumptions
Chapter 2. Executive Summary
- 2.1 Global Submerged Arc Furnace Market Snapshot
- 2.1.1 Market Size – Historical (2024) & Forecast (2024-2032) (2024: USD 1,033 million → 2032: USD 1,491.4 million)
- 2.1.2 Volume & Revenue – Global Totals
- 2.1.3 Key Market Highlights – Top Five Facts
- 2.2 Submerged Arc Furnace Market Segmentation Snapshot
- 2.2.1 Market Split by Region – 2024 vs. 2032
- 2.3 Competitive Snapshot
- 2.3.1 Top 10 Players by Revenue Share – 2024
- 2.3.2 Top 10 Players by Volume Share – 2024
- 2.3.3 Recent Strategic Developments (18-Month Summary)
- 2.4 Key Investment Highlights & Strategic Conclusions
Chapter 3. Submerged Arc Furnace Market Dynamics & Industry Analysis
- 3.1 Market Overview & Context
- 3.1.1 Submerged Arc Furnace Market Position in the Broader Automotive Value Chain
- 3.1.2 OEM vs. Replacement Market Dynamics
- 3.1.3 Market Maturity & Development Stage by Region
- 3.2 Submerged Arc Furnace Market Drivers
- 3.3 Submerged Arc Furnace Market Restraints & Challenges
- 3.4 Submerged Arc Furnace Market Opportunities
- 3.5 Porter's Five Forces Analysis
- 3.5.1 Threat of New Entrants
- 3.5.2 Bargaining Power of Suppliers
- 3.5.3 Bargaining Power of Buyers
- 3.5.4 Threat of Substitutes
- 3.5.5 Competitive Rivalry – Intensity Assessment
- 3.6 Submerged Arc Furnace Value Chain Analysis
- 3.6.1 Upstream – Raw Material/Input Suppliers
- 3.6.1.1 Raw Material/Input 1
- 3.6.1.2 Raw Material/Input 2
- 3.6.1.3 Raw Material/Input 3
- 3.6.2 Midstream – Production/Manufacturing/Service Delivery
- 3.6.2.1 Production/Process Overview
- 3.6.2.2 Key Facility Locations & Capacity by Manufacturer
- 3.6.3 Downstream – Distribution & End Consumer
- 3.6.3.1 Primary Channel – B2B/OEM
- 3.6.3.2 Secondary Channels – Dealer, Retail, Online, Direct
- 3.6.4 Value Chain Profitability Analysis
- 3.6.1 Upstream – Raw Material/Input Suppliers
- 3.7 PESTEL Analysis
- 3.7.1 Political Factors
- 3.7.2 Economic Factors
- 3.7.3 Social Factors
- 3.7.4 Technological Factors
- 3.7.5 Environmental Factors
- 3.7.6 Legal Factors
- 3.8 Submerged Arc Furnace Supply Chain Analysis
- 3.8.1 Raw Material/Input Supply Risk Assessment
- 3.8.2 Manufacturing Concentration Risk (Geographic Exposure)
- 3.8.3 Trade Disruption Impact Analysis
- 3.9 Regulatory & Policy Landscape
Note: The regulatory and policy landscape section covers regulations based on their applicability to the market, Submerged Arc Furnace category, geography, and scope of the study. Only regulatory frameworks with a material impact on operations, compliance, trade, sustainability, or market access are analyzed in detail.
Chapter 4. Key Investment Pockets & Opportunity Analysis
- 4.1 Submerged Arc Furnace Market Attractiveness Analysis
- 4.1.1 By Region – Investment Attractiveness Matrix (Volume × CAGR)
- 4.2 Absolute Revenue Growth Opportunity
- 4.2.1 By Region – Absolute USD Growth Through 2032
- 4.3 Incremental Volume Opportunity
- 4.3.1 By Region – Incremental Volume Through 2032
- 4.3.2 Segment – Incremental Volume
- 4.4 Emerging Submarket Opportunity Deep Dive (Subject to Applicability)
- 4.5 Emerging Market Opportunity Scorecards
- 4.5.1 United States
- 4.5.2 Europe
- 4.5.3 Asia
- 4.5.4 Middle East & Africa
Note: Emerging Market Opportunity Scorecards will be included based on relevance and strategic importance. Regions listed are indicative and may vary depending on data availability and market dynamics.
Chapter 5. Submerged Arc Furnace Import-Export Analysis & Trade Flows
- 5.1 Global Trade Overview
- 5.1.1 Global Export Value by Country (2024)
- 5.1.2 Global Export Volume by Country (2024)
- 5.1.3 Global Import Value by Country (2024)
- 5.1.4 Global Import Volume by Country (2024)
- 5.1.5 Net Trade Balance by Country (2024)
- 5.2 Export Analysis – Segment
- 5.2.1 Type 1 (HS Code)
- 5.2.2 Type 2 (HS Code)
- 5.2.3 Type 3 (HS Code)
- 5.2.4 Type 4 (HS Code)
- 5.2.5 Type 5 (HS Code)
- 5.3 Import Analysis – Segment
- 5.3.1 Type 1 (HS Code)
- 5.3.2 Type 2 (HS Code)
- 5.3.3 Type 3 (HS Code)
- 5.3.4 Type 4 (HS Code)
- 5.3.5 Type 5 (HS Code)
- 5.4 Average Unit Trade Prices
- 5.4.1 Average Export Price – Segment & Country
- 5.4.2 Average Import Price – Segment & Source Country
- 5.4.3 Price Trends (2024)
- 5.5 Key Trade Route Analysis
- 5.5.1 Trade Route 1
- 5.5.2 Trade Route 2
- 5.5.3 Trade Route 3
- 5.5.4 Trade Route 4
- 5.5.5 Trade Route 5
- 5.6 Trade Policy Impact Assessment
- 5.6.1 US Anti-Dumping & Section 301 Tariffs
- 5.6.2 EU Customs Union Impact
- 5.6.3 Major Free Trade Agreements
- 5.6.4 USMCA Rules of Origin
Note: Trade policy analysis will be included only where relevant to the Submerged Arc Furnace market.
Chapter 6. Competitive Landscape & Company Benchmarking
- 6.1 Submerged Arc Furnace Market Concentration & Structure
- 6.1.1 Herfindahl-Hirschman Index (HHI) – vs. 2024
- 6.1.2 Tier 1, Tier 2 & Tier 3 Market Structure
- 6.1.3 Global, Regional & Local Player Dynamics
- 6.2 Submerged Arc Furnace Market Share Analysis – 2024
- 6.2.1 Global Revenue Share by Company
- 6.2.2 Global Volume Share by Company
- 6.2.3 Regional Revenue Share
- 6.2.4 Market Share Evolution ( vs. 2024)
- 6.2.5 OEM Segment Share by Company
- 6.2.6 Replacement Segment Share by Company
- 6.3 Production/Delivery Capacity & Facility Analysis
- 6.3.1 Global Installed Capacity
- 6.3.2 Capacity Utilization Rates
- 6.3.3 Production/Output Volume
- 6.3.4 Facility Locations & Capacity Map
- 6.3.5 Planned Capacity Additions
- 6.4 Submerged Arc Furnace Competitive Benchmarking Matrix
- 6.4.1 Revenue, Volume, CAGR & Profitability Comparison
- 6.4.2 Channel Revenue Mix
- 6.4.3 Geographic Revenue Exposure
- 6.4.4 R&D Intensity
- 6.4.5 Sustainability Maturity
- 6.5 Strategic Developments in Submerged Arc Furnace (Last 24 Months)
- 6.5.1 Mergers, Acquisitions & Divestments
- 6.5.2 New Submerged Arc Furnace Launches
- 6.5.3 Facility Expansions
- 6.5.4 Strategic Alliances, Joint Ventures & Partnerships
- 6.5.5 Distribution Expansion & Market Entry
- 6.5.6 Sustainability & ESG Initiatives
- 6.6 Competitive Strategy Mapping
- 6.6.1 Leader, Challenger, Follower & Niche Classification
- 6.6.2 Pricing Strategy Comparison
- 6.6.3 Channel Strategy Matrix
Note: Strategic developments are included based on their materiality and the availability of reliable information.
Chapter 7. Global Submerged Arc Furnace Market – By Distribution Channel
- 7.1 Segment Overview
- 7.1.1 Volume & Revenue Split by Channel (2024 & 2032)
- 7.1.2 Channel Mix Evolution (2024-2032)
Chapter 8. Regional Market Analysis – Global Overview
- 8.1 Global Regional Overview
- 8.1.1 Regional Volume Share
- 8.1.2 Regional Revenue Share
- 8.1.3 Regional Volume by Region
- 8.1.4 Regional Revenue by Region
- 8.1.5 Regional Forecast Through 2032
- 8.2 Cross-Regional Segment Analysis
- 8.2.1 By Distribution Channel
- 8.2.2 By Brand/Price Tier
Chapter 9. North America Submerged Arc Furnace Market
- 9.1 United States
- 9.2 Canada
- 9.3 Mexico
Chapter 10. Europe Submerged Arc Furnace Market
- 10.1 Germany
- 10.2 France
- 10.3 Italy
- 10.4 United Kingdom
- 10.5 Spain
- 10.6 Poland
- 10.7 Russia
- 10.8 Netherlands
- 10.9 Belgium
- 10.10 Sweden
- 10.11 Denmark
- 10.12 Norway
- 10.13 Rest of Europe
Chapter 11. Asia Pacific Submerged Arc Furnace Market
- 11.1 China
- 11.2 India
- 11.3 Japan
- 11.4 South Korea
- 11.5 Thailand
- 11.6 Indonesia
- 11.7 Vietnam
- 11.8 Malaysia
- 11.9 Australia
- 11.10 Rest of Asia Pacific
Chapter 12. Latin America Submerged Arc Furnace Market
- 12.1 Brazil
- 12.2 Argentina
- 12.3 Colombia
- 12.4 Chile
- 12.5 Rest of Latin America
Chapter 13. Middle East Submerged Arc Furnace Market
- 13.1 Saudi Arabia
- 13.2 United Arab Emirates
- 13.3 Turkey
- 13.4 Israel
- 13.5 Iran
- 13.6 Rest of the Middle East
Chapter 14. Africa Submerged Arc Furnace Market
- 14.1 South Africa
- 14.2 Egypt
- 14.3 Nigeria
- 14.4 Morocco
- 14.5 Rest of Africa
Chapter 15. Submerged Arc Furnace Company Profiles
- 15.1 [Company 01]
- 15.1.1 Company Overview
- 15.1.2 Key Management Personnel
- 15.1.3 Products & Services Portfolio
- 15.1.4 Financial Performance
- 15.1.5 Key Market Focus & Geographic Presence
- 15.1.6 Recent Developments & Strategic Initiatives
Note: The company profile list is preliminary and may change based on research findings, market developments, data availability, and client requirements.
Chapter 16. Appendices
- Appendix A – List of Abbreviations & Acronyms
- Appendix B – Industry Classification Code Reference – Full Series
- Appendix C – Production & Capacity Data Tables
- Appendix D – End-Use & Demand Base Tables
- Appendix E – Consumption & Replacement Rate Assumptions
- Appendix F – ASP Reference Tables
- Appendix G – Manufacturing & Facility Database
- Appendix H – Import-Export Data Tables
- Appendix I – Regulatory Summary Tables
- Appendix J – Primary Research Participant List (Anonymized)
- Appendix K – Primary Research Questionnaire Framework
- Appendix L – Data Sources & Bibliography
- Appendix M – Market Size Divergence & Source Comparison
Chapter 17. Research Methodology
- 17.1 Research Framework & Philosophy
- 17.2 Secondary Research – Sources, Hierarchy & Data Extraction
- 17.3 Data Modeling – Bottom-Up & Top-Down Market Sizing
- 17.4 Primary Research – Stakeholder Framework, LOI & Sample Sizes
- 17.5 Forecast Methodology – Regression, Scenario & Sensitivity Analysis
- 17.6 Quality Control – Four-Layer Validation Framework
- 17.7 Limitations & Standard Assumptions
- 17.8 Disclaimer
