
Pesticides demand holds as generic prices reset value
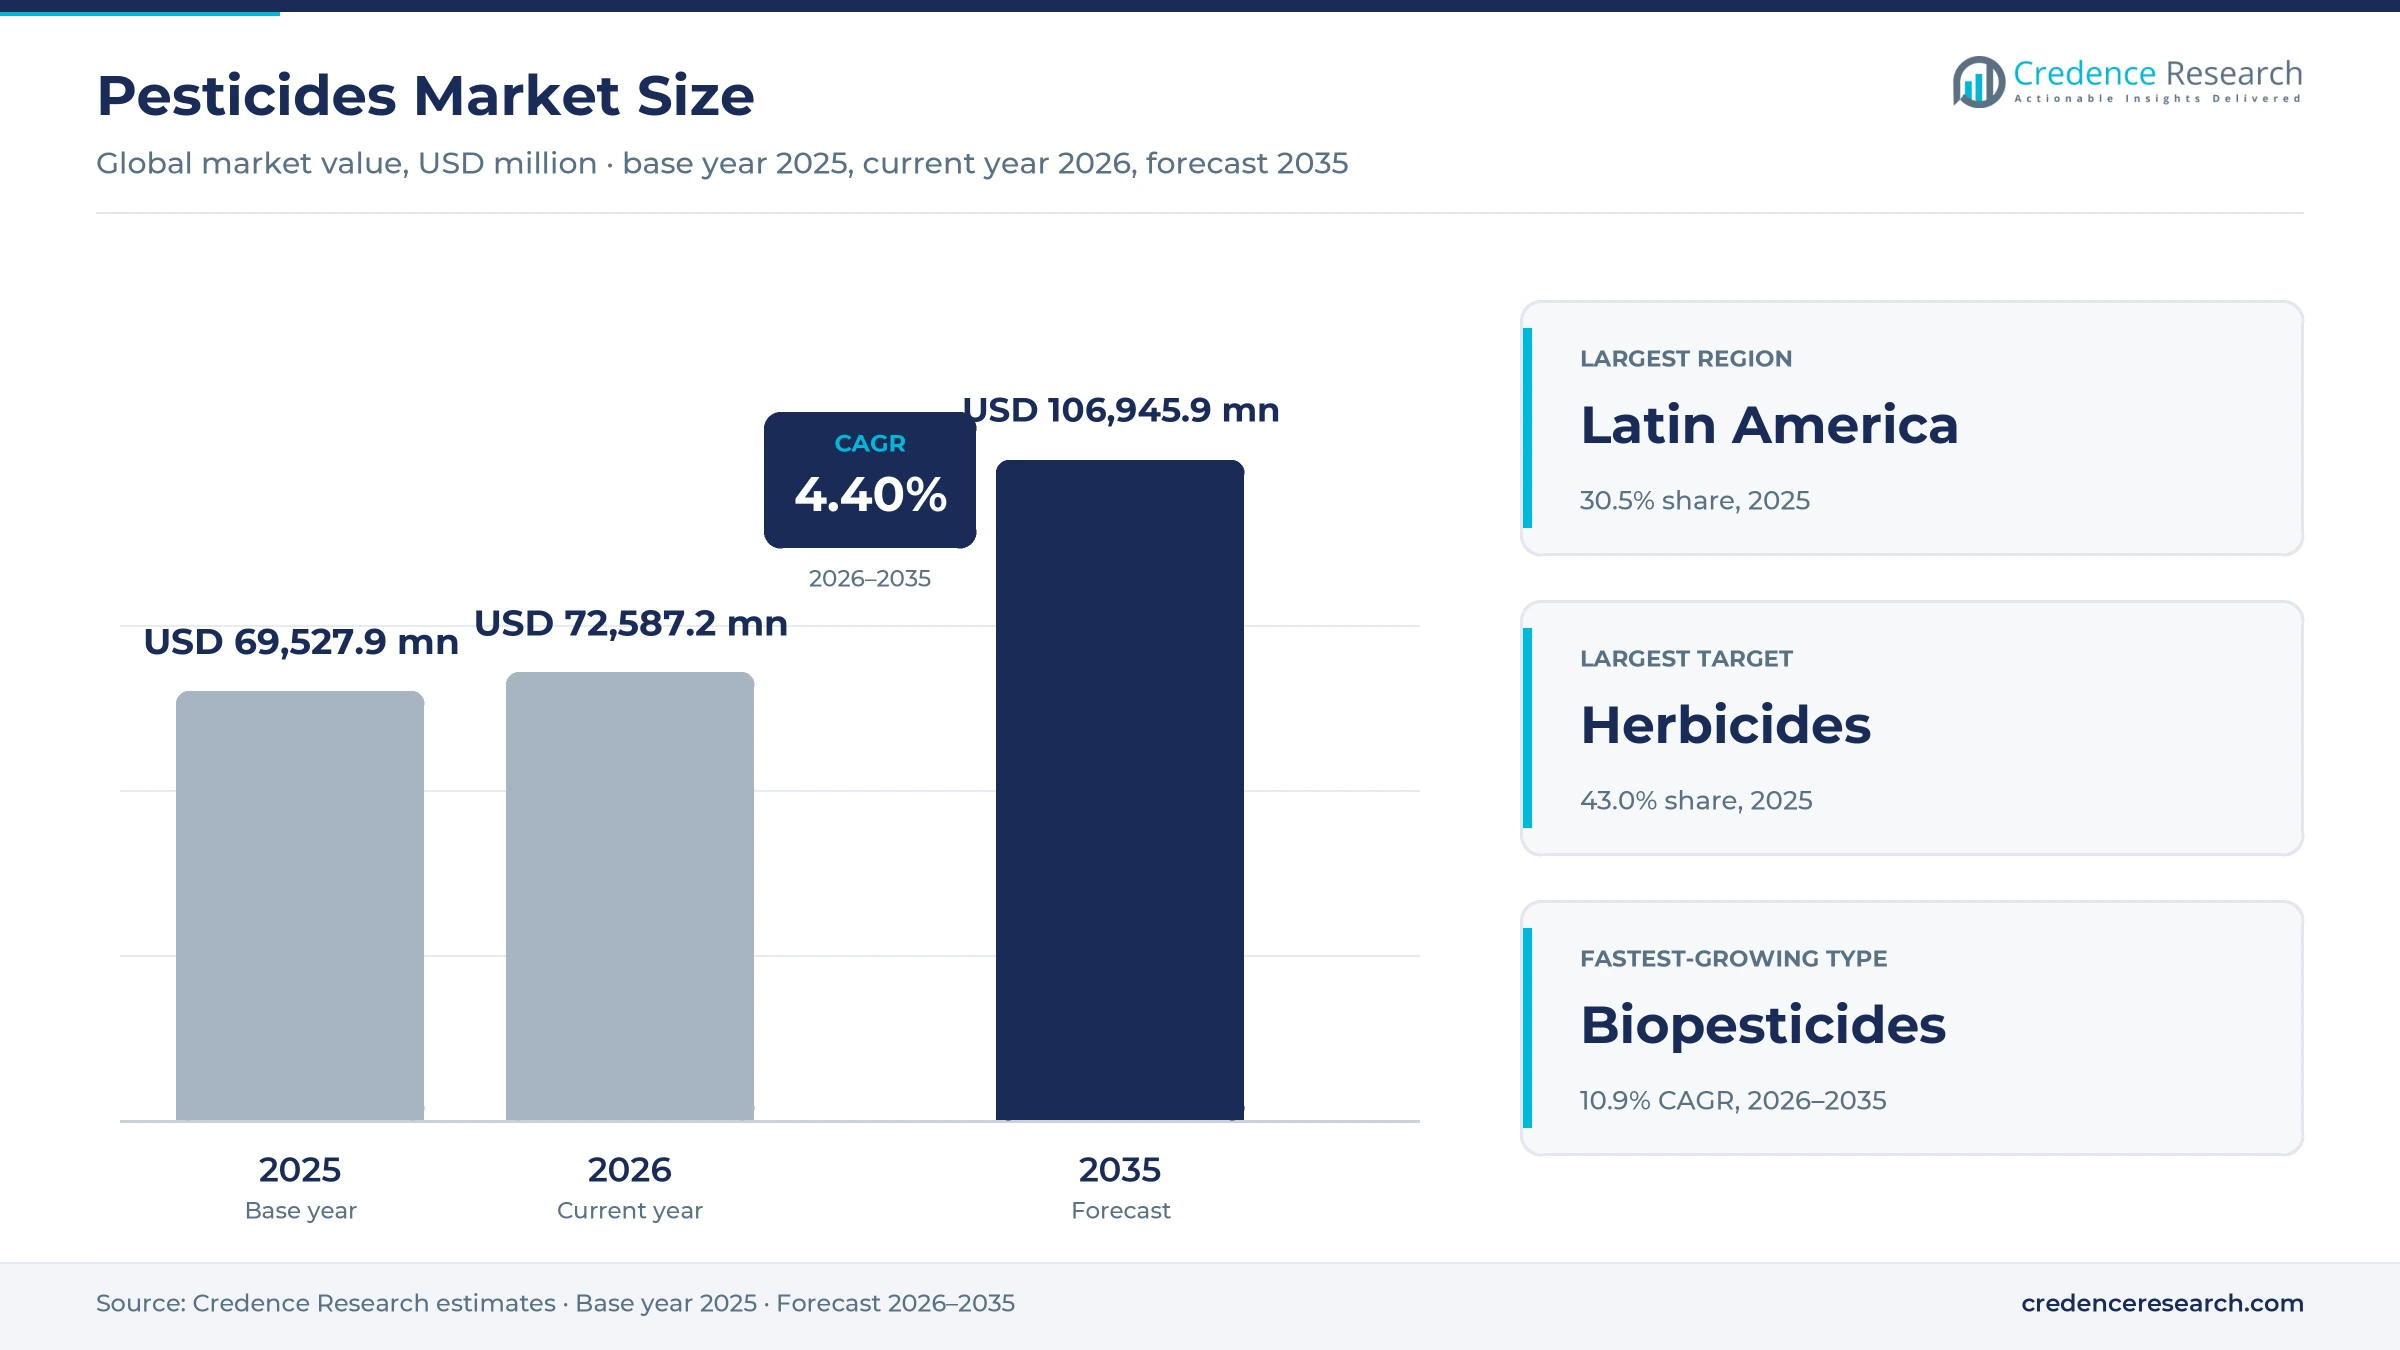
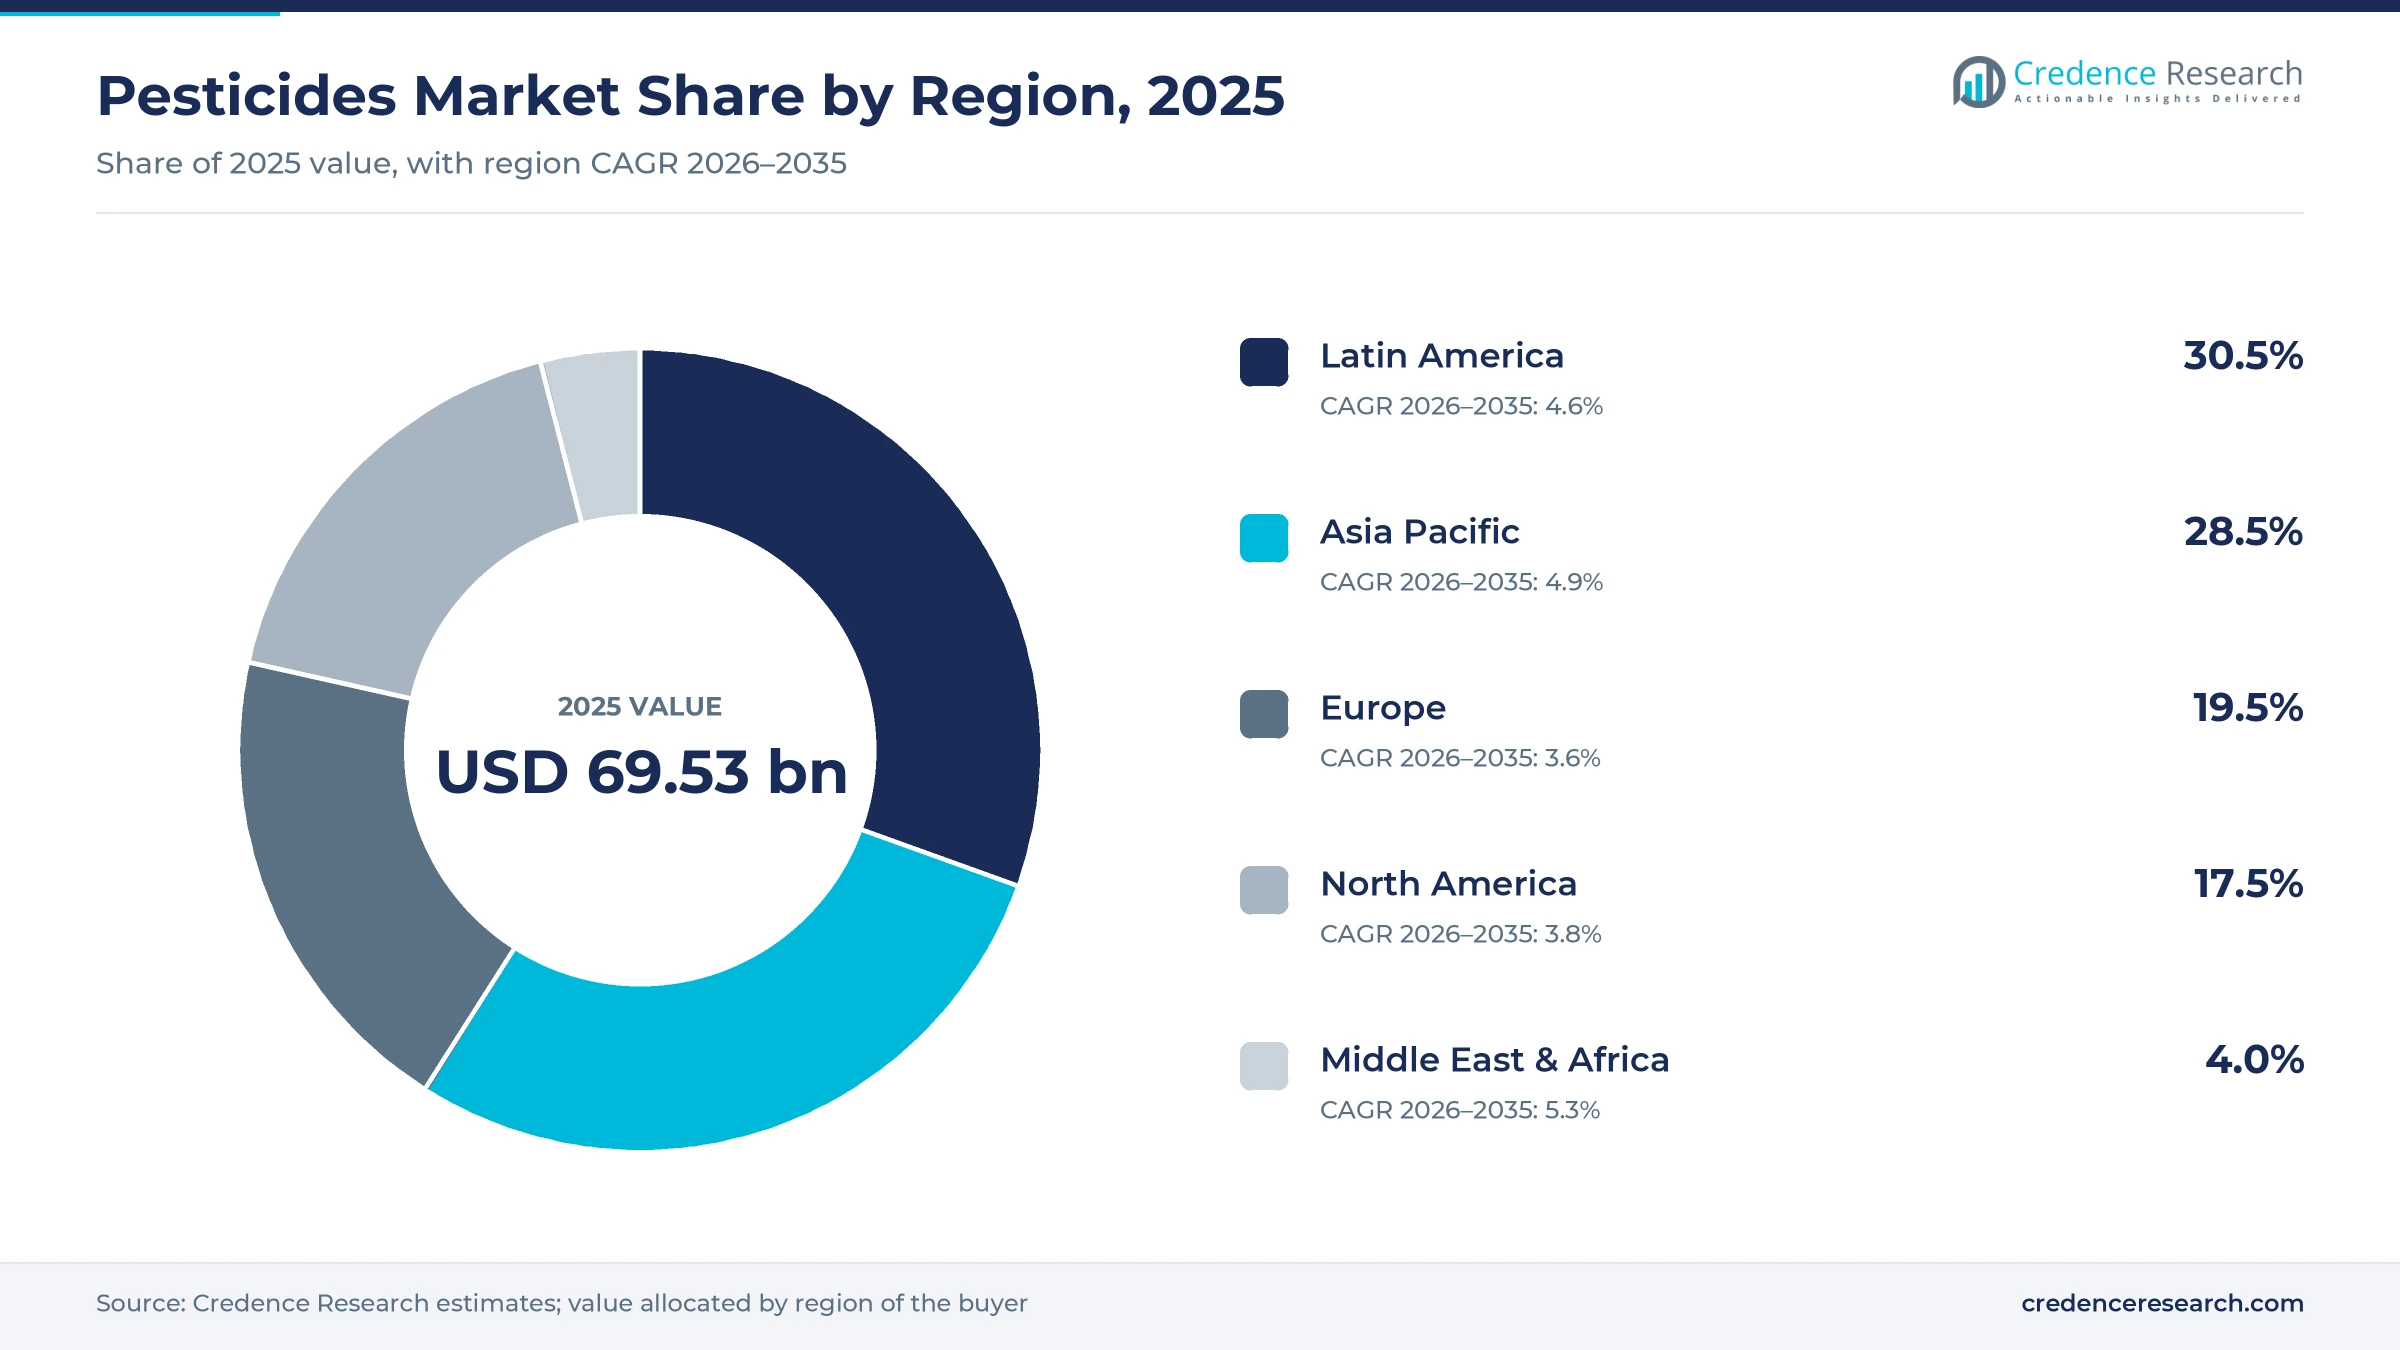
The global pesticides market was valued at USD 69.53 billion in 2025 and is projected to increase from USD 72.59 billion in 2026 to USD 106.95 billion by 2035, registering a CAGR of 4.40% during 2026–2035. Demand comes from growers of soybeans, corn, cereals, cotton, fruit and vegetables who apply herbicides, fungicides and insecticides to protect yield, and from distributors that bundle these products with seed and agronomy advice. Latin America held the largest regional share, 30.5% in 2025, because Brazil sprays several crops a year on the same land. Middle East & Africa is the fastest-growing region at 5.3% a year, while Asia Pacific grows at 4.9% on Chinese and Indian supply. The main commercial change is a price reset, since agrochemical prices fell below pre-pandemic levels by 2024 on Chinese generic supply, which pushed originators toward patented modes of action and biologicals.
Generic supply sets the floor while new chemistry sets the premium
The market counts agricultural pesticides, both synthetic chemical products and biopesticides, sold for use on crops, measured at ex-manufacturer prices, including herbicides, fungicides, insecticides, nematicides, molluscicides and fumigants in liquid or dry formulations. Growers buy mostly through distributors and cooperatives that time purchases to the planting season, and large farms in Brazil and North America increasingly negotiate programs directly with manufacturers.
Household and public-health insecticides, wood preservatives, fertilizers, biostimulants and seed genetics are excluded. Value is shared between originators that discover and register new active ingredients, generic producers of technical material concentrated in China and India, formulators that convert technicals into branded products, and distributors that earn margin on credit, logistics and agronomy services.
Pesticides Market Insights
- The global pesticides market was valued at USD 69.53 billion in 2025 and is projected to reach USD 106.95 billion by 2035, growing at a 4.40% CAGR during 2026–2035.
- Latin America held 30.5% of 2025 value, led by Brazil, where the area treated with crop protection products reached about 2.68 billion hectares in 2025.
- Herbicides held 43.0% of 2025 value, while 546 unique herbicide-resistant weed cases on record keep pressure on growers to rotate modes of action.
- Corteva completed the separation of its seed business as Vylor on Oct. 1, 2026, leaving Corteva as a crop protection and digital agronomy company.
- Biopesticides grow fastest at 10.9% a year through 2035 as Syngenta, Corteva and Brazilian growers scale fermentation-based biological insecticides, fungicides and nematicides for row crops.
Herbicides on soybeans lead while biologicals grow fastest
Synthetic chemistry dominates as biologicals scale from a small base
Based on type, the market is categorized into synthetic chemical pesticides and biopesticides. Synthetic Chemical Pesticides led with 97.3% of 2025 value because broad-spectrum molecules control pests at low cost per hectare, and AgriBusiness Global reported in January 2026 that China's pesticide export volume rose an estimated 16% to 18% in 2025. Biopesticides grow fastest at 10.9% a year as growers add them to chemical programs, although AgriBusiness Global reported in November 2025 that biologicals still sell for under USD 2 billion at manufacturer level worldwide.
Herbicides lead on row crops while insecticides gain from pest pressure
Based on target, the market is categorized into herbicides, fungicides, insecticides and others. Herbicides led with 43.0% of 2025 value because weed control is needed on every row-crop hectare, and herbicides made up 46% of the product volume used in Brazil in 2025, according to Sindiveg. Insecticides grow fastest at 4.8% a year as caterpillar and stink bug pressure rises, since Sindiveg recorded a 10% gain in insecticide-treated area in Brazil in 2025, with caterpillar products up 20%.
Liquid sprays lead and gain from tank-mix and drone programs
Based on formulation, the market is categorized into liquid and dry products. Liquid formulations led with 64.0% of 2025 value because emulsifiable and suspension concentrates mix easily with adjuvants, and the EPA over-the-top dicamba labels approved in February 2026 require 40 ounces per acre of a volatility reduction agent in every spray tank. Liquid products also grow fastest at 4.7% a year as low-volume spraying spreads, while dry granules keep a role in seed treatment and soil uses where handling and shelf life matter more.
Soybean programs lead while fruit and vegetables add the fastest value
Based on crop type, the market is categorized into oilseeds and pulses, cereals and grains, fruits and vegetables and other crops. Oilseeds & Pulses led with 32.0% of 2025 value because soybeans receive several herbicide, fungicide and insecticide passes, and soybeans took 55% of Brazil's treated area in 2025, according to Sindiveg. Fruits & Vegetables grow fastest at 5.0% a year as residue-sensitive export crops pay more per hectare, and Bayer's icafolin filings cover pome and stone fruits, grapes, citrus and tree nuts as well as row crops.
| Segment Group | Leading Sub-segment | Share, 2025 | Fastest-growing Sub-segment | CAGR, 2026–2035 |
|---|---|---|---|---|
| By Type | Synthetic Chemical Pesticides | 97.3% | Biopesticides | 10.9% |
| By Target | Herbicides | 43.0% | Insecticides | 4.8% |
| By Formulation | Liquid | 64.0% | Liquid | 4.7% |
| By Crop Type | Oilseeds & Pulses | 32.0% | Fruits & Vegetables | 5.0% |
Chinese technical prices set the floor for generic sprays
Pesticide prices are set at two levels, the technical active ingredient traded mostly from China and India and the branded formulation sold to growers through distributors. Chinese technical prices move first, with plant closures, energy costs and export policy, and formulators pass changes on with a lag of one season. Patented molecules hold prices far above generics because they control resistant pests, which is why originators rely on new chemistry for margin. Distributors in Brazil add credit costs to the shelf price, so falling technical prices do not always reach the grower.
| Product or cost item | Typical price or fee | Basis |
|---|---|---|
| Glyphosate technical 95%, China | CNY 29,035.7 per metric ton, Oct. 11 to 20, 2026 | National Bureau of Statistics of China, October 2026 |
| Chlorantraniliprole technical, China ex-works | About USD 33 per kg after a USD 44 peak | AgriBusiness Global, January 2026 |
| Topramezone technical, China ex-works | Under USD 71 per kg, from USD 200 in 2024 | AgriBusiness Global, January 2026 |
| Average crop protection product price, Brazil | Down about 7% in 2025 | Sindiveg, May 2026 |
| New active ingredient discovery and registration | More than USD 300 million per molecule | AgriBusiness Global, November 2025 |
Request a Free Sample
Fill in your details and we'll send you a free sample report.
- Sample data tables & charts
- Research methodology
Pest losses, resistance and Brazil acreage sustain spraying
Crop losses to pests keep protection spending non-negotiable
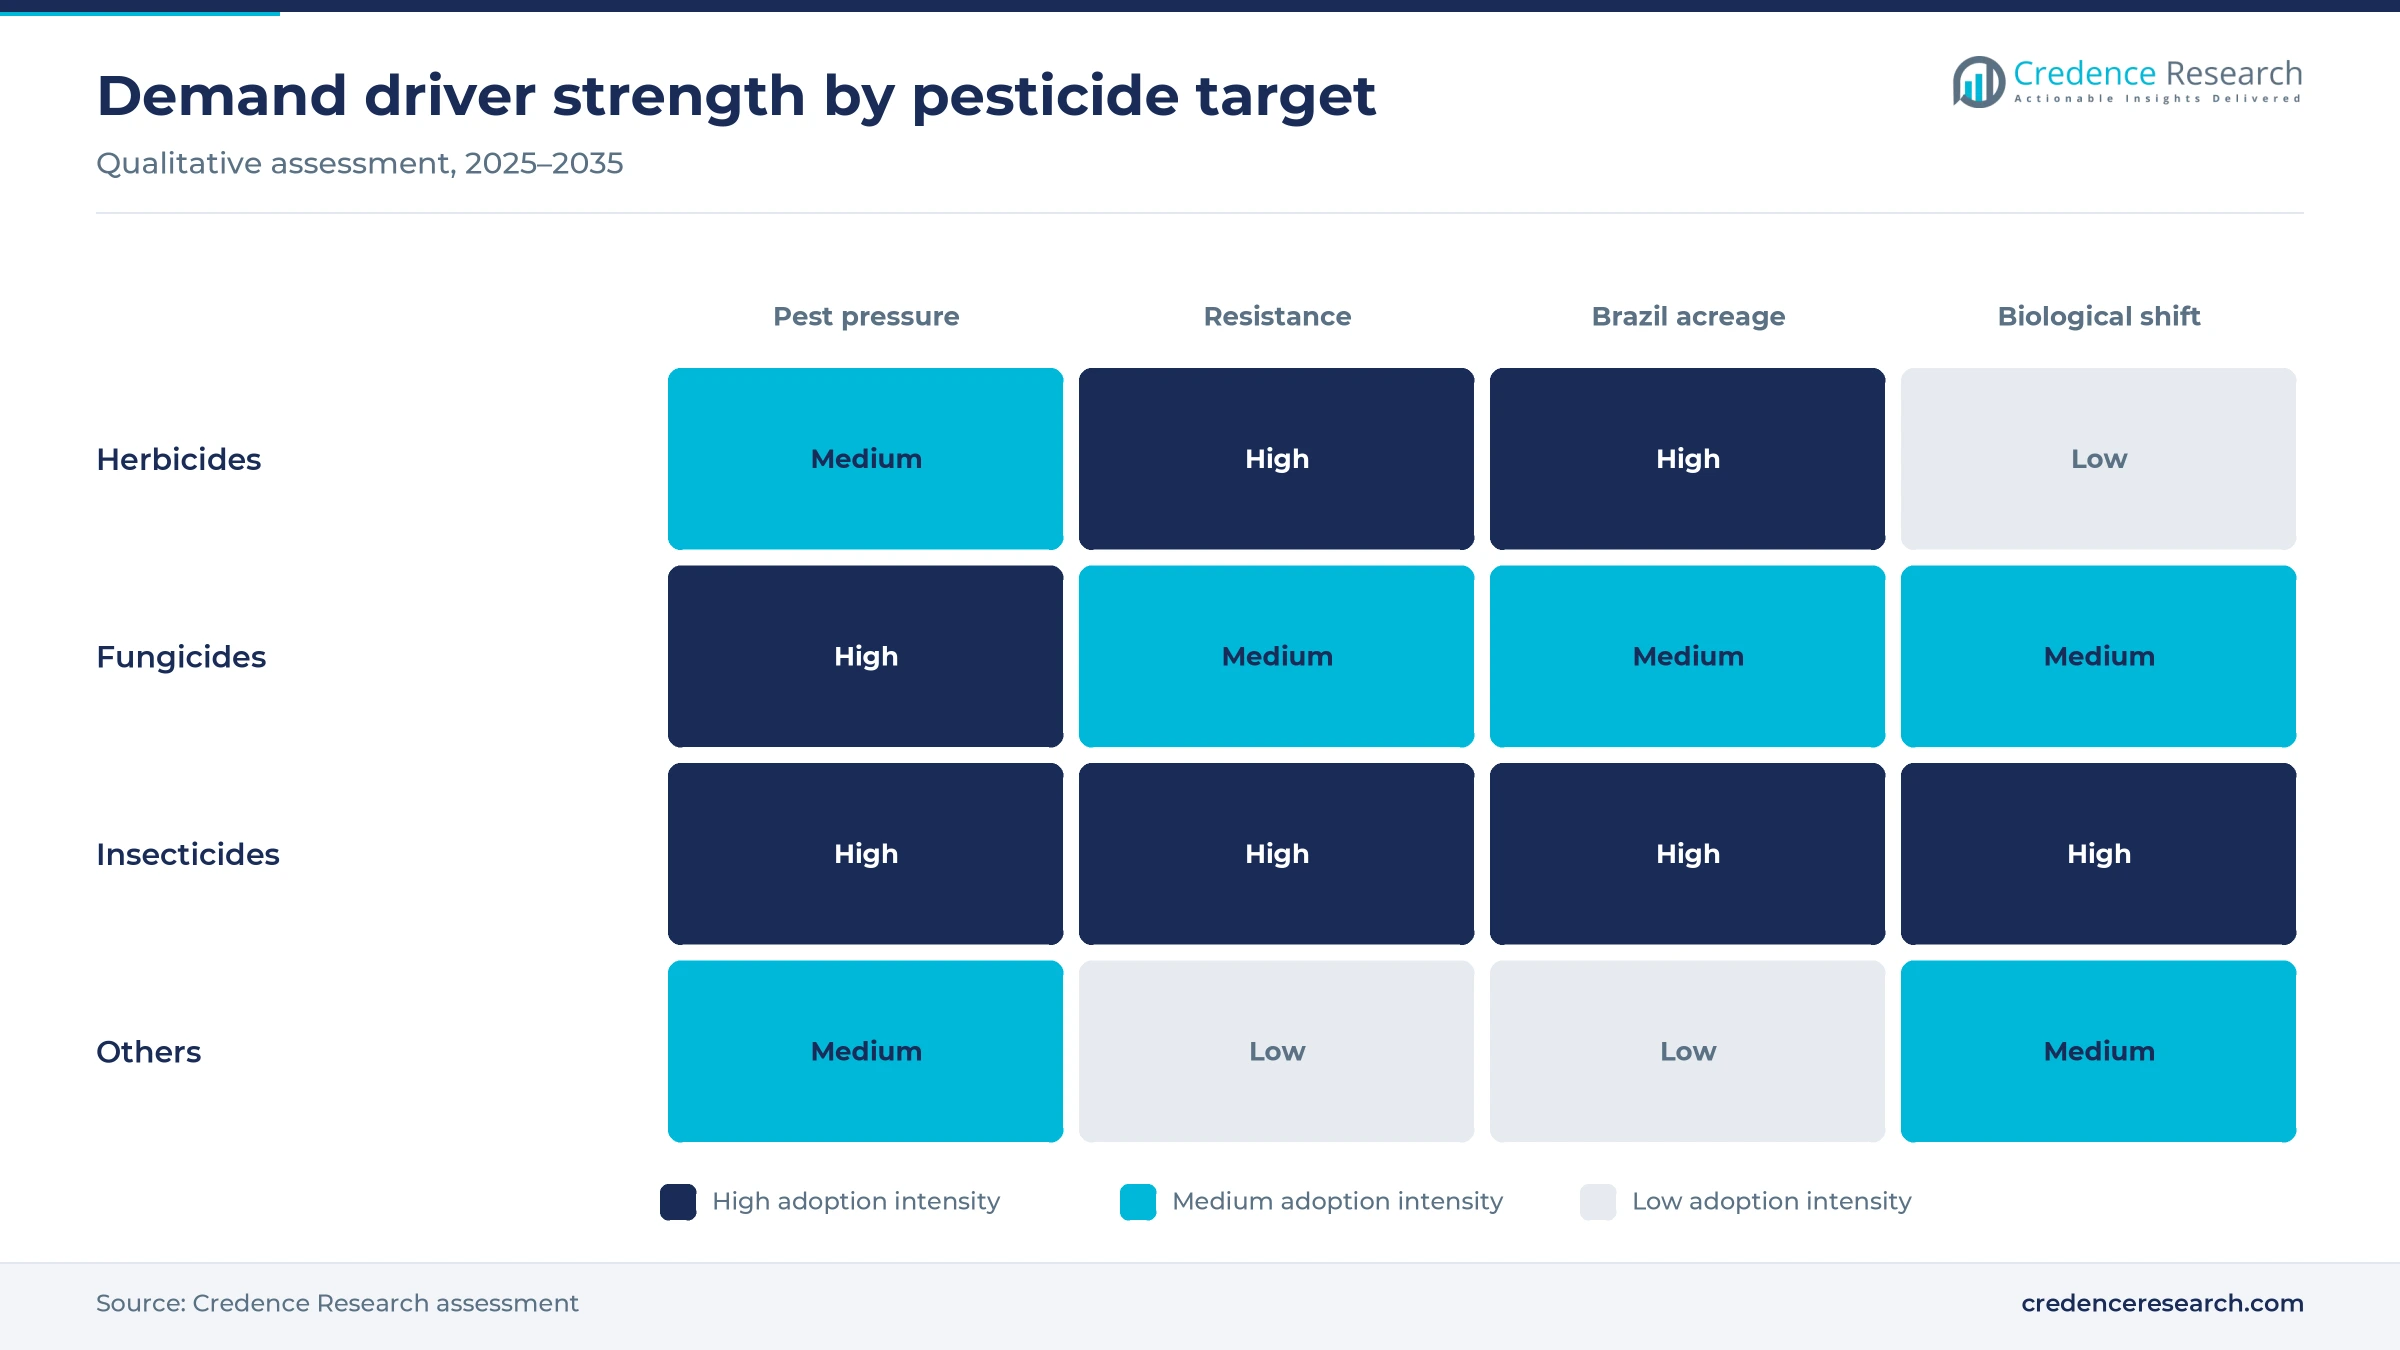
Growers treat pesticides as insurance on yield, so spending tracks pest pressure more than crop prices in a weak year. FAO estimates that up to 40% of global crop production is lost to pests each year, with plant diseases alone costing the world economy around USD 220 billion a year, as its June 2021 study reported. FAO data show that 3.73 million metric tons of active ingredients were used in 2023, up 14% over a decade, and use averaged 2.40 kilograms per hectare of cropland. That steady base protects volume for generic suppliers, while warmer seasons that extend insect and fungal cycles favor companies with broad insecticide and fungicide portfolios.
Herbicide resistance forces growers onto multi-mode programs
Weeds that survive standard herbicides force growers to stack several modes of action, which raises the number of products and the cost per hectare. The International Herbicide-Resistant Weed Database lists 546 unique resistance cases in 274 species, with resistance confirmed to 21 of 31 known herbicide sites of action. Bayer filed its icafolin herbicide in the European Union in July 2025 after filings in the U.S., Canada and Brazil, describing it as the first new herbicide mode of action in more than 30 years. Herbicides held 43.0% of 2025 value, and originators with new chemistry can price above generic glyphosate programs.
Brazil's multi-crop seasons expand the area sprayed each year
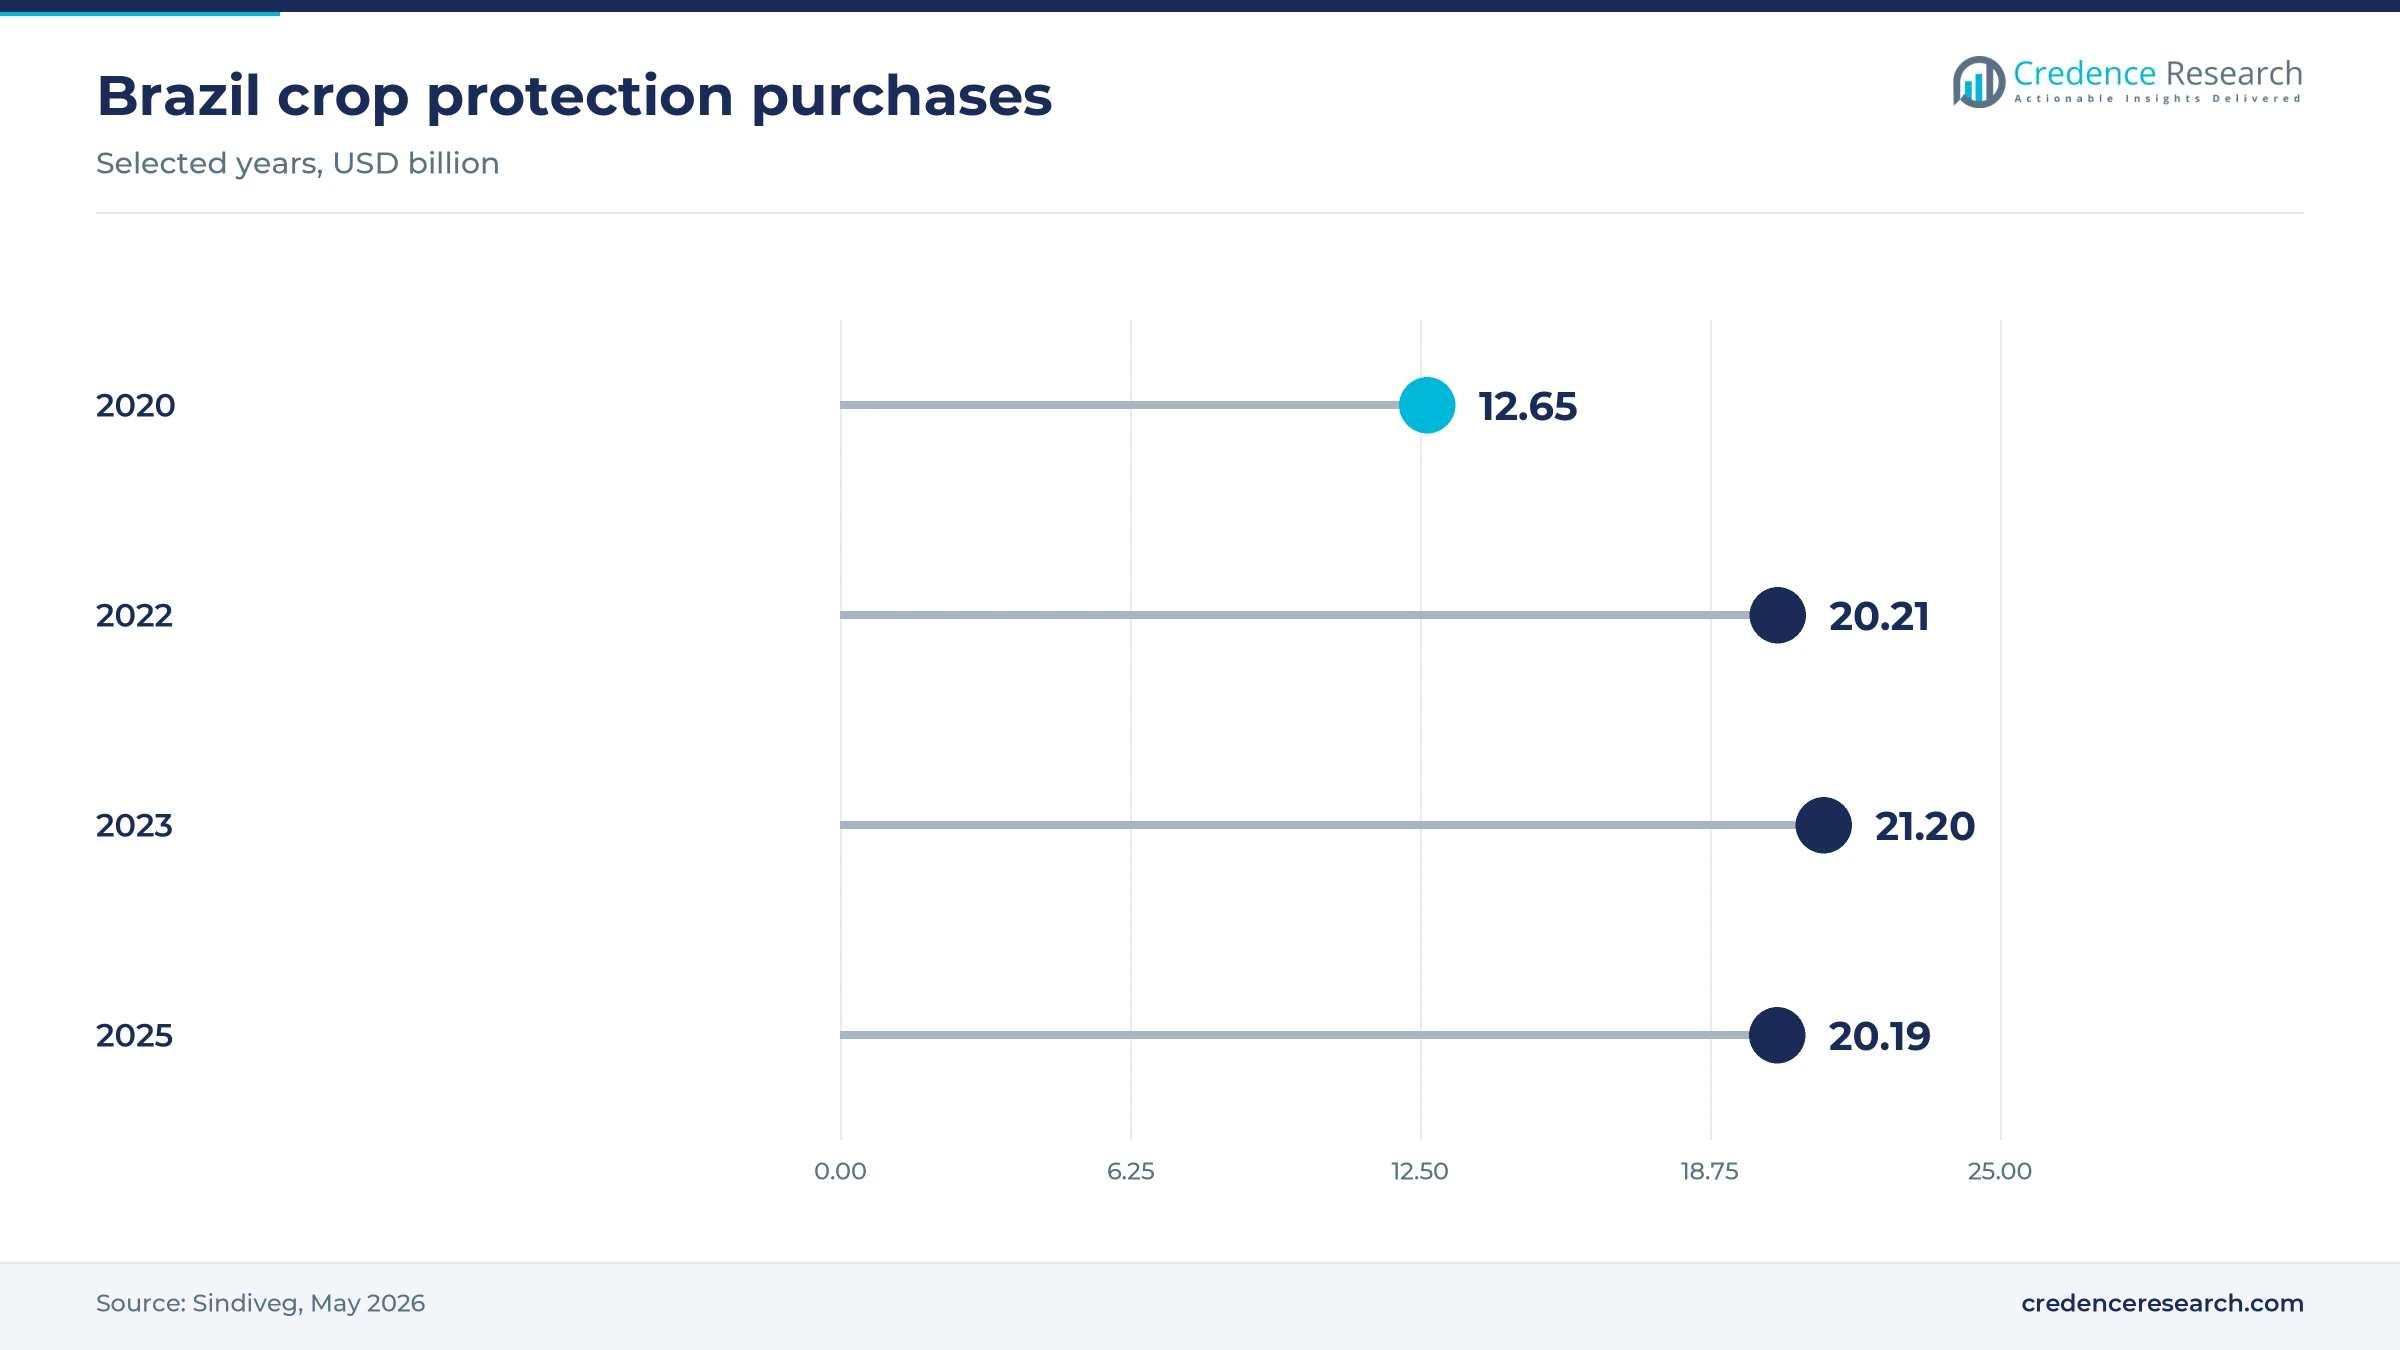
Brazil keeps adding sprayed area because many farmers grow a second corn or cotton crop after soybeans on the same land within one season. Sindiveg reported that the area treated with crop protection products reached about 2.68 billion hectares in 2025, up 7.6% from 2024. That figure counts each product pass separately, and it has risen from 1.63 billion hectares in 2020, according to the same survey. Corn rose to 18% of treated area in 2025 from 16% a year earlier, reflecting the second-crop expansion. This growth keeps Latin America the largest region and gives suppliers with Brazilian registrations and credit networks the largest volume gains.
Regulatory renewals keep core herbicides available to growers
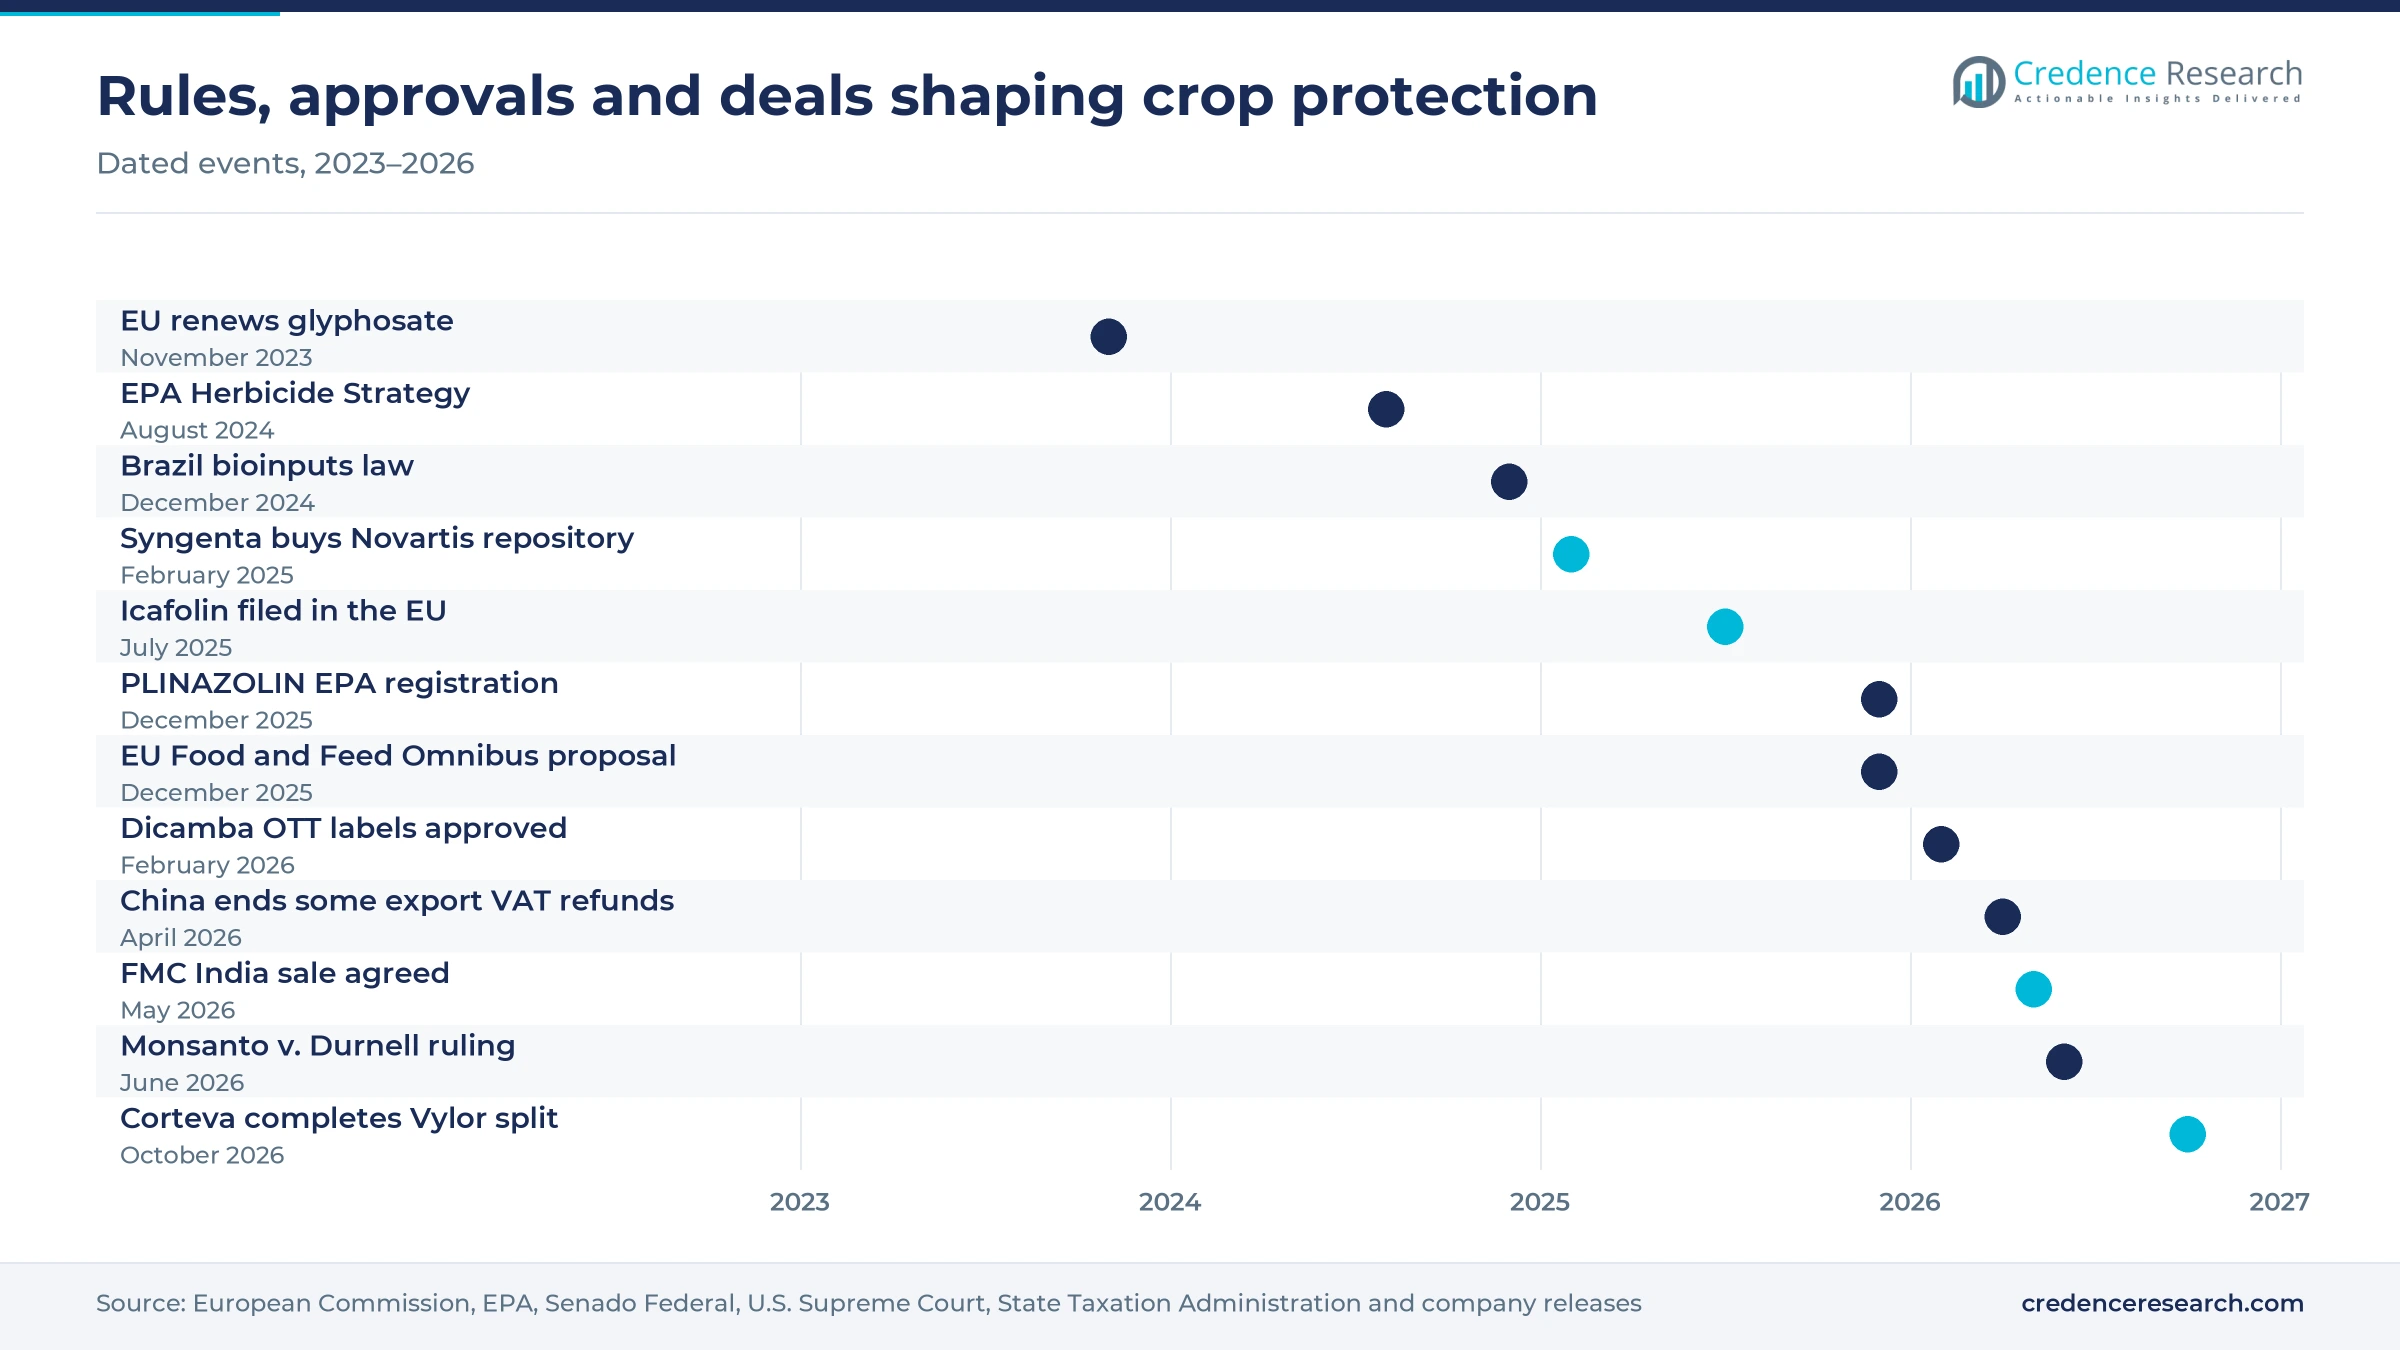
Regulators in the two largest originator markets have renewed or defended key herbicides, which protects the volume base that funds new research. The European Commission renewed glyphosate for 10 years on Nov. 28, 2023, with a ban on pre-harvest desiccant use. In February 2026 EPA approved over-the-top dicamba use on tolerant soybeans and cotton for two growing seasons, and Bayer introduced its Stryax product for that use. On June 25, 2026, the U.S. Supreme Court ruled 7-2 in Monsanto v. Durnell that federal pesticide law preempts state failure-to-warn claims, which reduces litigation risk for registrants of EPA-approved labels.
Biological pipelines and spray drones change field programs
Growers are shifting toward biological products in chemical programs
Large growers are shifting toward biological insecticides, fungicides and nematicides alongside chemistry to manage resistance and residue limits, creating openings for fermentation-based products across soybeans, corn and fruit. In February 2025 Syngenta agreed to acquire the Novartis repository of natural compounds and strains for agricultural use, adding fermentation and bioengineering teams in Basel. Sindiveg reported that biological products reached 45.5% of monitored Brazilian crop area in 2024/25, up from 19.8% in 2019/20. Brazil's Law 15,070, published in December 2024, exempts bioinputs made on farms for their own use from registration. That exemption widens use but also lets growers bypass commercial suppliers, so branded producers must compete on consistency.
Spray drones are shifting applications toward low-volume liquids
Growers in Asia and Latin America are shifting toward drone spraying to reach wet, steep or small fields without ground rigs, creating demand for low-volume liquid formulations and drift-control adjuvants. DJI Agriculture reported about 400,000 of its agricultural drones in use at the end of 2024, up 90% from 2020, treating 300 crop types in 100 countries. Demand for agricultural spray drones favors suspension concentrates that stay stable at high concentration, and liquid formulations grow at 4.7% a year. Label limits still matter, since the 2026 dicamba labels prohibit aerial application, so drone growth depends on product-by-product regulatory approval.
New insecticide classes open a premium resistance-management niche
Growers facing resistant soil and leaf pests will pay a premium for new insecticide classes, creating an opening for originators with fresh chemistry in corn, cereals and pulses. Syngenta announced its planned U.S. products in February 2025 and obtained EPA registration in December 2025 for isocycloseram, branded as PLINAZOLIN technology, covering five products. The registered brands include Equento, a seed treatment for cereals and pulses, and Opello, a soil-applied product for corn rootworm, alongside three foliar brands for vegetables, row crops and orchards. The molecule sits in IRAC Group 30, so it can rotate with diamides and pyrethroids, and it lifts value in seed treatment programs where one application protects the crop from emergence.
India offers buyers a second source of technical material
Distributors and formulators that want to reduce dependence on Chinese technical material have an opening to qualify Indian supply for herbicides and insecticides. A report by the Agro-Chemicals Federation of India and Deloitte, cited by Business Standard in September 2025, put India's agrochemical exports at USD 3.3 billion in fiscal 2025, up from USD 1.3 billion in fiscal 2015 and third behind China and the U.S. China removed export VAT refunds on certain phosphorus-based pesticide products from April 1, 2026, which raises the landed cost of affected Chinese material. FMC agreed in May 2026 to sell its India commercial business to Crystal Crop Protection while keeping its manufacturing in India and a preferred supply link.
Chinese overcapacity, farm credit and rules squeeze margins
Chinese overcapacity keeps generic prices near historic lows
Capacity that Chinese producers added before 2023 still exceeds demand, which caps prices for off-patent active ingredients. AgriBusiness Global reported in January 2026 that topramezone technical fell from USD 200 per kilogram in 2024 to under USD 71, and global crop protection value fell nearly 7% in 2024. Originators with large off-patent portfolios and Indian formulators without backward integration are most exposed, because buyers benchmark every quote against Chinese prices.
Farm credit stress in Brazil delays payment for crop inputs
Brazilian distributors sell inputs on harvest credit, so weaker grower margins turn quickly into unpaid invoices for manufacturers. Sindiveg reported in May 2026 that sector defaults doubled from 2024 to 2025, and first-quarter 2026 defaults were twice the level of a year earlier. Smaller distributors and generic suppliers that extend long payment terms are most exposed, and slower collections limit how much product manufacturers will ship on credit in the largest regional market.
Endangered species mitigation adds cost to every U.S. label
U.S. registrations now carry runoff and drift mitigation that raises the cost of using older herbicides. The EPA Herbicide Strategy finalized in August 2024 addresses more than 900 listed species, and the 2026 dicamba labels cap use at 1.0 pound per acre a year, half the 2020 limit, with a 240-foot downwind buffer. Growers near sensitive habitat and suppliers of older herbicides face the largest restrictions, which favors products with lower drift and runoff risk.
Rising discovery costs limit the supply of new active ingredients
Discovery and registration now take about a decade, which narrows the number of companies that can launch new molecules. AgriBusiness Global reported in November 2025 that bringing a new active ingredient to market costs more than USD 300 million. Bayer's icafolin, filed in four markets during 2025, is not planned to launch in Brazil before 2028. Mid-sized originators without a big Brazilian or U.S. base struggle to fund such programs, so new chemistry stays concentrated among the largest suppliers.
Latin America leads as Asia Pacific and Africa gain
| Region | Value, 2025 (USD billion) | Share, 2025 | CAGR, 2026–2035 |
|---|---|---|---|
| Latin America | 21.21 | 30.5% | 4.6% |
| Asia Pacific | 19.82 | 28.5% | 4.9% |
| Europe | 13.56 | 19.5% | 3.6% |
| North America | 12.17 | 17.5% | 3.8% |
| Middle East & Africa | 2.78 | 4.0% | 5.3% |
Latin America leads on Brazil's soybean and second-crop area
Latin America held 30.5% of 2025 value and grows at 4.6% a year, with Brazil as the largest national market. Sindiveg reported Brazilian producer purchases of USD 20.19 billion in 2025, up 0.7% in dollar terms even though average product prices fell about 7%, a farm-gate figure that includes distributor margins and credit costs and so sits well above Brazil's value at ex-manufacturer prices used here. Soybeans took 55% of treated area, so herbicide and insecticide suppliers with local registrations dominate. Argentina and Paraguay add soybean and corn demand, while credit stress in Brazil limits faster growth.
Asia Pacific grows on Chinese supply and Indian manufacturing
Asia Pacific held 28.5% of 2025 value and grows at 4.9% a year, as the region both consumes and manufactures most generic active ingredients. China's 15th Five-Year Plan for the pesticide industry shifts policy from adding capacity to high-efficiency production, according to AgriBusiness Global in January 2026. India adds formulation and technical capacity for export and domestic rice, cotton and vegetable growers. FAO data show that Asia exported 2.4 million metric tons of formulated products worth USD 11.4 billion in 2023, more than any other region.
Europe holds value but faces the tightest approval regime
Europe held 19.5% of 2025 value and grows at 3.6% a year, the slowest rate, because the EU has withdrawn several pre-emergent herbicides while few new molecules arrive. FAO data show European use at 1.59 kilograms per hectare in 2023, below the world average. The European Commission proposed a Food and Feed Safety Omnibus in December 2025 that would give open-ended approvals to certain substances and allow up to three years of use after a ban. Specialty fruit, wine and vegetable growers keep value high per hectare.
North America grows slowly on mature row-crop acreage
North America held 17.5% of 2025 value and grows at 3.8% a year, because corn and soybean acreage is mature and most herbicide volume is off-patent. AgriBusiness Global reported in February 2026 that higher insect pressure may lift insecticide sales in 2026 while lower grower incomes may limit fungicide spending. Litigation relief after the June 2026 Supreme Court ruling supports glyphosate sales, while endangered species mitigation adds cost for growers near sensitive habitat.
Middle East and Africa grow fastest from a small base
Middle East and Africa held 4.0% of 2025 value but grow fastest at 5.3% a year, as irrigated horticulture and export fruit expand in North, East and Southern Africa. AgriBusiness Global reported in February 2026 that low Chinese prices weighed on the region's 2025 value and that biologicals gain because export buyers set strict residue limits. FAO's review of 1990 to 2023 data notes that most of Africa's pesticide imports come from countries outside the region, so landed prices track Chinese and Indian supply. That growth rate is a Credence Research estimate built from FAO trade data and regional sales trends, because country-level sales data are limited.
Spin-offs, a divestment and new chemistry mark 2025–2026
| Development | Status and market relevance |
|---|---|
| In December 2025, Syngenta obtained EPA registration for isocycloseram, branded as PLINAZOLIN technology, covering five insecticide products for crops including corn, cereals and pulses. | Regulatory approval. A phased U.S. rollout starts with early-season pest control in corn, cereals and pulses. |
| In February 2026, UPL's board approved a plan to spin off its crop protection business into a separately listed company, UPL Global Sustainable Agri Solutions. | Plan approved by the board. Completion is expected within 12 to 15 months, subject to regulatory approvals. |
| In May 2026, FMC agreed to sell FMC India Private Limited, its India commercial business, to Crystal Crop Protection for USD 252 million, with a preferred supply arrangement. | Definitive agreement signed. FMC keeps global research and manufacturing in India and supplies selected active ingredients. |
| In October 2026, Corteva completed the separation of its seed and genetics business, which began trading on the New York Stock Exchange as Vylor. | Completed transaction. Corteva now operates as a crop protection and digital agronomy company led by Luther Kissam. |
| In October 2026, BASF said about 80% of the carve-out of its Agricultural Solutions business was complete and that the unit should be IPO-ready by mid-2027. | Plan in progress. The listing would create another standalone crop protection and seed company in Europe. |
Modes of action and delivery decide product value
- Mode of action determines whether a product still controls resistant weeds, insects or fungi, so new sites of action command the highest prices.
- Formulation chemistry such as suspension concentrates, microcapsules and water-dispersible granules sets stability, drift and mixing behavior in the spray tank.
- Targeted application through spray drones, sensor-guided booms and spot sprayers cuts the volume of product used per hectare and favors concentrated liquids.
- Fermentation and strain selection make biological products consistent enough for large farms, and this capability links biopesticides to synthetic fungicide programs in mixed spray plans.
Need a Custom Version of This Report?
Tailor the scope, geography, or segments to your exact requirements.
- Custom geography or segment scope
- Direct access to our analyst team
Originators split off crop units as generic makers expand
Competition splits between originators that discover and register new molecules and post-patent suppliers that win on cost and registrations. Syngenta Group, including ADAMA, Bayer, BASF and Corteva hold the largest patented portfolios, and several are separating crop units, as Corteva did with Vylor in October 2026 and BASF plans by mid-2027. UPL, Nufarm and Sumitomo Chemical compete across herbicides, fungicides and insecticides, while FMC focuses on insecticides and is reshaping its Asian presence. Coromandel International and Crystal Crop Protection lead among Indian manufacturers and formulators. In herbicides, access to glyphosate technical supply and to dicamba-tolerant crop systems shapes who wins soybean and cotton programs. Distribution reach and grower credit also decide share in Brazil, where suppliers that can carry harvest-term receivables keep their customers through weak seasons. Originators defend prices with bundled programs that pair new molecules with older partners, while generic suppliers compete on registrations held in many countries.
Originators, generic makers and formulators split the value chain
The supply side has three tiers with very different economics and entry barriers. A small group of originators, led by Syngenta Group, Bayer, BASF and Corteva, owns most patented molecules and spends heavily on discovery and registration. Generic producers in China and India supply most off-patent technical material, and FAO data show 2023 exports of 6.7 million metric tons of formulated products worth USD 42.8 billion, with Asia the largest exporting region. Formulators and post-patent companies such as UPL, Nufarm and Crystal compete on registrations and distribution. Margins are likely highest for patented molecules and thinnest for generic technicals, although companies rarely disclose them.
Companies profiled and their roles in this market
| Company | Type | Role in the market |
|---|---|---|
| Syngenta Group | Full-line originator | Syngenta and ADAMA crop protection, PLINAZOLIN insecticides and biological products |
| Bayer AG (Crop Science) | Full-line originator | Roundup glyphosate, Stryax dicamba and the icafolin herbicide pipeline |
| BASF SE (Agricultural Solutions) | Full-line originator | Fungicides, herbicides and insecticides, targeting IPO readiness by mid-2027 |
| Corteva, Inc. | Crop protection originator | Herbicides, insecticides, biologicals and digital agronomy after the Vylor separation |
| UPL Limited | Post-patent supplier | Off-patent herbicides, fungicides and insecticides, spinning off UPL Global |
| FMC Corporation | Insecticide specialist | Diamide insecticides and new active ingredients, supplying India through Crystal |
| Sumitomo Chemical Co., Ltd. | Originator and specialist | Insecticides, herbicides and biorational products through its agro units |
| Nufarm Limited | Post-patent supplier | Off-patent herbicides and fungicides in Australia, the Americas and Europe |
| Coromandel International Limited | Local manufacturer | Technical and formulated crop protection products for India and export |
| Crystal Crop Protection Limited | Local manufacturer | Indian formulator acquiring FMC India and its brand rights |
Resistance-breaking chemistry now earns the price premium
Credence Research's view is that value in this market is moving from volume to mode of action. Generic molecules will keep most of the tonnage, but prices for them will track Chinese capacity and leave little margin for formulators without their own technical supply. New chemistry such as icafolin and isocycloseram, and biologicals that fit into chemical programs, will earn the premium because they solve resistance and residue problems that growers cannot fix with cheaper products. The main uncertainty is Brazilian credit, which could hold back the region that sets the global growth rate.
Regional sales data and trade statistics anchor the model
The report uses 2025 as the base year and forecasts to 2035. Market values come from the Credence Research model, which starts from published regional crop protection sales at ex-manufacturer level and checks them against FAO use and trade statistics, Sindiveg data for Brazil and technical price series from China. Regional and segment splits are Credence Research estimates built from planted area, treated area and price data. Sources include regulators, FAO, company releases and agricultural trade press. No interviews or surveys were conducted for this edition, and the earlier 2018 base has been replaced.
Volume growth stays modest as mix shifts to new modes
Through 2035 the market should grow at a 4.40% CAGR, with volume rising slowly and value supported by new modes of action and a higher share of biologicals. Latin America will remain the largest region as Brazil adds second crops, while Africa and Asia gain on irrigated horticulture and local manufacturing. Herbicides will keep the largest share, but insecticides and biopesticides will add value faster. The main risks are another Chinese price slide, Brazilian credit stress and tighter rules in Europe and the U.S., while faster approvals for new chemistry would lift the upper end of the range.
Generic prices and Brazilian credit set the range of outcomes
The range depends on how quickly Chinese overcapacity clears, whether Brazilian growers return to normal credit conditions and how fast new modes of action reach the market. Stable technical prices and steady planted area support the base case. A renewed price slide or further defaults in Brazil would hold value growth near volume growth. Faster approval of new chemistry and wider biological use would lift growth above the base path.
| Scenario | CAGR, 2026–2035 | Value, 2035 | What has to hold |
|---|---|---|---|
| Downside | 2.8% | USD 93.07 billion | Chinese generic prices fall again and Brazilian distributor defaults keep rising through 2027 |
| Base | 4.40% | USD 106.95 billion | Technical prices stabilize, planted area grows modestly and biologicals keep gaining share |
| Upside | 5.6% | USD 118.53 billion | New modes of action launch on schedule and biologicals scale quickly in Brazil and Asia |
Frequently Asked Questions
How big is the global pesticides market?
How large is the agricultural pesticides market in Latin America?
What share do synthetic pesticides hold?
Which pesticide type grows fastest by target?
How much pesticide is used worldwide?
Are organic and biological pesticides growing in Europe and Brazil?
Which companies lead the pesticides market?
What could slow growth in this market?
Table of Content
Chapter 1 Market Segmentation
- 1.1 Segmentation Framework
- 1.1.1 Product and Service Classification
- 1.1.2 Application and End-Use Classification
- 1.1.3 Technology and Solution Classification
- 1.1.4 Customer and Distribution Channel Classification
- 1.1.5 Geographic Segmentation
- 1.1.6 Market Segment Definitions and Boundaries
- 1.2 By Type
- 1.2.1 Synthetic Chemical Pesticides
- 1.2.2 Biopesticides
- 1.3 By Target
- 1.3.1 Herbicides
- 1.3.2 Fungicides
- 1.3.3 Insecticides
- 1.3.4 Others
- 1.4 By Formulation
- 1.4.1 Liquid
- 1.4.2 Dry
- 1.5 By Crop Type
- 1.5.1 Oilseeds & Pulses
- 1.5.2 Cereals & Grains
- 1.5.3 Fruits & Vegetables
- 1.5.4 Other Crops
Chapter 2 Introduction
- 2.1 Report Objectives and Scope
- 2.2 Product Definition and Industry Terminology
- 2.3 Market Inclusions and Exclusions
- 2.4 Research Process
- 2.4.1 Primary Research and Expert Interviews
- 2.4.2 Secondary Research and Source Review
- 2.4.3 Top-Down and Bottom-Up Estimation
- 2.4.4 Data Triangulation and Verification
- 2.5 Market Size Measurement Basis
- 2.5.1 2025: USD 69.53 billion → 2035: USD 106.95 billion
- 2.6 Historical and Forecast Reference Periods
- 2.6.1 Historical Period: 2018-2025
- 2.6.2 Base Year: 2025
- 2.6.3 Forecast Period: 2025-2035
- 2.7 Research Assumptions and Limitations
Chapter 3 Executive Summary
- 3.1 Market Snapshot and Key Findings
- 3.2 Base-Year Market Size, 2025
- 3.3 Forecast Market Size, 2035
- 3.4 Revenue and Volume Growth Outlook
- 3.5 Key Demand and Supply Indicators
- 3.6 Leading Market Segments
- 3.7 Fastest-Growing Market Opportunities
- 3.8 Regional Performance Highlights
- 3.9 Technology and Industry Transformation
- 3.10 Competitive Landscape Summary
- 3.11 Analyst View and Strategic Implications
Chapter 4 Global Pesticides Market Trends and Developments
- 4.1 Historical Industry Development, 2018-2025
- 4.2 Recent Market Trends and Developments
- 4.3 Demand and Customer Behavior Trends
- 4.4 Technology and Product Innovation
- 4.5 Artificial Intelligence, Automation and Digitalization
- 4.6 Local Manufacturing and Supply Chain Realignment
- 4.7 Industry Partnerships, Mergers and Acquisitions
- 4.8 Sustainability and Circular Economy Developments
- 4.9 Government and Private Sector Investment Trends
- 4.10 Emerging Business Models and Commercialization
- 4.11 Industry Developments and Announcements
Chapter 5 Global Pesticides Market Production, Supply and Demand Analysis
- 5.1 Demand Trend and Consumption Analysis, 2018-2025
- 5.2 Demand Forecast, 2025-2035
- 5.3 Production and Output Trend, 2018-2025
- 5.4 Production and Output Forecast, 2025-2035
- 5.5 Installed Capacity and Capacity Utilization
- 5.6 Company-Wise Production Plants and Statistics
- 5.6.1 Installed Production Capacity
- 5.6.2 Actual Production
- 5.6.3 Planned Capacity and Expansion Targets
- 5.7 Supply Chain Structure and Procurement Trends
- 5.8 Supply-Demand Gap and Bottlenecks
- 5.9 Import Dependence and Sourcing Structure
- 5.10 Contract Manufacturing and Outsourcing
- 5.11 Regional Supply and Demand Concentration
Chapter 6 Global Pesticides Market Pricing Analysis
- 6.1 Pricing Structure and Measurement
- 6.2 Historical Pricing Trends, 2018-2025
- 6.3 Pricing Outlook, 2025-2035
- 6.4 Average Selling Price and Unit Economics
- 6.5 Pricing by Product and Market Segment
- 6.6 Geographic Pricing Differences
- 6.7 Key Input, Energy, Labor and Logistics Costs
- 6.8 Contract Pricing and Purchasing Models
- 6.9 Pricing Sensitivity and Competitive Positioning
- 6.10 Price, Margin and Profitability Implications
Chapter 7 Global Pesticides Market Dynamics
- 7.1 Market Growth Drivers
- 7.1.1 Demand-Side Drivers
- 7.1.2 Technology and Innovation Drivers
- 7.1.3 Infrastructure and Investment Drivers
- 7.1.4 Regulatory and Policy Drivers
- 7.2 Market Restraints
- 7.2.1 Cost and Affordability Constraints
- 7.2.2 Technology and Adoption Barriers
- 7.2.3 Supply Chain and Operational Constraints
- 7.3 Market Challenges
- 7.3.1 Competitive Pressure and Margin Erosion
- 7.3.2 Skills, Infrastructure and Implementation Gaps
- 7.4 Emerging Market Opportunities
- 7.5 Market Dynamics Impact and Time-Horizon Assessment
Chapter 8 Global Pesticides Value Chain Analysis
- 8.1 Industry Value Chain Overview
- 8.2 Upstream Suppliers and Critical Inputs
- 8.3 Technology and Component Providers
- 8.4 Manufacturing or Service Delivery
- 8.5 Distribution, Channel Partners and Integrators
- 8.6 Downstream Applications and End Users
- 8.7 Value Addition and Profit Pools
- 8.8 Vertical Integration and Outsourcing
- 8.9 Supplier Concentration and Risk
- 8.10 Supply Chain Localization and Resilience
Chapter 9 Global Pesticides Market Regulations and Policies
- 9.1 Relevant Laws, Standards and Compliance Frameworks
- 9.2 Product, Service, Safety and Quality Requirements
- 9.3 Government Policies, Incentives and Subsidies
- 9.4 Imports, Exports and Trade Barriers
- 9.5 Public Procurement and Local Content Requirements
- 9.6 Environmental and Sustainability Compliance
- 9.7 Upcoming Policy Changes and Market Implications
Chapter 10 Global Pesticides Market Hotspots and Opportunities
- 10.1 Market Opportunity Mapping and Growth Hotspots
- 10.2 High-Growth Applications and Customer Groups
- 10.3 Underserved Markets and White-Space Opportunities
- 10.4 Emerging Technology and Product Opportunities
- 10.5 New Capacity and Investment Hotspots
- 10.6 Market Entry and Expansion Opportunities
- 10.7 Distribution and Partnership Opportunities
- 10.8 Near-Term and Long-Term Commercial Potential
- 10.9 Opportunity Attractiveness and Execution Risks
Chapter 11 Global Pesticides Market Outlook, 2025-2035
- 11.1 Market Size and Analysis
- 11.1.1 Revenue (Market Measurement: 2025: USD 69.53 billion → 2035: USD 106.95 billion)
- 11.1.2 Market Volume and Quantity Sold
- 11.1.3 Historical Market Size, 2018-2025
- 11.1.4 Base-Year Market Size, 2025
- 11.2 Market Forecast, 2025-2035
- 11.2.1 Revenue Forecast to 2035
- 11.2.2 Volume Forecast to 2035
- 11.2.3 CAGR and Year-on-Year Growth
- 11.2.4 Incremental Revenue Opportunity
- 11.3 Forecast Assumptions and Scenario Analysis
- 11.3.1 Base-Case Forecast
- 11.3.2 Optimistic and Conservative Scenarios
- 11.3.3 Technology, Pricing and Policy Sensitivities
- 11.4 Market Attractiveness and Growth Outlook
Chapter 12 Global Pesticides Market Segmentation and Outlook
- 12.1 Segmentation Summary and Market Shares, 2025
- 12.2 Largest and Fastest-Growing Segments
- 12.3 By Type - Market Size and Forecast, 2025-2035
- 12.3.1 Segment Definition and Scope
- 12.3.2 Historical Market Size, 2018-2025
- 12.3.3 Revenue Forecast, 2025-2035
- 12.3.4 Volume Forecast, 2025-2035
- 12.3.5 Base-Year Market Share, 2025
- 12.3.6 Segment CAGR and Growth Drivers
- 12.3.7 Subsegment Market Size and Forecast
- 12.3.7.1 Synthetic Chemical Pesticides
- 12.3.7.2 Biopesticides
- 12.3.8 Subsegment Pricing and Adoption Trends
- 12.3.9 Leading Suppliers and Competition
- 12.3.10 Regional Demand and Opportunities
- 12.4 By Target - Market Size and Forecast, 2025-2035
- 12.4.1 Segment Definition and Scope
- 12.4.2 Historical Market Size, 2018-2025
- 12.4.3 Revenue Forecast, 2025-2035
- 12.4.4 Volume Forecast, 2025-2035
- 12.4.5 Base-Year Market Share, 2025
- 12.4.6 Segment CAGR and Growth Drivers
- 12.4.7 Subsegment Market Size and Forecast
- 12.4.7.1 Herbicides
- 12.4.7.2 Fungicides
- 12.4.7.3 Insecticides
- 12.4.7.4 Others
- 12.4.8 Subsegment Pricing and Adoption Trends
- 12.4.9 Leading Suppliers and Competition
- 12.4.10 Regional Demand and Opportunities
- 12.5 By Formulation - Market Size and Forecast, 2025-2035
- 12.5.1 Segment Definition and Scope
- 12.5.2 Historical Market Size, 2018-2025
- 12.5.3 Revenue Forecast, 2025-2035
- 12.5.4 Volume Forecast, 2025-2035
- 12.5.5 Base-Year Market Share, 2025
- 12.5.6 Segment CAGR and Growth Drivers
- 12.5.7 Subsegment Market Size and Forecast
- 12.5.7.1 Liquid
- 12.5.7.2 Dry
- 12.5.8 Subsegment Pricing and Adoption Trends
- 12.5.9 Leading Suppliers and Competition
- 12.5.10 Regional Demand and Opportunities
- 12.6 By Crop Type - Market Size and Forecast, 2025-2035
- 12.6.1 Segment Definition and Scope
- 12.6.2 Historical Market Size, 2018-2025
- 12.6.3 Revenue Forecast, 2025-2035
- 12.6.4 Volume Forecast, 2025-2035
- 12.6.5 Base-Year Market Share, 2025
- 12.6.6 Segment CAGR and Growth Drivers
- 12.6.7 Subsegment Market Size and Forecast
- 12.6.7.1 Oilseeds & Pulses
- 12.6.7.2 Cereals & Grains
- 12.6.7.3 Fruits & Vegetables
- 12.6.7.4 Other Crops
- 12.6.8 Subsegment Pricing and Adoption Trends
- 12.6.9 Leading Suppliers and Competition
- 12.6.10 Regional Demand and Opportunities
- 12.7 Segment Growth Comparison
- 12.8 Segment Attractiveness and Priority Matrix
Chapter 13 Global Pesticides Geographic Market Outlook, 2025-2035
- 13.1 Regional Market Size and Share, 2025
- 13.2 Regional Market Forecast, 2025-2035
- 13.3 Regional Pricing, Production and Demand Differences
- 13.4 North America
- 13.4.1 United States
- 13.4.2 Canada
- 13.4.3 Mexico
- 13.5 Europe
- 13.5.1 Germany
- 13.5.2 France
- 13.5.3 Italy
- 13.5.4 United Kingdom
- 13.5.5 Spain
- 13.5.6 Poland
- 13.5.7 Russia
- 13.5.8 Netherlands
- 13.5.9 Belgium
- 13.5.10 Sweden
- 13.5.11 Denmark
- 13.5.12 Norway
- 13.5.13 Rest of Europe
- 13.6 Asia Pacific
- 13.6.1 China
- 13.6.2 India
- 13.6.3 Japan
- 13.6.4 South Korea
- 13.6.5 Thailand
- 13.6.6 Indonesia
- 13.6.7 Vietnam
- 13.6.8 Malaysia
- 13.6.9 Australia
- 13.6.10 Rest of Asia Pacific
- 13.7 Latin America
- 13.7.1 Brazil
- 13.7.2 Argentina
- 13.7.3 Colombia
- 13.7.4 Chile
- 13.7.5 Rest of Latin America
- 13.8 Middle East
- 13.8.1 Saudi Arabia
- 13.8.2 United Arab Emirates
- 13.8.3 Turkey
- 13.8.4 Israel
- 13.8.5 Iran
- 13.8.6 Rest of the Middle East
- 13.9 Africa
- 13.9.1 South Africa
- 13.9.2 Egypt
- 13.9.3 Nigeria
- 13.9.4 Morocco
- 13.9.5 Rest of Africa
- 13.10 Regional Investment, Policy and Supply Chain Differences
- 13.11 Regional Competitive Landscape
- 13.12 Geographic Growth Hotspots
Chapter 14 Global Pesticides Technology, Innovation and Sustainability Outlook
- 14.1 Technology Landscape and Maturity
- 14.2 Product, Process and Service Innovation
- 14.3 AI, Automation and Digital Tools in the Industry
- 14.4 Technology Adoption and Performance Benchmarking
- 14.5 Innovation Pipeline and R&D Investment
- 14.6 Patent and Intellectual Property Trends
- 14.7 Energy Efficiency and Resource Management
- 14.8 Sustainability, Recycling and Circularity
- 14.9 Technology Roadmap, 2025-2035
- 14.10 Risks of Obsolescence and Technology Substitution
Chapter 15 Global Pesticides Market Key Strategic Imperatives
- 15.1 Growth and Market Entry Priorities
- 15.2 High-Return Products and Segments
- 15.3 Pricing, Profitability and Cost Optimization
- 15.4 Technology Investment and Product Differentiation
- 15.5 Supply Chain Localization and Resilience
- 15.6 Distribution and Customer Acquisition
- 15.7 Partnership, Acquisition and Capacity Strategy
- 15.8 Regional Expansion Priorities
- 15.9 Short-, Medium- and Long-Term Actions
Chapter 16 Competition Outlook
- 16.1 Industry Competition Characteristics
- 16.2 Market Structure and Concentration
- 16.3 Market Share and Competitive Positioning, 2025
- 16.4 Company-Wise Revenue and Product Benchmarking
- 16.5 Production and Service Capacity Benchmarking
- 16.6 Technology, Pricing and Differentiation
- 16.7 Regional Footprint and Distribution Strength
- 16.8 Mergers, Acquisitions and Strategic Alliances
- 16.9 New Entrants and Competitive Threats
- 16.10 Porter's Five Forces and Industry Attractiveness
- 16.11 Competitive Outlook, 2025-2035
Chapter 17 Company Profiles
- 17.1 Company Coverage and Selection Criteria
- 17.2 Syngenta Group
- 17.2.1 Business Description
- 17.2.2 Company Ownership and Geographic Presence
- 17.2.3 Product and Service Portfolio
- 17.2.4 Manufacturing and Operating Footprint
- 17.2.5 Production Capacity and Expansion Plans
- 17.2.6 Financial Performance and Investment
- 17.2.7 Market Share and Competitive Position
- 17.2.8 Technology and Innovation Capabilities
- 17.2.9 Strategic Alliances or Partnerships
- 17.2.10 Recent Developments
- 17.2.11 Growth Strategy and Outlook
- 17.3 Bayer AG (Crop Science)
- 17.4 BASF SE (Agricultural Solutions)
- 17.5 Corteva, Inc.
- 17.6 UPL Limited
- 17.7 FMC Corporation
- 17.8 Sumitomo Chemical Co., Ltd.
- 17.9 Nufarm Limited
- 17.10 Coromandel International Limited
- 17.11 Crystal Crop Protection Limited
- 17.12 Other Relevant Market Participants
Note: Every listed company is profiled on the structure shown under the first company. The company list is preliminary and may change based on research findings, market developments, data availability and client requirements.
Chapter 18 Disclaimer
- 18.1 Research and Forecast Disclaimer
- 18.2 Data Source and Estimation Limitations
Note: The depth of individual sections depends on data availability for this market. Volume, capacity, trade and other unit-based metrics are included where applicable.

