Market overview
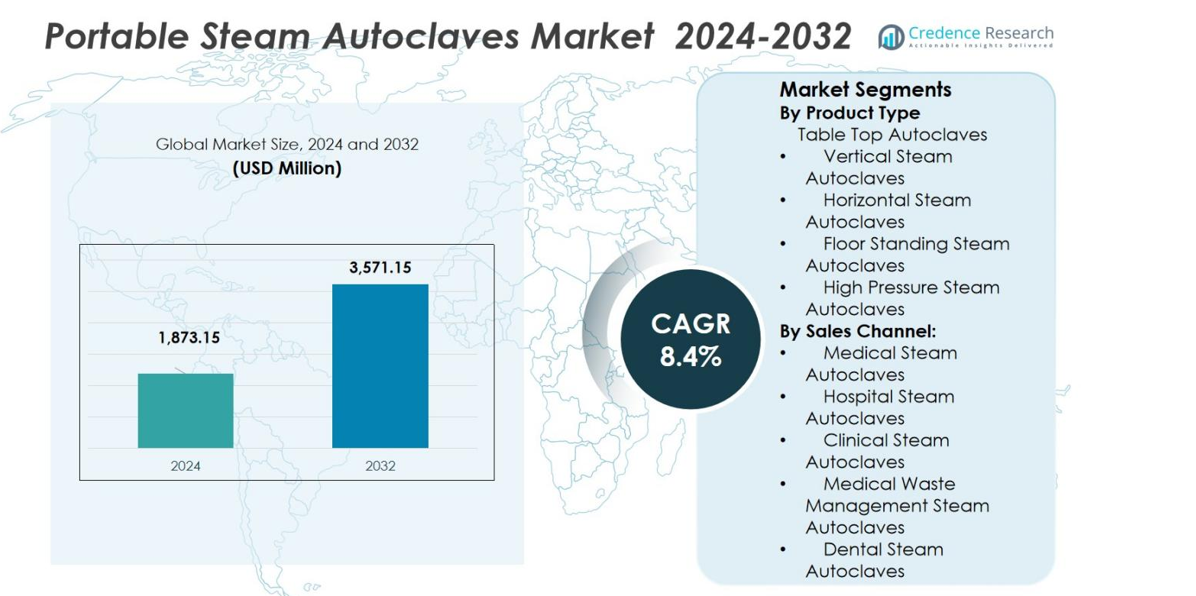
The Portable Steam Autoclaves Market size was valued at USD 1,873.15 million in 2024 and is anticipated to reach USD 3,571.15 million by 2032, at a CAGR of 8.4% during the forecast period.
| REPORT ATTRIBUTE |
DETAILS |
| Historical Period |
2020-2023 |
| Base Year |
2024 |
| Forecast Period |
2025-2032 |
| Portable Steam Autoclaves Market Size 2024 |
USD 1,873.15 million |
| Portable Steam Autoclaves Market, CAGR |
8.4% |
| Portable Steam Autoclaves Market Size 2032 |
USD 3,571.15 million |
The Portable Steam Autoclaves Market sees strong participation from key players including Steris Corporation, Getinge Infection Control, Belimed GmbH, Tuttnauer Co. Ltd., LTE Scientific Ltd., Systec GmbH & Co. KG, MELAG Medizintechnik GmbH & Co. KG, Sakura Seiki Co. Ltd., Astell Scientific Ltd., and Priorclave Ltd.. These firms drive the market through extensive product portfolios, global distribution networks and continuous innovation. Geographically, North America commands a leading position with a market share of 35.2% in 2024, underpinned by mature healthcare infrastructure and stringent infection‑control protocols. Europe follows with a 28.6% share, leveraging advanced healthcare systems and regulatory frameworks. Asia‑Pacific holds 22.9%, fueled by expanding medical infrastructure and growing awareness of sterilisation requirements. Together, these regions represent the major concentration of market activity for portable steam autoclaves.
Market Insights
- The Portable Steam Autoclaves Market size reached USD 1,873.15 million in 2024 and is projected to grow to USD 3,571.15 million by 2032 at a CAGR of 8.4%.
- The market benefitted from rising healthcare infrastructure investments, increasing infection‑control mandates and advanced sterilisation technologies, which include compact tabletop units that accounted for a 34.2% share in 2024 and medical‑steam autoclaves that held a 39.8% share in 2024.
- A growing trend toward eco‑friendly sterilisation solutions and the expansion of portable autoclaves into emerging economies present significant opportunities for market players.
- Restraints persist due to high upfront equipment costs and the complexity of meeting stringent regulatory compliance across different regions.
- Regionally, North America led with a 35.2% share in 2024, followed by Europe at 28.6% and Asia‑Pacific at 22.9%, reflecting advanced healthcare ecosystems and rising adoption across key geographies.
Access crucial information at unmatched prices!
Request your sample report today & start making informed decisions powered by Credence Research Inc.!
Download Sample
Market Segmentation Analysis:
By Product Type:
Table top autoclaves dominate the Portable Steam Autoclaves Market with a 34.2% share in 2024. These compact, space-saving autoclaves are ideal for smaller healthcare settings, dental clinics, and laboratories. Their popularity is driven by their affordability, ease of use, and suitability for low-to-moderate sterilization volumes. As the demand for portable sterilization solutions grows in smaller practices, table top autoclaves continue to lead the market, offering an effective solution for sterilization without requiring extensive space or resources.
- For instance, the Labnics Tabletop Autoclave NTTA-102 features a 35 L capacity, automatic pressure-temperature control, and safety lock functions, ensuring reliable sterilization in compact spaces.
By Sales Channel:
Medical steam autoclaves lead the market with a 39.8% share in 2024. These autoclaves are widely used in healthcare settings such as hospitals, surgical centers, and clinics, where infection control is critical. The increasing focus on patient safety and the growing number of medical procedures drive the demand for reliable sterilization equipment. As a result, medical steam autoclaves remain the dominant segment in the market, with their essential role in preventing cross-contamination and maintaining hygiene in medical environments.
- For instance, IndoSurgicals’ Vertical Autoclave Hi-Pressure features digital controls, vacuum drying, and steam storage for efficient sterilization in hospitals and surgical centers.
Key Growth Drivers
Rising Healthcare Infrastructure Investments
The increasing investments in healthcare infrastructure worldwide have been a major growth driver for the portable steam autoclaves market. As healthcare facilities expand and modernize, the demand for advanced sterilization equipment grows, particularly in hospitals, dental clinics, and laboratories. These facilities require reliable, efficient, and compact sterilization solutions, which portable steam autoclaves provide. The growing focus on infection control, particularly following the global health crisis, further accelerates the adoption of these autoclaves in medical environments, ensuring enhanced patient safety and improved operational efficiency.
- For instance, according to Deloitte’s 2025 Global Health Care Outlook, many health systems worldwide are prioritizing efficiency and patient engagement through infrastructure investments that enable adoption of advanced sterilization and medical technologies.
Increasing Demand for Infection Control
The rising awareness of infection prevention and control, especially in healthcare and clinical settings, is a significant driver of the portable steam autoclaves market. As hospitals and dental clinics prioritize sterilization to prevent cross-contamination and ensure patient safety, the demand for portable, high-efficiency autoclaves has surged. With stricter regulatory standards and an increased focus on hygiene, the need for effective sterilization solutions like portable steam autoclaves is expected to continue growing, solidifying their essential role in maintaining clean, safe environments in medical practices.
- For instance, in 2023 Tuttnauer introduced a portable steam autoclave with advanced sterilization cycles and a compact footprint designed specifically for small clinics and mobile healthcare units, enabling reliable on‑site instrument reprocessing where space and utilities are limited.
Technological Advancements in Sterilization
Advancements in autoclave technology have played a pivotal role in driving the market’s growth. Portable steam autoclaves have evolved to become more efficient, reliable, and user-friendly, with improved sterilization cycles, faster processing times, and energy-efficient features. The integration of smart technologies, such as automated controls, digital interfaces, and real-time monitoring, enhances usability and performance, making these autoclaves more attractive to healthcare professionals. These technological advancements not only meet the increasing demand for high-quality sterilization but also contribute to the growth of the portable steam autoclave market.
Key Trends & Opportunities
Integration of Eco-Friendly Features
One of the key trends in the portable steam autoclaves market is the integration of eco-friendly features. As environmental concerns grow, healthcare facilities are seeking sustainable alternatives to traditional sterilization methods. Portable steam autoclaves with energy-efficient designs, reduced water consumption, and recyclable materials are gaining popularity. These innovations help reduce the environmental footprint of healthcare operations while maintaining high sterilization standards. The market’s focus on sustainable technologies presents a significant opportunity for manufacturers to develop greener solutions, catering to the increasing demand for eco-conscious healthcare products.
- For instance, Celitron’s ISS (Integrated Sterilizer and Shredder) combines steam sterilization with shredding and drying, reducing medical waste volume by up to 80% and eliminating harmful emissions, resulting in a closed vessel system with zero harmful byproducts and reduced transportation needs.
Adoption in Emerging Markets
The growing healthcare infrastructure in emerging markets presents a significant opportunity for the portable steam autoclaves market. As countries in regions like Asia-Pacific, Latin America, and the Middle East continue to expand their healthcare facilities, the demand for reliable and cost-effective sterilization solutions is increasing. The adoption of portable steam autoclaves in these regions offers manufacturers the opportunity to tap into a growing market with considerable potential. As these markets strive to meet global hygiene and safety standards, the demand for portable autoclaves is set to rise, driving further market expansion.
- For instance, India’s National Health Mission has rolled out biomedical equipment management programs that explicitly cover autoclaves and portable sterilizers for primary health centers in over 20 states, linking reliable sterilization to basic service readiness in rural facilities.
Key Challenges
High Initial Investment Costs
A significant challenge in the portable steam autoclaves market is the high initial investment cost. While portable steam autoclaves offer long-term value by ensuring efficient sterilization, their upfront costs can be prohibitive, particularly for smaller healthcare facilities and clinics. This cost barrier limits market growth in regions where healthcare budgets are constrained. Manufacturers must find ways to balance performance and affordability to make portable autoclaves more accessible to a wider range of customers without compromising on quality or efficiency.
Regulatory Compliance and Standards
The portable steam autoclaves market faces challenges related to stringent regulatory compliance and standards. Healthcare facilities must adhere to strict sterilization guidelines set by local and international regulatory bodies, which can vary across regions. Ensuring that portable steam autoclaves meet these regulatory requirements often involves additional testing, certification, and modifications, which can increase manufacturing costs and slow down time-to-market. Compliance with evolving standards remains a constant challenge for manufacturers as they strive to meet both industry demands and regulatory expectations.
Regional Analysis
North America
North America holds a dominant share of 35.2% in the Portable Steam Autoclaves Market in 2024. The region benefits from well-established healthcare infrastructure, stringent infection control standards, and increased healthcare expenditure. The growing number of medical procedures and surgeries, along with a rising focus on patient safety, drives the demand for reliable sterilization equipment, including portable steam autoclaves. The presence of key market players in the U.S. and Canada, combined with technological advancements in sterilization processes, further supports market growth in the region. North America is expected to maintain its leading position throughout the forecast period.
Europe
Europe commands a significant market share of 28.6% in the Portable Steam Autoclaves Market as of 2024. The region’s advanced healthcare systems, strict hygiene standards, and increasing healthcare investments contribute to the high demand for portable steam autoclaves. European countries are focused on improving sterilization efficiency, which drives the adoption of high-performance autoclaves in hospitals, dental clinics, and research labs. Additionally, the growing awareness of infection prevention and the demand for eco-friendly sterilization solutions present opportunities for market expansion. Europe’s strong regulatory frameworks further ensure that sterilization practices meet international safety standards.
Asia-Pacific
Asia-Pacific holds a substantial share of 22.9% in the Portable Steam Autoclaves Market in 2024. The region’s rapidly expanding healthcare sector, coupled with increasing investments in medical infrastructure, has significantly boosted the demand for portable steam autoclaves. Emerging economies, particularly China and India, are witnessing a surge in healthcare facility construction, driving the need for sterilization equipment. The rising awareness of infection control, along with an increasing number of medical procedures, further contributes to market growth. As these countries strive to meet international healthcare standards, the demand for advanced sterilization solutions continues to rise.
Latin America
Latin America accounts for a market share of 8.1% in the Portable Steam Autoclaves Market in 2024. The region’s healthcare sector is gradually modernizing, leading to a higher demand for reliable sterilization solutions. Brazil and Mexico are the key markets in this region, driven by growing healthcare infrastructure investments and the increasing awareness of infection control. As healthcare facilities expand and upgrade, the need for efficient and cost-effective sterilization methods, including portable steam autoclaves, is on the rise. The market is expected to grow steadily, aided by supportive government initiatives and improved access to healthcare services.
Middle East & Africa
The Middle East & Africa region holds a market share of 5.2% in the Portable Steam Autoclaves Market in 2024. Although smaller in comparison to other regions, this market is growing due to the rapid development of healthcare infrastructure, especially in the Gulf Cooperation Council (GCC) countries. The region is witnessing increasing investments in healthcare facilities, spurring the demand for efficient sterilization solutions. As the focus on hygiene and patient safety intensifies, the need for portable steam autoclaves in hospitals and clinics is expanding. The region’s healthcare modernization efforts are expected to drive consistent market growth.
Market Segmentations:
By Product Type
- Table Top Autoclaves
- Vertical Steam Autoclaves
- Horizontal Steam Autoclaves
- Floor Standing Steam Autoclaves
- High Pressure Steam Autoclaves
By Sales Channel:
- Medical Steam Autoclaves
- Hospital Steam Autoclaves
- Clinical Steam Autoclaves
- Medical Waste Management Steam Autoclaves
- Dental Steam Autoclaves
By Geography
- North America
- Europe
- Germany
- France
- U.K.
- Italy
- Spain
- Rest of Europe
- Asia Pacific
- China
- Japan
- India
- South Korea
- South-east Asia
- Rest of Asia Pacific
- Latin America
- Brazil
- Argentina
- Rest of Latin America
- Middle East & Africa
- GCC Countries
- South Africa
- Rest of the Middle East and Africa
Competitive Landscape
The Portable Steam Autoclaves Market is highly competitive, with key players such as Steris Corporation, Getinge Infection Control, Belimed GmbH, Tuttnauer Co. Ltd., and LTE Scientific Ltd. leading the market. These companies have a significant market presence due to their extensive product portfolios, advanced technology, and strong distribution networks. The competition is driven by the continuous demand for more efficient, compact, and user-friendly sterilization solutions. Key players focus on innovation, offering technologically advanced autoclaves with enhanced features like quicker sterilization cycles, energy efficiency, and eco-friendly capabilities. Strategic collaborations, partnerships, and mergers & acquisitions are common strategies to expand market reach and enhance product offerings. Additionally, regulatory compliance and certifications play a crucial role in ensuring market leadership, as customers prioritize safety and reliability. As the market grows, companies are increasingly investing in research and development to meet the evolving demands of healthcare facilities and laboratories globally.
Shape Your Report to Specific Countries or Regions & Enjoy 30% Off!
Key Player Analysis
- Sakura Seiki Co. Ltd.
- Priorclave Ltd.
- Belimed GmbH
- MELAG Medizintechnik GmbH & Co. KG
- Tuttnauer Co. Ltd.
- Steris Corporation
- Systec GmbH & Co. KG
- Astell Scientific Ltd.
- LTE Scientific Ltd.
- Getinge Infection Control
Recent Developments
- In January 2025, Tuttnauer USA was awarded a Technology Breakthrough designation by Premier, Inc. for its T‑Top Autoclaves line featuring Wi‑Fi connectivity, cloud documentation and upgradeable pre/post‑vacuum functionality.
- In March 2024, Syntegon Holding AG launched its SBM Essential Line of sterilizers (12 sizes, chambers from ~200 to 3,500 litres) incorporating vacuum‑steam combined processes aimed at pharmaceutical sterilization.
- In May 2022, Priorclave Ltd introduced its new “BASE” range of research‑grade autoclaves (including benchtop 40 L & 60 L models) aimed at laboratories with lower sterilisation throughput.
Report Coverage
The research report offers an in-depth analysis based on Product Type, Sales Channel and Geography. It details leading market players, providing an overview of their business, product offerings, investments, revenue streams, and key applications. Additionally, the report includes insights into the competitive environment, SWOT analysis, current market trends, as well as the primary drivers and constraints. Furthermore, it discusses various factors that have driven market expansion in recent years. The report also explores market dynamics, regulatory scenarios, and technological advancements that are shaping the industry. It assesses the impact of external factors and global economic changes on market growth. Lastly, it provides strategic recommendations for new entrants and established companies to navigate the complexities of the market.
Future Outlook
- The Portable Steam Autoclaves Market is expected to witness steady growth due to increasing demand for efficient and compact sterilization solutions in healthcare settings.
- Technological advancements, such as faster sterilization cycles and energy-efficient features, will continue to drive market innovation and adoption.
- The growing focus on infection control and patient safety in hospitals, clinics, and dental facilities will further boost the demand for portable steam autoclaves.
- Eco-friendly and sustainable sterilization solutions are anticipated to gain traction as healthcare facilities prioritize reducing their environmental footprint.
- Emerging markets, particularly in Asia-Pacific and Latin America, will contribute significantly to the expansion of the market due to increased healthcare infrastructure investments.
- As regulations around sterilization become stricter, the demand for reliable and compliant portable steam autoclaves will rise.
- Increased adoption of portable steam autoclaves in dental, medical waste management, and research applications will expand market opportunities.
- The market will see continued consolidation with major players forming strategic partnerships and acquisitions to enhance their product offerings.
- Rising awareness of sterilization standards and hygiene in developing regions will drive the growth of portable steam autoclaves.
- The shift towards more compact and user-friendly autoclave models will cater to small-scale healthcare facilities and improve accessibility for various medical sectors.


