
Market Overview
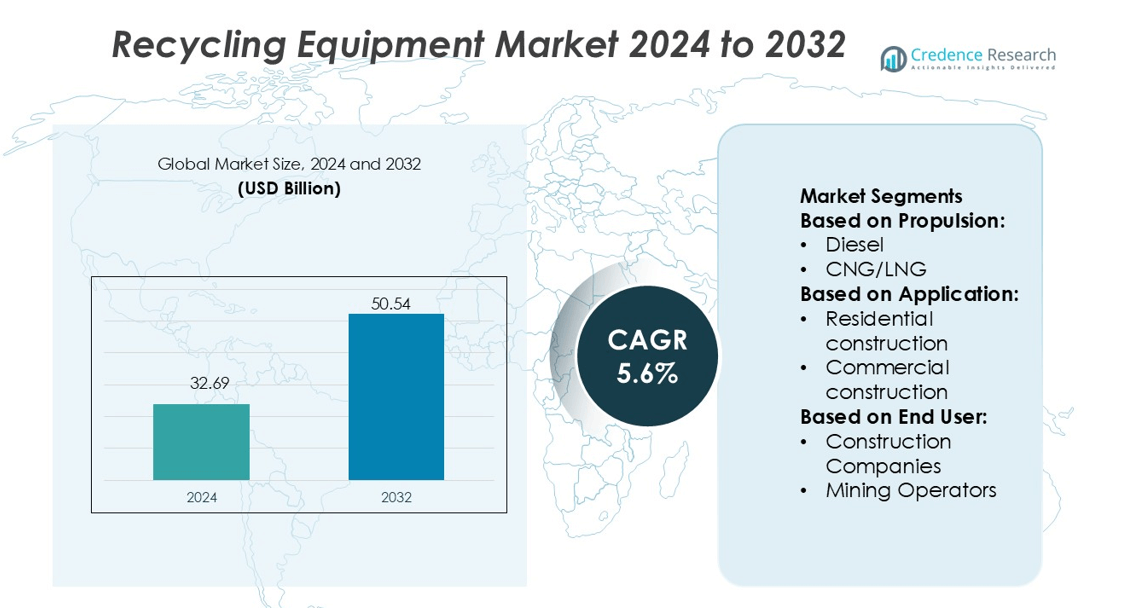
Recycling Equipment Market size was valued USD 32.69 billion in 2024 and is anticipated to reach USD 50.54 billion by 2032, at a CAGR of 5.6% during the forecast period.
| REPORT ATTRIBUTE | DETAILS |
|---|---|
| Historical Period | 2020-2023 |
| Base Year | 2024 |
| Forecast Period | 2025-2032 |
| Recycling Equipment Market Size 2024 | USD 32.69 billion |
| Recycling Equipment Market, CAGR | 5.6% |
| Recycling Equipment Market Size 2032 | USD 50.54 billion |
The recycling equipment market focus on advanced shredders, crushers, balers, sorting lines, and material handling systems for metal, plastic, paper, e-waste, and construction debris processing. Companies emphasize automation, AI-based sorting, telematics, and energy-efficient drives to improve throughput and lower operating costs. Strong service networks, rental fleets, and remote diagnostics help retain customers in municipal and industrial recycling plants. Asia-Pacific remains the leading region with 34% market share, driven by rapid industrialization, rising solid waste volumes, and increasing investment in high-capacity recycling facilities. Government regulations supporting circular economy goals further boost equipment deployment across the region.
Market Insights
- The Recycling Equipment Market was valued at USD 32.69 billion in 2024 and is expected to reach USD 50.54 billion by 2032 at a CAGR of 5.6%.
- Market drivers include rising waste generation, strict environmental regulations, and higher demand for metal, plastic, paper, and e-waste recovery systems, increasing installations of shredders, balers, crushers, and sorting units.
- Market trends highlight rapid adoption of automation, AI-based sorting, telematics, and energy-efficient drives, while rental fleets and remote monitoring improve operational efficiency and reduce downtime for industrial and municipal users.
- Competitive activity remains strong as global and regional manufacturers expand service networks, offer flexible leasing options, and develop modular, multi-material processing systems, but high capital cost and slow infrastructure development in emerging economies remain key restraints.
- Asia-Pacific leads with 34% regional share due to rising investment in high-capacity recycling plants, while shredding and sorting systems continue to gain dominant usage across construction debris, plastic, and e-waste recycling applications.
Market Segmentation Analysis:
By Propulsion
Diesel-powered recycling equipment holds the dominant share because construction and mining sites require high power, long operating hours, and strong load-handling capability. Heavy-duty shredders, crushers, and mobile sorting units run longer on diesel without frequent refueling, which suits remote job sites with limited charging points. CNG/LNG units grow with lower fuel costs and cleaner emissions. Electric units gain attention in urban areas that enforce noise and emission limits. Increasing battery capacity and fast-charging systems support adoption, but diesel remains the leading propulsion due to reliability in harsh conditions and heavy workloads.
- For instance, Hitachi Construction Machinery’s ZX470LCH-5G diesel excavator uses a 235 kW Isuzu 6WG1 engine (net power, per ISO 9249/14396) that delivers a maximum torque of 1,275 Nm and is designed for heavy-duty applications, including large-scale recycling and demolition work.
By Application
Industrial construction represents the leading application segment due to steady waste generation from factories, warehouses, and manufacturing facilities. Large volumes of concrete, metals, and demolition waste demand heavy recycling equipment, boosting the use of crushers, material handlers, and separation systems. Commercial construction follows, supported by renovation projects and retail expansion in urban areas. Residential projects mainly require smaller, mobile units for mixed debris. Mining and quarrying use specialized crushers and screens to process overburden and extracted rock, but the mass volume from industrial construction keeps this segment in the dominant position.
- For instance, Deere & Co. integrated its JDLink telematics system to monitor machines equipped with the 9.0-liter John Deere PowerTech PSS 6090 engine.
By End User
Construction companies account for the largest share because every infrastructure and building project creates bulk waste that needs crushing, screening, and separation. Strict waste disposal regulations and rising landfill charges push contractors to invest in on-site recycling. Government and municipalities expand waste management fleets for urban clean-up and road demolition programs. Rental companies grow as small contractors prefer leased crushers and shredders to reduce capital expenses. Mining operators and industrial users apply high-capacity machines for metal, stone, and concrete recovery, but construction companies remain dominant due to consistent project pipelines and compliance demands.
Key Growth Drivers
Rising Construction and Demolition Waste Generation
Rapid urban expansion and infrastructure upgrades generate large volumes of concrete, metals, asphalt, and mixed debris. Landfill restrictions and rising disposal costs push contractors to adopt crushers, shredders, and sorting systems to reclaim reusable materials. Recycling reduces haul-off trips and supports cost savings on new raw materials. Governments encourage on-site processing to lower carbon emissions linked to transport and quarrying. These factors increase equipment purchases across road building, commercial structures, and industrial sites. As new smart city and redevelopment projects accelerate, demand for high-capacity recycling machinery continues to rise.
- For instance, Abbott’s HeartMate 3 heart pump demonstrated significantly improved five-year outcomes compared to its predecessor, the HeartMate II. The five-year data, presented in 2022, showed that the overall survival rate was 58.4% for patients with the HeartMate 3, compared to 43.7% for those with the HeartMate II.
Government Regulations and Sustainability Targets
Many countries enforce stricter recycling mandates on construction waste, plastics, metals, and industrial by-products. Municipal authorities impose landfill diversion goals and require recycling audits for large projects. Companies invest in material recovery systems to meet green building certifications and environmental reporting rules. Financial benefits like tax credits, lower dumping fees, and recycled-content incentives strengthen equipment adoption. Rising investor pressure for ESG compliance also drives procurement of cleaner, efficient machines. These policy frameworks ensure consistent long-term demand for shredders, balers, screening plants, and automated sorting technologies.
- For instance, Henry Schein’s Blood Control IV Catheter 20-Gauge has a 1-inch beveled tip and comes 50 units per box, 4 boxes per case, ensuring standardization and ease of supply chain handling.
Technological Advancements in Recycling Machinery
Automation, AI-based sorting, and robotic arms improve recovery accuracy for metals, plastics, and aggregates. Modern crushers use variable speed drives and wear-resistant alloys to improve output and service life. Electric and hybrid recycling equipment gain traction in urban zones that enforce strict emission rules. Telematics allow remote monitoring of fuel use, tonnage processed, and maintenance schedules, reducing downtime and ownership costs. As processors demand higher throughput and precise separation, equipment makers offer smarter, modular, and energy-efficient solutions that increase productivity and expand market adoption.
Key Trends & Opportunities
Expansion of On-Site Recycling Solutions
Contractors prefer mobile crushers, compact screens, and small shredders to process waste directly at job sites. On-site crushing reduces trucking costs, noise restrictions, and landfill dependency. Many cities encourage contractors to reuse aggregates for roads, trenches, and backfilling. Rental companies stock mobile units for small builders that avoid capital investments. The trend supports modular and track-mounted systems that move between projects. As material reuse becomes part of tender requirements, portable recycling machines create strong market opportunities across residential, commercial, and municipal works.
- For instance, Terumo’s MEDISAFE WITH The main pump unit measures 77.9 mm x 40.1 mm x 18.9 mm and weighs 34 g (including the cartridge and holder but excluding insulin). The remote control measures 136.2 mm x 75.0 mm x 14.3 mm and weighs 152 g (including two AAA batteries).
Circular Economy Adoption in Manufacturing
Manufacturers redesign processes to recover metals, plastics, and industrial scrap for closed-loop production. Advanced balers, granulators, and pelletizers support recycled material quality that meets OEM standards. Electronics, automotive, and packaging industries increase recycled content demand, raising equipment sales for sorting and material refinement. Automation improves purity levels, helping meet customer and regulatory expectations. Circular economy initiatives attract investment in large-scale recycling plants, providing strong growth opportunities for high-capacity equipment makers and technology suppliers.
- For instance, BD’s primary IV administration sets for pediatric use often feature microbore tubing under 2 mm internal diameter, which minimizes priming volume and suits low-volume infusions.
Rising Use of Electric and Energy-Efficient Machinery
Cities with emission-control zones encourage electric crushers, screens, and conveyors. Quiet operation supports night-time construction and dense urban projects. Battery capacity and fast-charging improvements make electric units viable for multiple shifts. Manufacturers introduce hybrid powertrains to lower fuel use and reduce maintenance costs. Buyers focus on total cost of ownership, giving energy-efficient equipment a market edge. This trend benefits suppliers who invest in electrification, lightweight components, and smart power management systems.
Key Challenges
High Capital Investment and Maintenance Costs
Recycling equipment like mobile crushers, automated sorters, and industrial shredders require significant upfront spending. Small contractors and waste operators often choose rental options due to limited budgets. Wear parts, fuel consumption, and maintenance add long-term operating costs. Many small facilities struggle to justify investment without guaranteed waste volumes. These financial barriers slow adoption, especially in developing regions with low landfill fees and weak recycling policies.
Variability in Waste Stream Quality and Logistics
Mixed waste streams increase contamination, reducing output quality and equipment efficiency. Sorting heavy debris, metals, and plastics requires advanced screening and separation systems, raising cost and complexity. Transporting waste to centralized facilities adds logistical challenges, particularly in remote regions. Inconsistent material flows from seasonal construction activity affect utilization rates. These issues force operators to invest in better preprocessing and automation, but adoption remains uneven across smaller players.
Regional Analysis
North America
North America holds 31% of the global recycling equipment market due to strong waste management policies, high packaging waste generation, and rapid adoption of advanced shredders, balers, and sorting systems. The United States leads regional demand, supported by rising investment in material recovery facilities and automated recycling lines. Industrial sectors promote metal, paper, and plastic recovery to cut landfill pressure and comply with sustainability mandates. Equipment suppliers focus on robotics, AI-based sorting, and energy-efficient machinery. Government incentives for circular economy programs further boost sales. Increasing e-waste and construction debris recycling also support steady equipment replacement cycles across the region.
Europe
Europe accounts for 29% market share and remains a mature recycling technology hub. Strict landfill bans, packaging regulations, and extended producer responsibility laws drive machinery adoption across municipal and industrial sectors. Countries such as Germany, France, and the UK deploy advanced material recovery facilities using sensor-based sorting, high-capacity balers, and metal separators to improve recycling yield. Demand rises from construction and automotive industries for metal, concrete, and plastic reprocessing. Public investment in circular economy programs and urban waste treatment upgrades fuels sales. Recycling machinery makers in Europe emphasize automation, modular lines, and low-emission operation to meet environmental goals.
Asia-Pacific
Asia-Pacific leads the global market with 34% share, supported by rapid industrialization, high plastic waste volumes, and growing recycling regulations. China, Japan, and India expand plastic, metal, and paper recycling capacities to reduce landfill pressure and promote circular manufacturing. Manufacturers invest in shredders, crushers, and washing systems suitable for large-volume processing. Growth in packaging, e-commerce, automotive, and construction sectors increases waste output, pushing demand for high-capacity recycling solutions. Regional governments promote domestic recycling over waste exports, which boosts machinery installations. Local and global equipment suppliers expand production and service networks to meet rising demand from municipal and industrial users.
Latin America
Latin America holds 4% market share, driven by gradual adoption of recycling infrastructure across Brazil, Mexico, Chile, and Colombia. Urban solid waste generation increases demand for balers, crushers, and sorting systems in municipal facilities. Industrial users adopt metal and plastic reprocessing machinery to reduce disposal costs and comply with sustainability targets. Growth remains moderate due to funding constraints and limited recycling facilities, but public-private partnerships are expanding. International suppliers offer affordable, automated systems tailored to local operations. Rising awareness of landfill pollution, plastic waste, and resource recovery supports equipment growth across packaging, beverage, and construction sectors.
Middle East & Africa
Middle East & Africa represent 2% market share, with slow but rising adoption of recycling equipment. Gulf countries invest in modern waste treatment plants as part of zero-waste and sustainability agendas. Construction and demolition waste recycling drives demand for crushers, screeners, and separators. South Africa, UAE, and Saudi Arabia lead investments in plastic and metal recycling lines. Limited local manufacturing capacity increases dependence on international suppliers. Municipal modernization, tourism waste management, and landfill reduction programs support equipment installations. Although infrastructure gaps persist, rising environmental regulation and industrial recycling initiatives create long-term opportunities in the region.
Market Segmentations:
By Propulsion:
- Diesel
- CNG/LNG
By Application:
- Residential construction
- Commercial construction
By End User:
- Construction Companies
- Mining Operators
By Geography
- North America
- U.S.
- Canada
- Mexico
- Europe
- Germany
- France
- U.K.
- Italy
- Spain
- Rest of Europe
- Asia Pacific
- China
- Japan
- India
- South Korea
- South-east Asia
- Rest of Asia Pacific
- Latin America
- Brazil
- Argentina
- Rest of Latin America
- Middle East & Africa
- GCC Countries
- South Africa
- Rest of the Middle East and Africa
Competitive Landscape
The Recycling Equipment Market players such as Hitachi Construction Machinery, Deere & Co., Terex, Komatsu, CNH Industrial, Volvo, Liebherr, Caterpillar, Sany, and Doosan. The competitive landscape features global and regional manufacturers offering a wide mix of recycling machinery such as shredders, crushers, balers, sorters, washing lines, and material handlers. Competition centers on automation, durability, and energy-efficient operation, as recycling facilities demand higher throughput and lower processing costs. Companies invest in AI-based optical sorting, robotic pickers, and sensor-driven separation systems to increase material purity and reduce labor dependency. Electric and hybrid equipment is gaining traction as operators adopt low-emission fleets to meet environmental compliance standards. Strong aftersales support, rental fleets, and remote monitoring services enhance customer retention. Pricing competitiveness remains high in developing markets, where buyers prioritize affordability and simple maintenance. Strategic partnerships with waste processors, EPC contractors, and municipal bodies help manufacturers expand their installed base. Technology upgrades, modular designs, and multi-material processing capabilities continue to shape competition as recycling transitions toward smarter, automated, and cost-efficient operations worldwide.
Key Player Analysis
- Hitachi Construction Machinery
- Deere & Co.
- Terex
- Komatsu
- CNH Industrial
- Volvo
- Liebherr
- Caterpillar
- Sany
- Doosan
Recent Developments
- In December 2024, Honeywell's Phoenix Controls released the Critical Spaces Control Platform, which uses automated venturi valves to manage airflow for enhanced safety and efficiency in sensitive environments like hospitals, labs, and cleanrooms. This platform provides precise environmental control by dynamically adjusting ventilation based on real-time data.
- In March 2024, Nederman’s MCP Air Purification Tower (APT) is designed to protect fabrication workers from airborne hazards, specifically welding fumes and fine dust. It is a continuous duty, ambient filtration solution used in industrial environments, particularly when source capture is not practical.
- In October 2023, General Kinematics, a vibratory equipment manufacturer in Crystal Lake, Illinois, announced the completion of a 42,000-square-foot expansion of its manufacturing space. The expansion includes high bay ceilings for 80-ton cranes, additional space for capital equipment, and increased storage, allowing the company to meet growing demand for larger machinery for the mining, foundry, and recycling industries
Report Coverage
The research report offers an in-depth analysis based on Propulsion, Application, End-User and Geography. It details leading market players, providing an overview of their business, product offerings, investments, revenue streams, and key applications. Additionally, the report includes insights into the competitive environment, SWOT analysis, current market trends, as well as the primary drivers and constraints. Furthermore, it discusses various factors that have driven market expansion in recent years. The report also explores market dynamics, regulatory scenarios, and technological advancements that are shaping the industry. It assesses the impact of external factors and global economic changes on market growth. Lastly, it provides strategic recommendations for new entrants and established companies to navigate the complexities of the market.
Future Outlook
- Demand for automated sorting systems will increase as recycling plants move toward higher material purity.
- More facilities will adopt electric and hybrid recycling machines to reduce emissions and fuel costs.
- Growth in e-waste recycling will boost sales of crushers, shredders, and separation units.
- Municipal waste modernization will expand installations of balers, compactors, and advanced sorting lines.
- Construction and demolition recycling will drive demand for heavy-duty crushers and screeners.
- Robotics and AI-based separation tools will reduce labor needs and improve accuracy in material recovery.
- Rising circular economy policies will encourage investment in high-capacity recycling plants.
- Cloud-based monitoring and predictive maintenance will support higher equipment uptime.
- Equipment rental and leasing models will expand as small operators seek lower capital costs.
- Manufacturers will focus on modular, flexible systems that can process multiple waste streams.

Request a Free Sample
Fill in your details and we'll send you a free sample report.
- Sample data tables & charts
- Research methodology
Need a Custom Version of This Report?
Tailor the scope, geography, or segments to your exact requirements.
- Custom geography or segment scope
- Direct access to our analyst team
Frequently Asked Questions
What is the current market size for the Recycling Equipment Market, and what is its projected size in 2032?
At what Compound Annual Growth Rate is the Recycling Equipment Market projected to grow between 2025 and 2032?
Which Recycling Equipment Market segment held the largest share in 2024?
What are the primary factors fueling the growth of the Recycling Equipment Market?
Who are the leading companies in the Recycling Equipment Market?
Which region commanded the largest share of the Recycling Equipment Market in 2024?
Table of Content
Chapter 1 Market Segmentation
- 1.1 Segmentation Framework
- 1.1.1 Product and Service Classification
- 1.1.2 Application and End-Use Classification
- 1.1.3 Technology and Solution Classification
- 1.1.4 Customer and Distribution Channel Classification
- 1.1.5 Geographic Segmentation
- 1.1.6 Market Segment Definitions and Boundaries
Chapter 2 Introduction
- 2.1 Report Objectives and Scope
- 2.2 Product Definition and Industry Terminology
- 2.3 Market Inclusions and Exclusions
- 2.4 Research Process
- 2.4.1 Primary Research and Expert Interviews
- 2.4.2 Secondary Research and Source Review
- 2.4.3 Top-Down and Bottom-Up Estimation
- 2.4.4 Data Triangulation and Verification
- 2.5 Market Size Measurement Basis
- 2.5.1 2024: USD 32.69 billion → 2032: USD 50.54 billion
- 2.6 Historical and Forecast Reference Periods
- 2.6.1 Base Year: 2024
- 2.6.2 Forecast Period: 2024-2032
- 2.7 Research Assumptions and Limitations
Chapter 3 Executive Summary
- 3.1 Market Snapshot and Key Findings
- 3.2 Base-Year Market Size, 2024
- 3.3 Forecast Market Size, 2032
- 3.4 Revenue and Volume Growth Outlook
- 3.5 Key Demand and Supply Indicators
- 3.6 Leading Market Segments
- 3.7 Fastest-Growing Market Opportunities
- 3.8 Regional Performance Highlights
- 3.9 Technology and Industry Transformation
- 3.10 Competitive Landscape Summary
- 3.11 Analyst View and Strategic Implications
Chapter 4 Global Recycling Equipment Market Trends and Developments
- 4.1 Historical Industry Development
- 4.2 Recent Market Trends and Developments
- 4.3 Demand and Customer Behavior Trends
- 4.4 Technology and Product Innovation
- 4.5 Artificial Intelligence, Automation and Digitalization
- 4.6 Local Manufacturing and Supply Chain Realignment
- 4.7 Industry Partnerships, Mergers and Acquisitions
- 4.8 Sustainability and Circular Economy Developments
- 4.9 Government and Private Sector Investment Trends
- 4.10 Emerging Business Models and Commercialization
- 4.11 Industry Developments and Announcements
Chapter 5 Global Recycling Equipment Market Production, Supply and Demand Analysis
- 5.1 Demand Trend and Consumption Analysis
- 5.2 Demand Forecast, 2024-2032
- 5.3 Production and Output Trend
- 5.4 Production and Output Forecast, 2024-2032
- 5.5 Installed Capacity and Capacity Utilization
- 5.6 Company-Wise Production Plants and Statistics
- 5.6.1 Installed Production Capacity
- 5.6.2 Actual Production
- 5.6.3 Planned Capacity and Expansion Targets
- 5.7 Supply Chain Structure and Procurement Trends
- 5.8 Supply-Demand Gap and Bottlenecks
- 5.9 Import Dependence and Sourcing Structure
- 5.10 Contract Manufacturing and Outsourcing
- 5.11 Regional Supply and Demand Concentration
Chapter 6 Global Recycling Equipment Market Pricing Analysis
- 6.1 Pricing Structure and Measurement
- 6.2 Historical Pricing Trends
- 6.3 Pricing Outlook, 2024-2032
- 6.4 Average Selling Price and Unit Economics
- 6.5 Pricing by Product and Market Segment
- 6.6 Geographic Pricing Differences
- 6.7 Key Input, Energy, Labor and Logistics Costs
- 6.8 Contract Pricing and Purchasing Models
- 6.9 Pricing Sensitivity and Competitive Positioning
- 6.10 Price, Margin and Profitability Implications
Chapter 7 Global Recycling Equipment Market Dynamics
- 7.1 Market Growth Drivers
- 7.1.1 Demand-Side Drivers
- 7.1.2 Technology and Innovation Drivers
- 7.1.3 Infrastructure and Investment Drivers
- 7.1.4 Regulatory and Policy Drivers
- 7.2 Market Restraints
- 7.2.1 Cost and Affordability Constraints
- 7.2.2 Technology and Adoption Barriers
- 7.2.3 Supply Chain and Operational Constraints
- 7.3 Market Challenges
- 7.3.1 Competitive Pressure and Margin Erosion
- 7.3.2 Skills, Infrastructure and Implementation Gaps
- 7.4 Emerging Market Opportunities
- 7.5 Market Dynamics Impact and Time-Horizon Assessment
Chapter 8 Global Recycling Equipment Value Chain Analysis
- 8.1 Industry Value Chain Overview
- 8.2 Upstream Suppliers and Critical Inputs
- 8.3 Technology and Component Providers
- 8.4 Manufacturing or Service Delivery
- 8.5 Distribution, Channel Partners and Integrators
- 8.6 Downstream Applications and End Users
- 8.7 Value Addition and Profit Pools
- 8.8 Vertical Integration and Outsourcing
- 8.9 Supplier Concentration and Risk
- 8.10 Supply Chain Localization and Resilience
Chapter 9 Global Recycling Equipment Market Regulations and Policies
- 9.1 Relevant Laws, Standards and Compliance Frameworks
- 9.2 Product, Service, Safety and Quality Requirements
- 9.3 Government Policies, Incentives and Subsidies
- 9.4 Imports, Exports and Trade Barriers
- 9.5 Public Procurement and Local Content Requirements
- 9.6 Environmental and Sustainability Compliance
- 9.7 Upcoming Policy Changes and Market Implications
Chapter 10 Global Recycling Equipment Market Hotspots and Opportunities
- 10.1 Market Opportunity Mapping and Growth Hotspots
- 10.2 High-Growth Applications and Customer Groups
- 10.3 Underserved Markets and White-Space Opportunities
- 10.4 Emerging Technology and Product Opportunities
- 10.5 New Capacity and Investment Hotspots
- 10.6 Market Entry and Expansion Opportunities
- 10.7 Distribution and Partnership Opportunities
- 10.8 Near-Term and Long-Term Commercial Potential
- 10.9 Opportunity Attractiveness and Execution Risks
Chapter 11 Global Recycling Equipment Market Outlook, 2024-2032
- 11.1 Market Size and Analysis
- 11.1.1 Revenue (Market Measurement: 2024: USD 32.69 billion → 2032: USD 50.54 billion)
- 11.1.2 Market Volume and Quantity Sold
- 11.1.3 Historical Market Size
- 11.1.4 Base-Year Market Size, 2024
- 11.2 Market Forecast, 2024-2032
- 11.2.1 Revenue Forecast to 2032
- 11.2.2 Volume Forecast to 2032
- 11.2.3 CAGR and Year-on-Year Growth
- 11.2.4 Incremental Revenue Opportunity
- 11.3 Forecast Assumptions and Scenario Analysis
- 11.3.1 Base-Case Forecast
- 11.3.2 Optimistic and Conservative Scenarios
- 11.3.3 Technology, Pricing and Policy Sensitivities
- 11.4 Market Attractiveness and Growth Outlook
Chapter 12 Global Recycling Equipment Market Segmentation and Outlook
- 12.1 Segmentation Summary and Market Shares, 2024
- 12.2 Largest and Fastest-Growing Segments
- 12.3 Segment Growth Comparison
- 12.4 Segment Attractiveness and Priority Matrix
Chapter 13 Global Recycling Equipment Geographic Market Outlook, 2024-2032
- 13.1 Regional Market Size and Share, 2024
- 13.2 Regional Market Forecast, 2024-2032
- 13.3 Regional Pricing, Production and Demand Differences
- 13.4 North America
- 13.4.1 United States
- 13.4.2 Canada
- 13.4.3 Mexico
- 13.5 Europe
- 13.5.1 Germany
- 13.5.2 France
- 13.5.3 Italy
- 13.5.4 United Kingdom
- 13.5.5 Spain
- 13.5.6 Poland
- 13.5.7 Russia
- 13.5.8 Netherlands
- 13.5.9 Belgium
- 13.5.10 Sweden
- 13.5.11 Denmark
- 13.5.12 Norway
- 13.5.13 Rest of Europe
- 13.6 Asia Pacific
- 13.6.1 China
- 13.6.2 India
- 13.6.3 Japan
- 13.6.4 South Korea
- 13.6.5 Thailand
- 13.6.6 Indonesia
- 13.6.7 Vietnam
- 13.6.8 Malaysia
- 13.6.9 Australia
- 13.6.10 Rest of Asia Pacific
- 13.7 Latin America
- 13.7.1 Brazil
- 13.7.2 Argentina
- 13.7.3 Colombia
- 13.7.4 Chile
- 13.7.5 Rest of Latin America
- 13.8 Middle East
- 13.8.1 Saudi Arabia
- 13.8.2 United Arab Emirates
- 13.8.3 Turkey
- 13.8.4 Israel
- 13.8.5 Iran
- 13.8.6 Rest of the Middle East
- 13.9 Africa
- 13.9.1 South Africa
- 13.9.2 Egypt
- 13.9.3 Nigeria
- 13.9.4 Morocco
- 13.9.5 Rest of Africa
- 13.10 Regional Investment, Policy and Supply Chain Differences
- 13.11 Regional Competitive Landscape
- 13.12 Geographic Growth Hotspots
Chapter 14 Global Recycling Equipment Technology, Innovation and Sustainability Outlook
- 14.1 Technology Landscape and Maturity
- 14.2 Product, Process and Service Innovation
- 14.3 AI, Automation and Digital Tools in the Industry
- 14.4 Technology Adoption and Performance Benchmarking
- 14.5 Innovation Pipeline and R&D Investment
- 14.6 Patent and Intellectual Property Trends
- 14.7 Energy Efficiency and Resource Management
- 14.8 Sustainability, Recycling and Circularity
- 14.9 Technology Roadmap, 2024-2032
- 14.10 Risks of Obsolescence and Technology Substitution
Chapter 15 Global Recycling Equipment Market Key Strategic Imperatives
- 15.1 Growth and Market Entry Priorities
- 15.2 High-Return Products and Segments
- 15.3 Pricing, Profitability and Cost Optimization
- 15.4 Technology Investment and Product Differentiation
- 15.5 Supply Chain Localization and Resilience
- 15.6 Distribution and Customer Acquisition
- 15.7 Partnership, Acquisition and Capacity Strategy
- 15.8 Regional Expansion Priorities
- 15.9 Short-, Medium- and Long-Term Actions
Chapter 16 Competition Outlook
- 16.1 Industry Competition Characteristics
- 16.2 Market Structure and Concentration
- 16.3 Market Share and Competitive Positioning, 2024
- 16.4 Company-Wise Revenue and Product Benchmarking
- 16.5 Production and Service Capacity Benchmarking
- 16.6 Technology, Pricing and Differentiation
- 16.7 Regional Footprint and Distribution Strength
- 16.8 Mergers, Acquisitions and Strategic Alliances
- 16.9 New Entrants and Competitive Threats
- 16.10 Porter's Five Forces and Industry Attractiveness
- 16.11 Competitive Outlook, 2024-2032
Chapter 17 Company Profiles
- 17.1 Company Coverage and Selection Criteria
- 17.2 Leading Market Participants – Standard Profile Structure
- 17.2.1 Business Description
- 17.2.2 Company Ownership and Geographic Presence
- 17.2.3 Product and Service Portfolio
- 17.2.4 Manufacturing and Operating Footprint
- 17.2.5 Production Capacity and Expansion Plans
- 17.2.6 Financial Performance and Investment
- 17.2.7 Market Share and Competitive Position
- 17.2.8 Technology and Innovation Capabilities
- 17.2.9 Strategic Alliances or Partnerships
- 17.2.10 Recent Developments
- 17.2.11 Growth Strategy and Outlook
- 17.3 Other Relevant Market Participants
Note: Every listed company is profiled on the structure shown under the first company. The company list is preliminary and may change based on research findings, market developments, data availability and client requirements.
Chapter 18 Disclaimer
- 18.1 Research and Forecast Disclaimer
- 18.2 Data Source and Estimation Limitations
Note: The depth of individual sections depends on data availability for this market. Volume, capacity, trade and other unit-based metrics are included where applicable.

