Market Overview
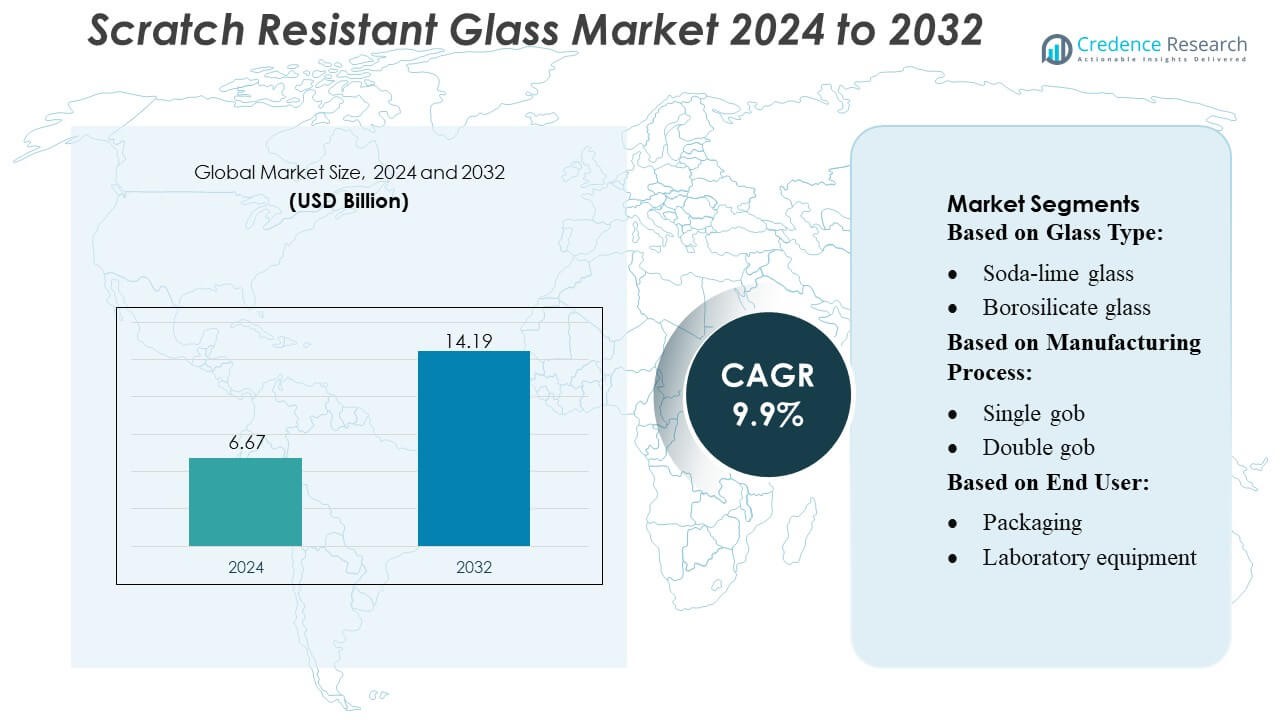
Scratch Resistant Glass Market size was valued USD 6.67 billion in 2024 and is anticipated to reach USD 14.19 billion by 2032, at a CAGR of 9.9% during the forecast period.
| REPORT ATTRIBUTE |
DETAILS |
| Historical Period |
2020-2023 |
| Base Year |
2024 |
| Forecast Period |
2025-2032 |
| Scratch Resistant Glass Market Size 2024 |
USD 6.67 Billion |
| Scratch Resistant Glass Market, CAGR |
9.9% |
| Scratch Resistant Glass Market Size 2032 |
USD 14.19 Billion |
The Scratch Resistant Glass Market is shaped by established players such as Vitro, Nippon Electric Glass Co., Ltd., AGI glaspac, Guardian Industries, Fuyao Glass Industry Group Co. Ltd., 3B – the fiberglass company, AGC Inc., Nihon Yamaura Glass Co., Ltd., Saint-Gobain, and O-I Glass Inc., all of which compete through advancements in surface hardness, coating technologies, and ultra-thin glass manufacturing. These companies strengthen their positions through R&D investment, OEM partnerships, and expanded production capabilities. Asia Pacific leads the global market with approximately 38% share, driven by its dominant electronics manufacturing base, rapid automotive digitalization, and cost-efficient material production ecosystem.
Access crucial information at unmatched prices!
Request your sample report today & start making informed decisions powered by Credence Research Inc.!
Download Sample
Market Insights
- The Scratch Resistant Glass Market was valued at USD 6.67 billion in 2024 and is projected to reach USD 14.19 billion by 2032, registering a CAGR of 9.9% during the forecast period.
- Strong demand from smartphones, wearables, and automotive display systems drives adoption as manufacturers prioritize durability, clarity, and advanced nano-coating solutions across high-usage surfaces.
- The market experiences rising trends in ultra-thin, flexible, and lightweight glass technologies, supported by expanding applications in foldable devices, connected vehicles, and precision laboratory equipment.
- Competitive activity intensifies as leading players enhance R&D, strengthen OEM alliances, and expand production capacity, while restraints emerge from high manufacturing costs and technical complexities in ultra-thin formats.
- Asia Pacific holds 38% of the global share, leading through electronics manufacturing strength, while North America and Europe follow; consumer electronics account for the largest segment share, supported by growth in automotive and laboratory applications.
Market Segmentation Analysis:
By Glass Type
Soda-lime glass holds the largest market share of the Scratch Resistant Glass Market, capturing nearly 40–45% due to its widespread availability, cost efficiency, and improved durability achieved through chemical strengthening treatments. Its dominance stems from strong adoption across packaging, household applications, and commercial containers, supported by continuous advancements in surface-hardening processes. Borosilicate and heat-resistant glass segments show steady growth as premium categories, driven by superior thermal performance and expanding use in laboratory and pharmaceutical environments. Crystal, lead-free crystal, and colored glass remain niche but gain traction as brands emphasize premium aesthetics and product differentiation.
- For instance, Abrisa Technologies applies a chemical-strengthening process via sodium-potassium ion exchange on soda-lime and float glass, which can be treated for 8 to 16 hours to achieve a balance of hardness and bending strength — making such glass suitable for thin displays (from 0.03 mm up to ~3.0 mm thickness).
By Manufacturing Process
The press process stands as the dominant sub-segment with an estimated 35–40% market share, supported by its precision, mold consistency, and suitability for producing uniform, scratch-resistant surfaces at scale. Its adoption strengthens as manufacturers prioritize high throughput and dimensional accuracy for packaging and consumer product applications. Blow and blow, press and blow, and NNPB processes experience rising demand due to their ability to support lightweighting while maintaining surface hardness. Combined and hand-crafted processes retain smaller shares, serving high-end or specialty designs that rely on artisanal finishing and customized scratch-resistant coatings.
- For instance, AGI operates multiple state-of-the-art manufacturing plants in Hyderabad and Bhongir, where combined melt capacity exceeds 1600 tonnes per day.
By End User
The food and beverage segment leads the market with roughly 45–50% market share, driven by the large-scale use of scratch-resistant glass in bottles, jars, and premium packaging formats that require durability during filling, transport, and retail handling. Alcoholic and non-alcoholic beverage brands accelerate adoption to enhance product appeal and extend packaging longevity. Pharmaceutical and laboratory equipment applications continue to expand as regulatory emphasis on chemical resistance and clarity pushes demand for high-strength, scratch-resistant borosilicate and specialty glass solutions. Packaging innovations across sectors reinforce sustained uptake of hardened and coated glass options.
Key Growth Drivers
- Rising Demand for Durable Consumer Electronics
The Scratch Resistant Glass Market grows steadily as smartphone, tablet, and wearable manufacturers prioritize materials that extend product lifespan. Consumers expect devices with superior surface hardness, reduced micro-abrasion, and higher optical clarity, pushing OEMs to adopt advanced engineered glass. The integration of anti-scratch coatings in high-end devices enhances user experience and reduces replacement rates, strengthening demand. Expanding 5G smartphone shipments and premiumization trends across Asia and Europe further accelerate market adoption.
- For instance, Fuyao announced a new plant in Hefei, China with an annual production capacity of 2,610 million square meters of automotive glass, along with two high-quality float-glass lines.
- Expanding Use in Automotive Displays and Interiors
Automotive OEMs increasingly incorporate large digital touchscreens, HUDs, and infotainment panels, driving strong demand for scratch-resistant glass. This material withstands continuous touch interaction, UV exposure, and cleaning cycles, ensuring long-term visibility and safety. Luxury and mid-range vehicles both integrate such advanced glass to improve cabin aesthetics and durability. Electrification and connected-car ecosystems reinforce the requirement for robust display protection, boosting replacement and aftermarket opportunities in major auto-manufacturing regions.
- For instance, AGC can produce glass as thin as 0.23 mm (or customised thinner) while maintaining high flatness and quality — makes it suitable for high-precision cover-glass applications, including displays or touch panels, not just conventional architectural or automotive glazing.
- Growing Applications in Packaging and Laboratory Equipment
The market benefits from increasing use of scratch-resistant glass in high-value packaging and laboratory environments where chemical exposure and frequent handling necessitate durable surfaces. Pharmaceutical, food, and specialty chemicals industries deploy borosilicate and soda-lime variants for enhanced reliability. Rising R&D activities, stringent safety standards, and the shift toward high-performance reusable packaging expand adoption. The growth of biotech labs and precision research facilities further strengthens demand for scratch-resistant, thermally stable glass solutions.
Key Trends & Opportunities
- Advancements in Coating Technologies
Emerging nano-coatings, hybrid polymer layers, and plasma-enhanced deposition techniques are reshaping performance standards in scratch-resistant glass. These innovations provide improved hardness, smudge resistance, and optical purity while reducing production costs. Manufacturers benefit from opportunities to supply enhanced coatings for consumer electronics and automotive interfaces. The trend supports differentiation strategies for OEMs seeking premium product positioning across global markets.
- For instance, Saint-Gobain successfully produced flat glass in a trial run using a furnace fuel mix containing more than 30% hydrogen (instead of relying solely on fossil fuels), at its Herzogenrath plant in Germany.
- Increasing Adoption of Flexible and Lightweight Glass
The shift toward flexible, ultra-thin, and lightweight glass materials opens new opportunities in wearables, foldable devices, and curved automotive displays. Manufacturers are scaling production of chemically strengthened flexible substrates to meet evolving design requirements. This trend enables wider application potential while offering improved bendability and surface protection. Strong R&D funding and advances in lamination techniques further support the expansion of lightweight scratch-resistant solutions.
- For instance, O-I recently completed a biofuel-based glass-making trial at its Harlow (UK) plant: using 100% biofuel (rather than natural gas), combined with 88% cullet (recycled glass) and oxy-fuel furnace technology, to produce amber bottles — demonstrating the technical viability of large-scale, low-carbon glass production.
- Sustainability and High-Recyclability Focus
Sustainability initiatives create new market prospects as industries seek recyclable and long-lasting materials. Scratch-resistant glass offers strong environmental advantages over polymer alternatives, including longer service life and reduced waste. Manufacturers adopting energy-efficient furnaces and eco-friendly coating processes gain a competitive edge. Regulatory pressure in North America and Europe encourages wider deployment of sustainable glass packaging and electronics components.
Key Challenges
- High Production and Material Costs
Manufacturing scratch-resistant glass requires precise thermal treatment, chemical strengthening, and advanced coating methods, which elevate production costs. These expenses often limit adoption in low-cost electronics, budget vehicles, and price-sensitive packaging. Volatile raw material prices further impact profitability for glass producers. Manufacturers must balance durability requirements with affordability to expand penetration in emerging markets.
- Technical Limitations in Ultra-Thin and Flexible Designs
Although thin and flexible glass is in demand, producing it with high scratch resistance remains technologically complex. Ensuring hardness, optical clarity, and structural reliability in extremely slim formats poses ongoing engineering challenges. Breakage risks during forming, laminating, and folding also constrain mass-market scalability. These limitations slow adoption in foldable electronics and next-generation automotive displays, requiring significant R&D investments to overcome performance trade-offs.
Regional Analysis
North America
North America holds around 28% of the Scratch Resistant Glass Market, supported by strong adoption of premium smartphones, high-end wearables, and advanced automotive displays. The region benefits from robust consumer spending, early technology uptake, and strong presence of electronics and automotive OEMs. Automakers increasingly integrate large infotainment and instrument cluster screens, boosting demand for durable glass solutions. Growing investments in research labs and pharmaceutical packaging further reinforce the market. The United States drives the majority of consumption, while Canada shows rising traction in laboratory and industrial applications.
Europe
Europe accounts for nearly 25% of the market, driven by strong automotive manufacturing clusters in Germany, France, and the U.K., where scratch-resistant glass is widely adopted in digital dashboards, control panels, and safety systems. The region’s stringent quality and durability standards encourage advanced material uptake across electronics, medical devices, and laboratory equipment. Rising demand for premium consumer electronics and sustainable high-performance packaging supports additional growth. R&D investments in optical coatings and strengthened glass technologies create competitive opportunities for European suppliers. Eastern European markets show increasing adoption due to expanding electronics assembly operations.
Asia Pacific
Asia Pacific dominates the Scratch Resistant Glass Market with approximately 38% share, driven by large-scale electronics manufacturing in China, South Korea, Japan, and emerging hubs like Vietnam and India. High smartphone production, growing wearable shipments, and expanding automotive display integration accelerate demand. The region’s cost-efficient manufacturing ecosystem and rapid adoption of flexible and lightweight glass technologies strengthen its leadership. Increasing investments in pharmaceuticals, biotechnology labs, and high-value packaging also contribute to rising consumption. Strong domestic demand and export-oriented production make APAC the fastest-growing regional market.
Latin America
Latin America holds roughly 5% of global market share, supported by gradual adoption of advanced smartphones, connected automotive systems, and laboratory equipment. Countries such as Brazil and Mexico lead regional demand due to expanding electronics retail penetration and growing automotive manufacturing activities. The region benefits from rising investments in healthcare and diagnostics, driving the need for durable laboratory glass. However, price sensitivity and limited local manufacturing capacity slow broader adoption of premium scratch-resistant materials. Import dependence creates opportunities for international suppliers to strengthen distribution networks.
Middle East & Africa
The Middle East & Africa region captures about 4% of the market, driven by increasing consumption of high-end consumer electronics, expanding automotive imports, and growing laboratory infrastructure. GCC countries lead adoption due to higher purchasing power, strong preference for premium smartphones, and ongoing digitalization initiatives. Industrial and healthcare investments across the UAE, Saudi Arabia, and South Africa support additional demand. However, market growth remains constrained by limited local manufacturing and reliance on imported materials. Suppliers benefit from emerging opportunities tied to expanding retail electronics and medical research sectors.
Market Segmentations:
By Glass Type:
- Soda-lime glass
- Borosilicate glass
By Manufacturing Process:
By End User:
- Packaging
- Laboratory equipment
By Geography
- North America
- Europe
- Germany
- France
- U.K.
- Italy
- Spain
- Rest of Europe
- Asia Pacific
- China
- Japan
- India
- South Korea
- South-east Asia
- Rest of Asia Pacific
- Latin America
- Brazil
- Argentina
- Rest of Latin America
- Middle East & Africa
- GCC Countries
- South Africa
- Rest of the Middle East and Africa
Competitive Landscape
The Scratch Resistant Glass Market features a competitive landscape led by major players such as Vitro, Nippon Electric Glass Co., Ltd., AGI glaspac, Guardian Industries, Fuyao Glass Industry Group Co. Ltd., 3B – the fiberglass company, AGC Inc., Nihon Yamaura Glass Co., Ltd., Saint-Gobain, and O-I Glass Inc. The Scratch Resistant Glass Market is characterized by continuous innovation, capacity expansion, and strategic alignment with high-growth end-use industries. Manufacturers prioritize advancing surface hardness, enhancing optical clarity, and integrating anti-smudge or anti-reflective coatings to meet stringent performance expectations across consumer electronics, automotive displays, and laboratory equipment. Competition intensifies as producers focus on lightweight, flexible, and sustainable glass solutions that align with emerging design trends. Companies strengthen their positions through investments in R&D, long-term supply agreements with OEMs, and the adoption of energy-efficient production technologies. The market increasingly rewards suppliers that offer high customization, consistent quality, and rapid response to evolving product specifications.
Shape Your Report to Specific Countries or Regions & Enjoy 30% Off!
Key Player Analysis
- Vitro
- Nippon Electric Glass Co., Ltd.
- AGI glaspac
- Guardian Industries
- Fuyao Glass Industry Group Co. Ltd.
- 3B – the fiberglass company
- AGC Inc.
- Nihon Yamaura Glass Co., Ltd.
- Saint-Gobain
- O-I Glass Inc.
Recent Developments
- In January 2025, AGC Glass Europe, the European branch of world leading glass manufacturer AGC, announces a major investment in a new insulating vacuum glass production line. This initiative aims to enhance glass manufacturing capabilities, responding to increasing customer demand for innovative solutions.
- In January 2025, Gold Plus Glass Industry Limited announced the successful commissioning of its manufacturing facility in Karnataka, which expanded its total float glass capacity to over one million metric tons annually and marked its entry into solar glass manufacturing.
- In June 2024, Corning launched Gorilla Glass 7i a new scratch-resistant cover glass for value and intermediate smartphones, which lab tests show can withstand drops from up to one meter onto asphalt-like surfaces, surpassing competitive lithium aluminosilicate glasses. It is also claimed to be up to twice as scratch-resistant.
- In September 2023, PGT Innovations’ Diamond Glass products are currently available through select dealers, primarily in Florida, and are featured as the standard glass in its WinDoor product portfolio.
Report Coverage
The research report offers an in-depth analysis based on Glass Type, Manufacturing Process, End-User and Geography. It details leading market players, providing an overview of their business, product offerings, investments, revenue streams, and key applications. Additionally, the report includes insights into the competitive environment, SWOT analysis, current market trends, as well as the primary drivers and constraints. Furthermore, it discusses various factors that have driven market expansion in recent years. The report also explores market dynamics, regulatory scenarios, and technological advancements that are shaping the industry. It assesses the impact of external factors and global economic changes on market growth. Lastly, it provides strategic recommendations for new entrants and established companies to navigate the complexities of the market.
Future Outlook
- The market will expand steadily as consumer electronics brands increase adoption of durable, high-performance display materials.
- Automotive manufacturers will drive higher demand through wider integration of digital dashboards, infotainment clusters, and touch-enabled controls.
- Flexible and ultra-thin glass technologies will gain traction as foldable and wearable devices scale globally.
- Producers will invest more in advanced coatings that improve hardness, clarity, and resistance to smudges and abrasions.
- Laboratory, pharmaceutical, and specialty packaging applications will create additional growth opportunities for chemically stable glass.
- Sustainability goals will push manufacturers to adopt energy-efficient production methods and recyclable glass solutions.
- Supply chains will become more regionalized as companies seek resilience and proximity to major electronics hubs.
- R&D spending will rise to address technical challenges in producing ultra-thin yet durable scratch-resistant materials.
- Partnerships between material suppliers and OEMs will strengthen to accelerate product development cycles.
- Competition will intensify as global players focus on performance differentiation and customization for niche applications.


