| REPORT ATTRIBUTE |
DETAILS |
| Historical Period |
2020-2023 |
| Base Year |
2024 |
| Forecast Period |
2025-2032 |
| Silver Nanowires Market Size 2024 |
USD 451.6 million |
| Silver Nanowires Market, CAGR |
9.40% |
| Silver Nanowires Market Size 2032 |
USD 926.6 million |
Market Overview
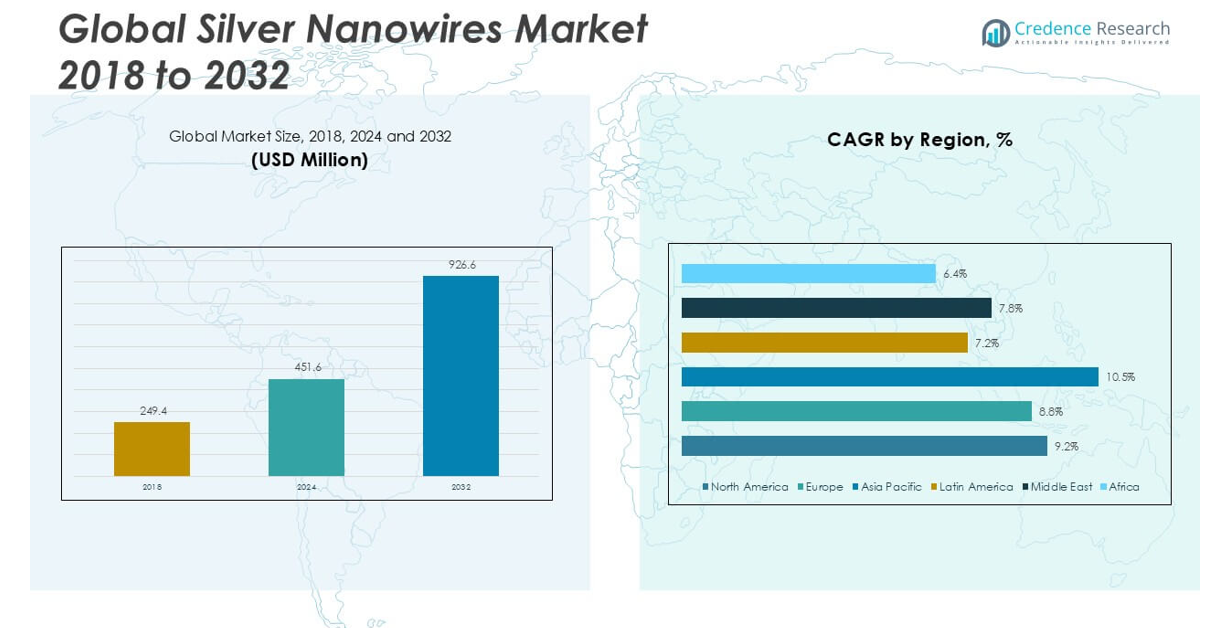
The Silver Nanowires market size was valued at USD 249.4 million in 2018, reached USD 451.6 million in 2024, and is anticipated to reach USD 926.6 million by 2032, at a CAGR of 9.40% during the forecast period.
The Silver Nanowires market is driven by key players such as Cambrios, C3Nano, Heraeus Holding, NanoTechLabs, Blue Nano, Seashell Technology, ACS Material, Nanoshel, Novarials Corporation, Applied Nanotech, Novacentrix, RAS AG, Suzhou Coldstones Technology, and TPK Holding. These companies focus on advancing fabrication technologies, improving product quality, and expanding their global reach to meet the rising demand from electronics and renewable energy sectors. Asia Pacific leads the global market, accounting for 35.6% of the total market share in 2018, supported by strong manufacturing bases in China, Japan, and South Korea. North America and Europe follow as significant contributors, driven by increasing adoption of flexible displays and solar technologies. The competitive landscape remains moderately consolidated, with leading firms prioritizing strategic partnerships, product innovation, and capacity expansion to strengthen their market position and capitalize on emerging opportunities in flexible electronics and transparent conductive applications.
Market Insights
- The Silver Nanowires market was valued at USD 249.4 million in 2018, reached USD 451.6 million in 2024, and is expected to hit USD 926.6 million by 2032, growing at a CAGR of 9.40%.
- Growing demand for flexible electronics, solar panels, and transparent conductive films is driving market growth, especially in Asia Pacific, which held the largest share of 35.6% in 2018.
- Replacement of indium tin oxide in transparent conductive films and advancements in large-scale manufacturing are key market trends boosting adoption across consumer electronics and solar energy sectors.
- Key players like Cambrios, C3Nano, and Heraeus Holding are focusing on product innovation and strategic partnerships, while high production costs and durability concerns restrain market expansion.
- Transparent conductive film holds the largest application share, while North America and Europe also contribute significantly, supported by growing investments in solar technology and smart electronic devices.
Access crucial information at unmatched prices!
Request your sample report today & start making informed decisions powered by Credence Research Inc.!
Download Sample
Market Segmentation Analysis:
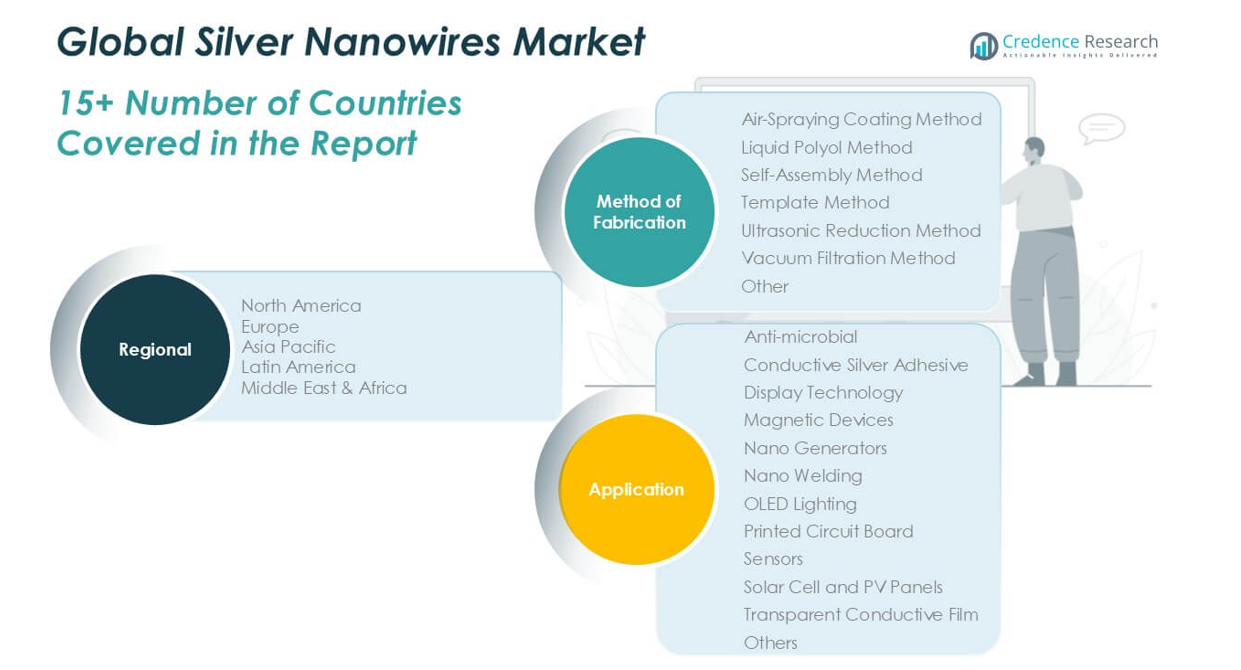
By Method of Fabrication:
In the Silver Nanowires market, the Liquid Polyol Method holds the largest market share among fabrication methods. This method is widely preferred due to its ability to produce high-quality nanowires with uniform diameter and excellent electrical conductivity. The Liquid Polyol Method’s scalability and cost-effectiveness have driven its adoption across industries such as electronics and photovoltaics. Other fabrication methods like the Air-Spraying Coating Method, Self-Assembly Method, and Ultrasonic Reduction Method are gaining attention for niche applications, but they trail the Liquid Polyol Method in terms of commercial viability and large-scale production capabilities.
- For instance, Cambrios’ polyol synthesis yields nanowires with an average diameter of 26–32 nm and lengths of approximately 15 µm, with a low standard deviation of ±5 nm.
By Application:
Among applications, Transparent Conductive Film dominates the Silver Nanowires market, accounting for the largest revenue share. This dominance is fueled by the increasing demand for flexible, lightweight, and highly conductive films in display technologies, touchscreens, and solar panels. Silver Nanowires offer a competitive alternative to traditional indium tin oxide (ITO) due to their superior flexibility and lower cost. Other key applications such as Anti-microbial coatings, Conductive Silver Adhesives, OLED Lighting, and Solar Cell and PV Panels contribute to market growth, but Transparent Conductive Film remains the primary driver due to its expanding use in consumer electronics.
- For instance, C3Nano’s ActiveGrid Gen7 ink provides sheet resistance as low as 30 Ω/sq at over 85% optical transparency, and withstands over 1 million bend cycles, making it suitable for flexible touchscreen and OLED displays.
Market Overview
Rising Demand for Flexible Electronics
The growing adoption of flexible and wearable electronic devices significantly drives the demand for silver nanowires. Their excellent flexibility, high conductivity, and optical transparency make them ideal for next-generation displays, touchscreens, and smart textiles. As consumer preferences shift toward foldable smartphones, bendable displays, and lightweight wearable devices, manufacturers increasingly rely on silver nanowires as a superior alternative to traditional materials like indium tin oxide (ITO). This rising demand is expected to consistently support market expansion over the coming years.
- For instance, C3Nano reported that its ActiveGrid films have been used across hundreds of millions of smartphones and tablets, highlighting their widespread deployment in mainstream consumer electronics.
Expansion of Solar Energy and Photovoltaic Applications
Silver nanowires are gaining prominence in the solar energy sector due to their ability to enhance the efficiency and flexibility of photovoltaic panels. Their superior conductivity and transparent properties support the development of lightweight, flexible solar cells, which are in high demand across residential, commercial, and portable energy applications. As global investments in renewable energy projects accelerate and governments emphasize clean energy targets, the use of silver nanowires in solar technologies is expected to experience substantial growth, fueling market development.
- For instance, hybrid electrodes made with 6 wt% SWCNT and AgNWs achieved a sheet resistance of 28.9 Ω/sq at 80% transparency a level suitable for solar cell applications even when processed at low temperatures (60 °C).
Increasing Focus on Antimicrobial Applications
The inherent antimicrobial properties of silver have led to growing research and application of silver nanowires in medical devices, coatings, and healthcare products. With heightened awareness of infection control, particularly following the COVID-19 pandemic, industries are increasingly integrating silver nanowire-based antimicrobial coatings in consumer goods, medical equipment, and packaging. This trend is propelling demand from healthcare and consumer safety sectors, offering significant growth potential for manufacturers focused on expanding their antimicrobial product lines.
Key Trends & Opportunities
Replacement of Indium Tin Oxide in Transparent Conductive Films
A key trend in the silver nanowires market is their increasing adoption as a substitute for ITO in transparent conductive films. ITO’s brittleness and rising costs have driven industries to explore alternatives, and silver nanowires offer a highly flexible, cost-effective, and efficient solution. This shift presents long-term growth opportunities, particularly in the production of touchscreens, OLEDs, and smart windows where flexibility and durability are critical.
- For instance, C3Nano’s fused-nanowire sheets maintain transparency above 90% while achieving sheet resistance below 100 Ω/sq, meeting key specs for display and touch applications.
Advancements in Large-Scale Manufacturing Techniques
Technological advancements in fabrication methods, particularly the Liquid Polyol and Air-Spraying Coating methods, are enhancing the commercial viability of silver nanowires. Improved scalability, process stability, and reduced production costs are enabling manufacturers to meet growing industrial demands efficiently. These advancements are opening new opportunities for mass-market adoption in consumer electronics, energy, and healthcare sectors, where consistent quality and affordability are essential for wider market penetration.
- For instance, Cambrios’ polyol method (patented in 2018) routinely produces nanowires with mean lengths of 10–22 µm, diameters of 26–32 nm, and a tight diameter distribution (SD ~5 nm), enabling reliable coating uniformity.
Key Challenges
High Production Costs and Complexity
Despite their advantages, silver nanowires face challenges related to high production costs and the complexity of maintaining uniformity at scale. Achieving consistent wire diameter and preventing agglomeration require sophisticated equipment and stringent process controls, which can limit profit margins and restrict adoption by cost-sensitive industries. Reducing these manufacturing challenges remains a significant barrier to achieving broader commercialization.
Stability and Durability Concerns
Silver nanowires are susceptible to issues like oxidation and degradation over time, which can compromise the performance and longevity of products using them. These stability concerns are particularly critical in outdoor or high-humidity applications such as solar panels and flexible electronics. Improving the long-term reliability of silver nanowires through surface treatments or protective coatings is essential to overcoming this challenge and ensuring sustained market growth.
Regulatory and Environmental Issues
The use of silver nanomaterials raises regulatory and environmental concerns, particularly regarding their potential toxicity and disposal impact. Increased scrutiny from environmental agencies and the need to comply with stringent material safety guidelines may pose regulatory hurdles for manufacturers. Addressing these concerns through eco-friendly production processes and thorough toxicity assessments is crucial to prevent potential market restrictions and public resistance.
Regional Analysis
North America
In 2018, North America accounted for approximately 28.5% of the global silver nanowires market, valued at USD 71.1 million. By 2024, the market size grew to USD 117.4 million and is projected to reach USD 211.3 million by 2032, expanding at a CAGR of 9.2%. The region’s growth is supported by the strong presence of leading electronics manufacturers and increasing adoption of flexible displays and solar technologies. Continuous research and innovation in nanotechnology, coupled with rising demand for advanced display solutions, further contribute to North America’s substantial market share and consistent growth trajectory.
Europe
Europe held nearly 26.4% of the global silver nanowires market in 2018, with a market size of USD 66.1 million. The market expanded to USD 110.6 million in 2024 and is expected to reach USD 202.9 million by 2032, growing at a CAGR of 8.8%. Demand in Europe is primarily driven by the region’s focus on renewable energy adoption, particularly in solar applications, and the rising integration of silver nanowires in automotive displays and electronic devices. Supportive regulations and technological advancements across the region help maintain Europe’s solid market position.
Asia Pacific
Asia Pacific dominated the global silver nanowires market with the largest share of 35.6% in 2018, valued at USD 88.8 million. The market surged to USD 171.6 million by 2024 and is projected to reach USD 390.1 million by 2032, registering the highest CAGR of 10.5%. Rapid industrialization, expanding consumer electronics manufacturing, and significant investments in renewable energy projects are key growth drivers in this region. Countries like China, Japan, and South Korea are leading the market growth with increasing adoption of advanced display technologies and flexible electronics, solidifying Asia Pacific’s leading position globally.
Latin America
Latin America represented a smaller yet growing share of the silver nanowires market, holding around 2.5% in 2018 with a market value of USD 6.2 million. By 2024, the market reached USD 14.5 million and is forecasted to attain USD 36.1 million by 2032, expanding at a CAGR of 7.2%. Growth in this region is supported by rising awareness of renewable energy solutions and gradual adoption of smart electronic devices. Although the market share remains limited, increasing investments in infrastructure and technology sectors are expected to offer incremental opportunities in the coming years.
Middle East
The Middle East accounted for about 5.0% of the global silver nanowires market in 2018, with a value of USD 12.5 million. By 2024, the market grew to USD 25.3 million and is projected to reach USD 58.4 million by 2032, progressing at a CAGR of 7.8%. The region’s growth is driven by investments in solar energy projects and increasing demand for advanced materials in electronics and smart technologies. Although the market size is moderate, the Middle East continues to show steady growth supported by government initiatives toward renewable energy and smart infrastructure development.
Africa
Africa contributed approximately 1.9% to the global silver nanowires market in 2018, valued at USD 4.7 million. By 2024, the market expanded to USD 12.2 million and is expected to reach USD 27.8 million by 2032, growing at a CAGR of 6.4%. The market in Africa is in the early growth stage, with opportunities emerging from solar energy adoption and the gradual introduction of modern electronics. While Africa’s current market share remains small, supportive government policies and international investments in renewable energy projects could positively influence market growth in the coming years.
Market Segmentations:
By Method of Fabrication
- Air-Spraying Coating Method
- Liquid Polyol Method
- Self-Assembly Method
- Template Method
- Ultrasonic Reduction Method
- Vacuum Filtration Method
- Others
By Application
- Anti-microbial
- Conductive Silver Adhesive
- Display Technology
- Magnetic Devices
- Nano Generators
- Nano Welding
- OLED Lighting
- Printed Circuit Board
- Sensors
- Solar Cell and PV Panels
- Transparent Conductive Film
- Others
By Geography:
- North America
- Europe
- Germany
- France
- U.K.
- Italy
- Spain
- Rest of Europe
- Asia Pacific
- China
- Japan
- India
- South Korea
- South-east Asia
- Rest of Asia Pacific
- Latin America
- Brazil
- Argentina
- Rest of Latin America
- Middle East & Africa
- GCC Countries
- South Africa
- Rest of the Middle East and Africa
Competitive Landscape
The Silver Nanowires market is characterized by a moderately consolidated competitive landscape, with key players focusing on technological innovation, strategic partnerships, and capacity expansion to strengthen their market position. Companies such as Cambrios, C3Nano, Heraeus Holding, and NanoTechLabs lead the market by offering high-quality, scalable solutions that cater to the growing demand in consumer electronics, solar energy, and healthcare sectors. Market participants are increasingly investing in research and development to improve fabrication methods, enhance product durability, and reduce production costs, aiming to capture a larger share in the flexible electronics and transparent conductive film segments. Strategic collaborations with display manufacturers and renewable energy companies are becoming common, as firms seek to secure long-term growth opportunities. Additionally, some players are exploring eco-friendly production techniques to meet evolving regulatory standards and address environmental concerns, further shaping competition within the industry. The market continues to attract new entrants, intensifying innovation and pricing dynamics.
Shape Your Report to Specific Countries or Regions & Enjoy 30% Off!
Key Player Analysis
- Cambrios
- C3Nano
- Heraeus Holding
- NanoTechLabs
- Blue Nano
- Seashell Technology
- ACS Material
- Nanoshel
- Novarials Corporation
- Applied Nanotech
- Novacentrix
- RAS AG
- Suzhou Coldstones Technology
- TPK Holding
Recent Developments
- In 2025, NanoTechLabs continues to supply specialized and made-to-order nanomaterials, including silver nanowires, but no specific recent breakthroughs or partnerships in 2024–2025 are detailed in the available sources.
- In August 2024, DuPont acquired C3Nano’s nanowire technology and business assets, expanding DuPont’s offerings in transparent and flexible films and inks.
- In October 2023, Cambrios announced a partnership with a major Asian display manufacturer to supply silver nanowire films, supporting the growing market for flexible and transparent electronics.
- In October 2022, C3Nano announced scaling up its Ultra-Nanowires™ product line, featuring core-shell nanowire technologies with noble metal coatings for enhanced robustness and suitability for advanced composites, conductive coatings, and harsh environments.
Market Concentration & Characteristics
The Silver Nanowires Market demonstrates a moderately concentrated structure with a limited number of key players holding significant market shares. It is defined by high entry barriers due to complex fabrication processes, the need for advanced technology, and substantial investment requirements. The market is highly competitive, with companies focusing on innovation, product quality, and long-term partnerships to strengthen their positions. It benefits from strong demand across flexible electronics, solar panels, and transparent conductive films, driving continuous research and development efforts. Regional concentration is evident, with Asia Pacific leading in both production and consumption due to its established electronics manufacturing base. North America and Europe maintain steady demand supported by technological advancements and growing renewable energy adoption. The Silver Nanowires Market is characterized by a fast-paced shift toward cost-effective, scalable production methods and a steady replacement of traditional materials such as indium tin oxide. Players are working to address performance stability, durability issues, and environmental considerations to ensure sustained growth and regulatory compliance.
Report Coverage
The research report offers an in-depth analysis based on Method of Fabrication, Application and Geography. It details leading market players, providing an overview of their business, product offerings, investments, revenue streams, and key applications. Additionally, the report includes insights into the competitive environment, SWOT analysis, current market trends, as well as the primary drivers and constraints. Furthermore, it discusses various factors that have driven market expansion in recent years. The report also explores market dynamics, regulatory scenarios, and technological advancements that are shaping the industry. It assesses the impact of external factors and global economic changes on market growth. Lastly, it provides strategic recommendations for new entrants and established companies to navigate the complexities of the market.
Future Outlook
- The demand for silver nanowires will continue to grow with the increasing adoption of flexible and foldable electronic devices.
- Silver nanowires are expected to replace indium tin oxide in transparent conductive films across various applications.
- The market will benefit from advancements in large-scale, cost-effective fabrication techniques improving production efficiency.
- Growing investments in renewable energy will drive the use of silver nanowires in solar cells and photovoltaic panels.
- The integration of silver nanowires in smart textiles and wearable devices will offer new growth opportunities.
- Antimicrobial applications of silver nanowires will expand in the healthcare and consumer goods sectors.
- Asia Pacific will remain the largest and fastest-growing regional market driven by strong manufacturing capabilities.
- North America and Europe will continue to show stable demand supported by technology adoption and innovation.
- Ongoing research to improve the durability and oxidation resistance of silver nanowires will strengthen their market potential.
- The market will experience increasing competition as new players enter with advanced materials and scalable production methods.


