
Market Overview
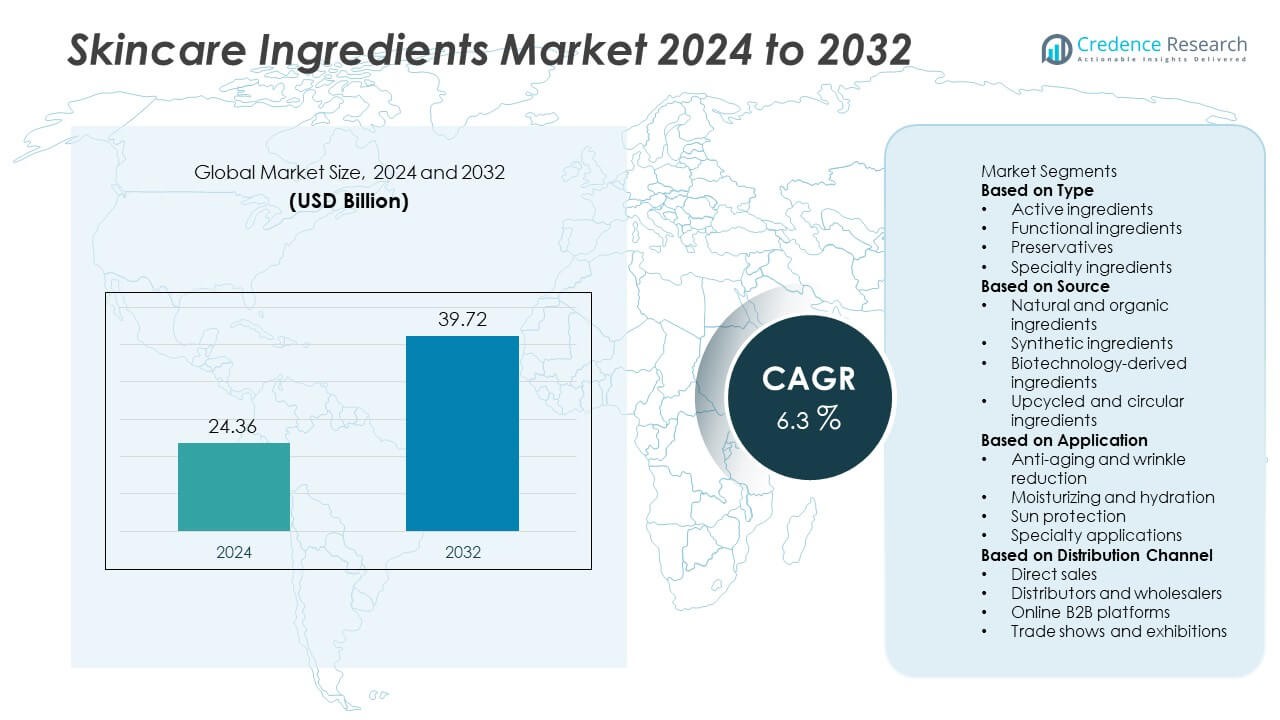
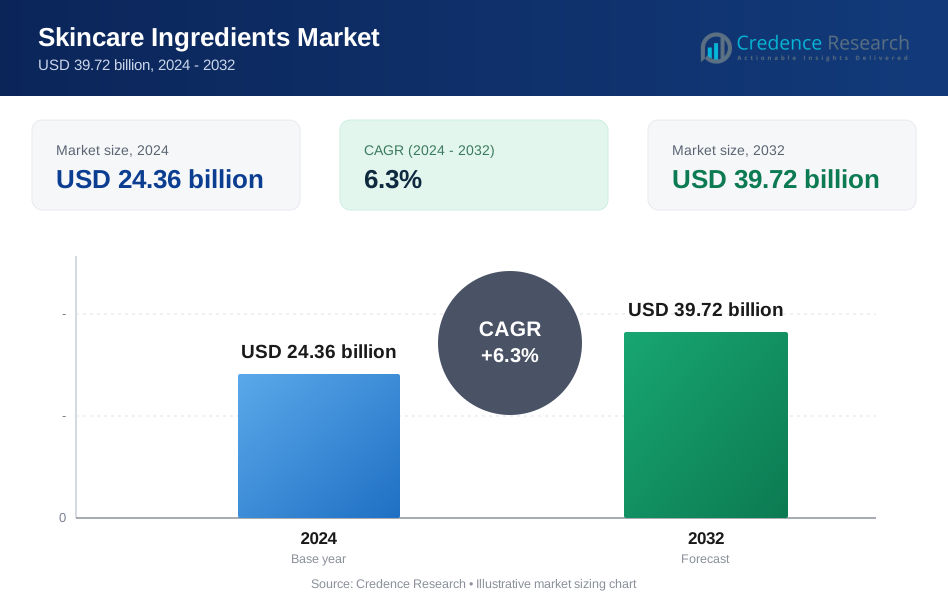
The Skincare Ingredients Market was valued at USD 24.36 billion in 2024 and is projected to reach USD 39.72 billion by 2032, growing at a CAGR of 6.3% during the forecast period.
| REPORT ATTRIBUTE | DETAILS |
|---|---|
| Historical Period | 2020-2023 |
| Base Year | 2024 |
| Forecast Period | 2025-2032 |
| Skincare Ingredients Market Size 2024 | USD 24.36 Billion |
| Skincare Ingredients Market, CAGR | 6.3% |
| Skincare Ingredients Market Size 2032 | USD 39.72 Billion |
The skincare ingredients market is led by major companies such as BASF SE, Croda International Plc, Evonik Industries AG, Ashland Global Holdings Inc., Clariant AG, Symrise AG, Givaudan S.A., Lonza Group AG, The Dow Chemical Company, and Solvay S.A. These firms dominate through advanced R&D capabilities, sustainable ingredient portfolios, and strong global supply networks. Product innovation in natural actives, bio-fermented compounds, and multifunctional formulations continues to enhance competitiveness. North America emerged as the leading region with a 36.8% market share in 2024, supported by strong consumer demand for premium skincare and rapid adoption of clean beauty products driven by technological and regulatory advancements.
Market Insights
- The skincare ingredients market was valued at USD 24.36 billion in 2024 and is projected to reach USD 39.72 billion by 2032, registering a CAGR of 6.3% during the forecast period.
- Growing consumer preference for natural, organic, and clean-label products is a major market driver, fueling demand for plant-derived actives and sustainable formulations.
- The market trend is shifting toward biotechnology-derived and multifunctional ingredients, with increasing use of probiotics, peptides, and upcycled compounds in high-performance skincare.
- Leading players such as BASF SE, Croda International Plc, and Evonik Industries AG focus on R&D, partnerships, and eco-friendly innovation to strengthen global competitiveness.
- North America held a 36.8% share in 2024, followed by Europe with 30.4%, while Asia-Pacific emerged as the fastest-growing region; the active ingredients segment dominated with a 42.8% share, driven by high demand for targeted anti-aging and hydration products.
Market Segmentation Analysis:
By Type
The active ingredients segment dominated the skincare ingredients market with a 42.8% share in 2024. This segment leads due to rising demand for bioactive compounds such as peptides, retinoids, and hyaluronic acid that deliver visible skin benefits. Growing consumer preference for targeted solutions like anti-aging and skin-brightening formulations supports segment growth. Functional ingredients such as emulsifiers and surfactants continue to play a vital supporting role in formulation stability, while specialty ingredients are gaining traction in premium and personalized skincare ranges.
- For instance, Croda International Plc expanded its peptide portfolio with the Matrixyl® 3000 Plus range, featuring dual-matrix peptides that stimulate collagen synthesis by up to 3.3-fold in vitro. The formulation demonstrates measurable wrinkle reduction within 8 weeks of application and has been adopted by over 120 global skincare brands, underscoring the rising use of scientifically validated actives.
By Source
The natural and organic ingredients segment held the largest share of 46.5% in 2024, driven by strong consumer demand for clean-label and eco-friendly skincare products. Increasing awareness of sustainable sourcing and reduced chemical exposure promotes the adoption of plant-derived extracts, oils, and minerals. Biotechnology-derived ingredients, including lab-grown collagen and probiotics, are gaining popularity for their consistency and ethical benefits. Additionally, upcycled and circular ingredients from food and agricultural waste are emerging as sustainable alternatives aligning with zero-waste and circular economy initiatives.
- For instance, BASF SE offers a range of bioactive cosmetic ingredients from the rambutan tree, sourced from an Ecocert-certified, sustainable program in Vietnam. This initiative minimizes waste by utilizing the fruit's peel, seeds, and leaves. From these upcycled materials, BASF produces Nephoria™ leaf extract for improving skin elasticity and reducing wrinkles, Nephydrat™ peel extract for boosting skin hydration, and Rambuvital™ seed extract for protecting the scalp and hair from pollution.
By Application
The anti-aging and wrinkle reduction segment accounted for the highest share of 39.2% in 2024, supported by growing aging populations and rising consumer expenditure on youth-preserving formulations. Demand for retinol, niacinamide, and antioxidant-rich actives continues to rise in serums and creams. Moisturizing and hydration applications also remain significant due to climate change impacts and increased awareness of skin barrier health. Sun protection ingredients gain traction with expanding daily-use SPF products, while specialty applications such as acne care and brightening treatments further diversify growth opportunities across global markets.
Key Growth Drivers
Rising Demand for Natural and Clean Label Products
Consumers are increasingly favoring skincare products made with natural, organic, and non-toxic ingredients. This shift toward clean beauty drives manufacturers to replace synthetic compounds with plant-based actives and eco-friendly alternatives. Regulatory encouragement for sustainable sourcing and transparency also supports this transition. Brands such as L’Oréal and Unilever are expanding their natural ingredient portfolios, promoting green chemistry and biodegradable formulations to meet consumer expectations for ethical, safe, and environmentally responsible skincare solutions.
- For instance, Symrise AG developed SymEffect™ Sun, a 100% natural multifunctional emollient derived from coconut and castor oils that provides SPF enhancement while maintaining a biodegradation rate above 80% within 28 days. The ingredient is produced through enzymatic esterification, cutting solvent use by 95% and meeting COSMOS and NATRUE certification standards for natural cosmetics.
Technological Advancements in Ingredient Innovation
The integration of biotechnology, nanotechnology, and encapsulation methods is revolutionizing skincare formulations. These advancements improve ingredient stability, absorption, and targeted delivery, enhancing product efficacy. For example, bio-fermented actives and peptides provide precise anti-aging and hydration benefits. R&D investment by leading firms is enabling the creation of lab-grown and microbiome-friendly ingredients. Such innovations are reshaping formulation science and helping brands offer differentiated, high-performance skincare products that meet evolving consumer needs for personalization and proven results.
- For instance, Givaudan S.A. developed and patented Spherulite™ technology, a microencapsulation system capable of delivering active ingredients like Retinol to the deeper layers of the epidermis for anti-aging effects.
Growing Awareness of Preventive Skincare
Preventive skincare adoption is accelerating as consumers prioritize long-term skin health. Increasing awareness of environmental stressors, UV exposure, and early aging signs fuels demand for protective actives like antioxidants, SPF agents, and barrier-repair ingredients. Younger consumers are investing in multi-step skincare routines focused on maintenance rather than correction. This behavior shift is encouraging global brands to expand anti-pollution, blue-light protection, and daily hydration product lines to cater to health-conscious consumers seeking science-backed preventive solutions.
Key Trends & Opportunities
Biotechnology-Derived and Upcycled Ingredients
The use of biotechnology-derived ingredients is growing as brands seek sustainable and scalable solutions. Lab-cultured collagen, probiotics, and enzymes ensure consistent quality while reducing environmental impact. Upcycled ingredients sourced from food and agricultural waste, such as fruit peels or coffee grounds, support circular economy principles. These innovations not only enhance sustainability credentials but also create new commercial opportunities, allowing brands to appeal to eco-aware consumers and strengthen ESG-driven product portfolios.
- For instance, Evonik Industries AG produces its biotechnologically derived rhamnolipid surfactant platform on an industrial scale through precision fermentation at a facility in Slovakia. This process uses renewable sugar as a feedstock, avoiding the need for petrochemical or tropical oil-based materials.
Personalized and Functional Skincare Growth
Personalized skincare continues to expand as consumers demand tailored formulations that address individual skin concerns. AI-based diagnostics and microbiome analysis allow precise ingredient matching for moisture, sensitivity, and tone correction. Functional skincare with multi-benefit actives—combining hydration, protection, and repair—is gaining traction in premium segments. This trend fosters innovation among manufacturers, enabling the creation of data-driven, customized products that enhance consumer satisfaction and long-term brand loyalty.
- For instance, L'Oréal Group developed its Perso smart system, capable of creating personalized formulas for skincare, foundation, and lipstick. Based on a user's skin assessment via a mobile app, environmental factors, and personal preferences, the device would dispense a perfectly portioned, single dose of freshly mixed product.
Key Challenges
High Cost of Advanced Ingredients
Developing and sourcing advanced bioactive or biotechnological ingredients involve high R&D and production costs. Complex extraction processes, purity requirements, and limited raw material availability elevate overall manufacturing expenses. These factors restrict adoption among small and mid-size brands and impact affordability in emerging markets. Balancing performance, safety, and cost efficiency remains a key challenge for producers aiming to maintain competitiveness while meeting consumer demand for high-quality, innovative skincare ingredients.
Regulatory Compliance and Ingredient Transparency
Stringent global regulations on cosmetic ingredient safety and labeling create compliance complexities. Manufacturers must meet varying standards across regions, including EU REACH, FDA, and ISO guidelines. Ensuring transparency in ingredient sourcing, allergen disclosure, and environmental impact is essential but resource-intensive. Mislabeling risks or regulatory non-compliance can damage brand credibility. Companies must invest in quality assurance and certification systems to build consumer trust while navigating the evolving legal frameworks in the skincare ingredient industry.
Regional Analysis
North America
North America dominated the skincare ingredients market with a 36.8% share in 2024, driven by high consumer spending on premium skincare and rapid adoption of clean beauty products. The U.S. leads the region due to strong innovation in bioactive formulations and robust R&D in biotechnology-derived ingredients. Major cosmetic manufacturers are investing in sustainable and vegan formulations to meet shifting consumer preferences. Expanding e-commerce distribution channels and influencer-led product marketing further enhance demand for advanced skincare ingredients across major U.S. and Canadian brands.
Europe
Europe held a 30.4% market share in 2024, supported by strict regulatory standards that promote sustainable and high-quality ingredient sourcing. Demand for natural, organic, and cruelty-free products is growing rapidly across Germany, France, and the U.K. European manufacturers are pioneers in green chemistry and circular formulations, emphasizing transparency and traceability in skincare production. The region’s strong emphasis on environmental responsibility and innovation in active ingredients positions it as a global leader in ethical skincare development.
Asia-Pacific
Asia-Pacific accounted for a 25.7% share in 2024, emerging as the fastest-growing region due to expanding middle-class populations and rising skincare awareness. Countries such as South Korea, Japan, and China drive innovation through K-beauty and J-beauty trends, emphasizing multifunctional and natural actives. Increasing demand for anti-aging, brightening, and hydrating products supports ingredient diversification. Local manufacturers are integrating biotechnology and fermentation processes to enhance formulation performance and meet the growing demand for effective, customized skincare solutions.
Latin America
Latin America captured a 4.2% market share in 2024, fueled by growing awareness of personal care and wellness trends. Brazil and Mexico are the leading contributors, with increasing use of botanical and plant-based ingredients. Rising disposable incomes and expansion of multinational cosmetic brands in urban markets drive product accessibility. Consumers are shifting toward natural and dermatologically tested formulations, while local producers are investing in sustainable raw material sourcing to align with global clean beauty trends.
Middle East & Africa
The Middle East & Africa region accounted for a 2.9% share in 2024, supported by growing demand for luxury and halal-certified skincare products. Urbanization, rising beauty consciousness, and climatic factors such as dry weather increase the need for moisturizing and sun protection ingredients. The UAE and Saudi Arabia lead in premium skincare adoption, while South Africa shows growing interest in natural and affordable formulations. Global and regional brands are expanding distribution networks to capture untapped demand across this emerging market.
Market Segmentations:
By Type
- Active ingredients
- Functional ingredients
- Preservatives
- Specialty ingredients
By Source
- Natural and organic ingredients
- Synthetic ingredients
- Biotechnology-derived ingredients
- Upcycled and circular ingredients
By Application
- Anti-aging and wrinkle reduction
- Moisturizing and hydration
- Sun protection
- Specialty applications
By Distribution Channel
- Direct sales
- Distributors and wholesalers
- Online B2B platforms
- Trade shows and exhibitions
By Geography
- North America
- U.S.
- Canada
- Mexico
- Europe
- Germany
- France
- U.K.
- Italy
- Spain
- Rest of Europe
- Asia Pacific
- China
- Japan
- India
- South Korea
- South-east Asia
- Rest of Asia Pacific
- Latin America
- Brazil
- Argentina
- Rest of Latin America
- Middle East & Africa
- GCC Countries
- South Africa
- Rest of the Middle East and Africa
Competitive Landscape
The skincare ingredients market is highly competitive, featuring major players such as BASF SE, Croda International Plc, Evonik Industries AG, Ashland Global Holdings Inc., Clariant AG, Symrise AG, Givaudan S.A., Lonza Group AG, The Dow Chemical Company, and Solvay S.A. These companies focus on innovation, sustainable sourcing, and technological advancements to strengthen their market presence. Strategic partnerships, acquisitions, and expansion of bio-based ingredient portfolios remain key competitive strategies. Firms are investing heavily in biotechnology and green chemistry to create eco-friendly, multifunctional actives with superior efficacy. The shift toward natural and vegan formulations has prompted companies to enhance traceability and transparency in ingredient sourcing. R&D initiatives targeting microbiome care, anti-aging actives, and upcycled ingredients are gaining momentum, reflecting growing consumer demand for science-backed and sustainable skincare products. Global manufacturers continue to expand production capacities and regional distribution networks to meet increasing demand across Asia-Pacific and North America.
Key Player Analysis
- BASF SE
- Croda International Plc
- Evonik Industries AG
- Ashland Global Holdings Inc.
- Clariant AG
- Symrise AG
- Givaudan S.A.
- Lonza Group AG
- The Dow Chemical Company
- Solvay S.A.
Recent Developments
- In April 2025, BASF SE launched three natural-based ingredients-Verdessence® Maize, Lamesoft® OP Plus and Dehyton® PK45 GA/RA-designed for sustainable personal care formulations. These innovations include a plant-based styling polymer and a wax-based opacifier that delivered improved curl retention and easier wet combing in formulation trials.
- In April 2025, Evonik Industries AG showcased its latest biosolution portfolio at in-cosmetics Global, including TEGOSOFT® BC MB, RHEANCE® D50, and vegan collagen Vecollage® Fortify GP-each engineered via enzymatic or fermentation processes.
- In April 2025, Ashland Global Holdings Inc. unveiled Collapeptyl™, a hyalupeptide hybrid designed via molecular modelling to support 20 types of skin collagen, delivering visible modelling of skin elasticity within 30 minutes.
- In April 2024, BASF also introduced its digital service “Ingredients Revealed” on the D’lite platform, offering access to over 4,500 cosmetic formulations and real-time sustainability criteria filtering for ingredient selection.
Report Coverage
The research report offers an in-depth analysis based on Type, Source, Application, Distribution Channel and Geography. It details leading market players, providing an overview of their business, product offerings, investments, revenue streams, and key applications. Additionally, the report includes insights into the competitive environment, SWOT analysis, current market trends, as well as the primary drivers and constraints. Furthermore, it discusses various factors that have driven market expansion in recent years. The report also explores market dynamics, regulatory scenarios, and technological advancements that are shaping the industry. It assesses the impact of external factors and global economic changes on market growth. Lastly, it provides strategic recommendations for new entrants and established companies to navigate the complexities of the market.
Future Outlook
- Demand for natural and bio-based skincare ingredients will continue to expand globally.
- Biotechnology and fermentation processes will drive innovation in active ingredient production.
- Microbiome-focused skincare will gain traction, encouraging the use of probiotic and prebiotic actives.
- Brands will prioritize transparency and traceability in ingredient sourcing and formulation labeling.
- Upcycled and circular ingredients will become a mainstream sustainability focus for manufacturers.
- Advanced encapsulation and nanotechnology will enhance ingredient stability and skin absorption.
- Personalization will influence product development, integrating AI-based skin diagnostics and tailored formulations.
- Regulatory pressure will increase on synthetic preservatives and chemical-based additives.
- Partnerships between cosmetic brands and biotech firms will accelerate product innovation.
- Asia-Pacific will emerge as the fastest-growing hub for natural and multifunctional skincare formulations.
Request a Free Sample
Fill in your details and we'll send you a free sample report.
- Sample data tables & charts
- Research methodology
Need a Custom Version of This Report?
Tailor the scope, geography, or segments to your exact requirements.
- Custom geography or segment scope
- Direct access to our analyst team
Frequently Asked Questions
What is the current market size for the Skincare Ingredients Market, and what is its projected size in 2032?
At what Compound Annual Growth Rate is the Skincare Ingredients Market projected to grow between 2025 and 2032?
Which Skincare Ingredients Market segment held the largest share in 2024?
What are the primary factors fueling the growth of the Skincare Ingredients Market?
Who are the leading companies in the Skincare Ingredients Market?
Which region commanded the largest share of the Skincare Ingredients Market in 2024?
Table of Content
Chapter 1. Report Introduction
- 1.1 Report Description & Purpose
- 1.1.1 Report Title & Market Definition
- 1.1.2 Unique Selling Propositions (USP) & Key Differentiators
- 1.1.3 Value Proposition for Stakeholders
- 1.2 Research Objectives
- 1.2.1 Market Sizing Objectives (Volume & Revenue)
- 1.2.2 Segmentation Objectives
- 1.2.3 Competitive Intelligence Objectives
- 1.2.4 Forecast & Scenario Objectives
- 1.3 Report Scope
- 1.3.1 Skincare Ingredients Scope – Types & Subtypes Covered
- 1.3.2 Geographic Scope – Regions & Countries Covered
- 1.3.3 Historical Period, Base Year & Forecast Period (2024; forecast to 2032)
- 1.3.4 Inclusions & Exclusions
- 1.4 HS Code & Classification Framework
- 1.5 Currency, Units & Pricing Basis
- 1.6 Target Stakeholders
- 1.7 Limitations & Assumptions
Chapter 2. Executive Summary
- 2.1 Global Skincare Ingredients Market Snapshot
- 2.1.1 Market Size – Historical (2024) & Forecast (2024-2032) (2024: USD 24.36 billion → 2032: USD 39.72 billion)
- 2.1.2 Volume & Revenue – Global Totals
- 2.1.3 Key Market Highlights – Top Five Facts
- 2.2 Skincare Ingredients Market Segmentation Snapshot
- 2.2.1 Market Split by Region – 2024 vs. 2032
- 2.3 Competitive Snapshot
- 2.3.1 Top 10 Players by Revenue Share – 2024
- 2.3.2 Top 10 Players by Volume Share – 2024
- 2.3.3 Recent Strategic Developments (18-Month Summary)
- 2.4 Key Investment Highlights & Strategic Conclusions
Chapter 3. Skincare Ingredients Market Dynamics & Industry Analysis
- 3.1 Market Overview & Context
- 3.1.1 Skincare Ingredients Market Position in the Broader Automotive Value Chain
- 3.1.2 OEM vs. Replacement Market Dynamics
- 3.1.3 Market Maturity & Development Stage by Region
- 3.2 Skincare Ingredients Market Drivers
- 3.3 Skincare Ingredients Market Restraints & Challenges
- 3.4 Skincare Ingredients Market Opportunities
- 3.5 Porter's Five Forces Analysis
- 3.5.1 Threat of New Entrants
- 3.5.2 Bargaining Power of Suppliers
- 3.5.3 Bargaining Power of Buyers
- 3.5.4 Threat of Substitutes
- 3.5.5 Competitive Rivalry – Intensity Assessment
- 3.6 Skincare Ingredients Value Chain Analysis
- 3.6.1 Upstream – Raw Material/Input Suppliers
- 3.6.1.1 Raw Material/Input 1
- 3.6.1.2 Raw Material/Input 2
- 3.6.1.3 Raw Material/Input 3
- 3.6.2 Midstream – Production/Manufacturing/Service Delivery
- 3.6.2.1 Production/Process Overview
- 3.6.2.2 Key Facility Locations & Capacity by Manufacturer
- 3.6.3 Downstream – Distribution & End Consumer
- 3.6.3.1 Primary Channel – B2B/OEM
- 3.6.3.2 Secondary Channels – Dealer, Retail, Online, Direct
- 3.6.4 Value Chain Profitability Analysis
- 3.6.1 Upstream – Raw Material/Input Suppliers
- 3.7 PESTEL Analysis
- 3.7.1 Political Factors
- 3.7.2 Economic Factors
- 3.7.3 Social Factors
- 3.7.4 Technological Factors
- 3.7.5 Environmental Factors
- 3.7.6 Legal Factors
- 3.8 Skincare Ingredients Supply Chain Analysis
- 3.8.1 Raw Material/Input Supply Risk Assessment
- 3.8.2 Manufacturing Concentration Risk (Geographic Exposure)
- 3.8.3 Trade Disruption Impact Analysis
- 3.9 Regulatory & Policy Landscape
Note: The regulatory and policy landscape section covers regulations based on their applicability to the market, Skincare Ingredients category, geography, and scope of the study. Only regulatory frameworks with a material impact on operations, compliance, trade, sustainability, or market access are analyzed in detail.
Chapter 4. Key Investment Pockets & Opportunity Analysis
- 4.1 Skincare Ingredients Market Attractiveness Analysis
- 4.1.1 By Region – Investment Attractiveness Matrix (Volume × CAGR)
- 4.2 Absolute Revenue Growth Opportunity
- 4.2.1 By Region – Absolute USD Growth Through 2032
- 4.3 Incremental Volume Opportunity
- 4.3.1 By Region – Incremental Volume Through 2032
- 4.3.2 Segment – Incremental Volume
- 4.4 Emerging Submarket Opportunity Deep Dive (Subject to Applicability)
- 4.5 Emerging Market Opportunity Scorecards
- 4.5.1 United States
- 4.5.2 Europe
- 4.5.3 Asia
- 4.5.4 Middle East & Africa
Note: Emerging Market Opportunity Scorecards will be included based on relevance and strategic importance. Regions listed are indicative and may vary depending on data availability and market dynamics.
Chapter 5. Skincare Ingredients Import-Export Analysis & Trade Flows
- 5.1 Global Trade Overview
- 5.1.1 Global Export Value by Country (2024)
- 5.1.2 Global Export Volume by Country (2024)
- 5.1.3 Global Import Value by Country (2024)
- 5.1.4 Global Import Volume by Country (2024)
- 5.1.5 Net Trade Balance by Country (2024)
- 5.2 Export Analysis – Segment
- 5.2.1 Type 1 (HS Code)
- 5.2.2 Type 2 (HS Code)
- 5.2.3 Type 3 (HS Code)
- 5.2.4 Type 4 (HS Code)
- 5.2.5 Type 5 (HS Code)
- 5.3 Import Analysis – Segment
- 5.3.1 Type 1 (HS Code)
- 5.3.2 Type 2 (HS Code)
- 5.3.3 Type 3 (HS Code)
- 5.3.4 Type 4 (HS Code)
- 5.3.5 Type 5 (HS Code)
- 5.4 Average Unit Trade Prices
- 5.4.1 Average Export Price – Segment & Country
- 5.4.2 Average Import Price – Segment & Source Country
- 5.4.3 Price Trends (2024)
- 5.5 Key Trade Route Analysis
- 5.5.1 Trade Route 1
- 5.5.2 Trade Route 2
- 5.5.3 Trade Route 3
- 5.5.4 Trade Route 4
- 5.5.5 Trade Route 5
- 5.6 Trade Policy Impact Assessment
- 5.6.1 US Anti-Dumping & Section 301 Tariffs
- 5.6.2 EU Customs Union Impact
- 5.6.3 Major Free Trade Agreements
- 5.6.4 USMCA Rules of Origin
Note: Trade policy analysis will be included only where relevant to the Skincare Ingredients market.
Chapter 6. Competitive Landscape & Company Benchmarking
- 6.1 Skincare Ingredients Market Concentration & Structure
- 6.1.1 Herfindahl-Hirschman Index (HHI) – vs. 2024
- 6.1.2 Tier 1, Tier 2 & Tier 3 Market Structure
- 6.1.3 Global, Regional & Local Player Dynamics
- 6.2 Skincare Ingredients Market Share Analysis – 2024
- 6.2.1 Global Revenue Share by Company
- 6.2.2 Global Volume Share by Company
- 6.2.3 Regional Revenue Share
- 6.2.4 Market Share Evolution ( vs. 2024)
- 6.2.5 OEM Segment Share by Company
- 6.2.6 Replacement Segment Share by Company
- 6.3 Production/Delivery Capacity & Facility Analysis
- 6.3.1 Global Installed Capacity
- 6.3.2 Capacity Utilization Rates
- 6.3.3 Production/Output Volume
- 6.3.4 Facility Locations & Capacity Map
- 6.3.5 Planned Capacity Additions
- 6.4 Skincare Ingredients Competitive Benchmarking Matrix
- 6.4.1 Revenue, Volume, CAGR & Profitability Comparison
- 6.4.2 Channel Revenue Mix
- 6.4.3 Geographic Revenue Exposure
- 6.4.4 R&D Intensity
- 6.4.5 Sustainability Maturity
- 6.5 Strategic Developments in Skincare Ingredients (Last 24 Months)
- 6.5.1 Mergers, Acquisitions & Divestments
- 6.5.2 New Skincare Ingredients Launches
- 6.5.3 Facility Expansions
- 6.5.4 Strategic Alliances, Joint Ventures & Partnerships
- 6.5.5 Distribution Expansion & Market Entry
- 6.5.6 Sustainability & ESG Initiatives
- 6.6 Competitive Strategy Mapping
- 6.6.1 Leader, Challenger, Follower & Niche Classification
- 6.6.2 Pricing Strategy Comparison
- 6.6.3 Channel Strategy Matrix
Note: Strategic developments are included based on their materiality and the availability of reliable information.
Chapter 7. Global Skincare Ingredients Market – By Distribution Channel
- 7.1 Segment Overview
- 7.1.1 Volume & Revenue Split by Channel (2024 & 2032)
- 7.1.2 Channel Mix Evolution (2024-2032)
Chapter 8. Regional Market Analysis – Global Overview
- 8.1 Global Regional Overview
- 8.1.1 Regional Volume Share
- 8.1.2 Regional Revenue Share
- 8.1.3 Regional Volume by Region
- 8.1.4 Regional Revenue by Region
- 8.1.5 Regional Forecast Through 2032
- 8.2 Cross-Regional Segment Analysis
- 8.2.1 By Distribution Channel
- 8.2.2 By Brand/Price Tier
Chapter 9. North America Skincare Ingredients Market
- 9.1 United States
- 9.2 Canada
- 9.3 Mexico
Chapter 10. Europe Skincare Ingredients Market
- 10.1 Germany
- 10.2 France
- 10.3 Italy
- 10.4 United Kingdom
- 10.5 Spain
- 10.6 Poland
- 10.7 Russia
- 10.8 Netherlands
- 10.9 Belgium
- 10.10 Sweden
- 10.11 Denmark
- 10.12 Norway
- 10.13 Rest of Europe
Chapter 11. Asia Pacific Skincare Ingredients Market
- 11.1 China
- 11.2 India
- 11.3 Japan
- 11.4 South Korea
- 11.5 Thailand
- 11.6 Indonesia
- 11.7 Vietnam
- 11.8 Malaysia
- 11.9 Australia
- 11.10 Rest of Asia Pacific
Chapter 12. Latin America Skincare Ingredients Market
- 12.1 Brazil
- 12.2 Argentina
- 12.3 Colombia
- 12.4 Chile
- 12.5 Rest of Latin America
Chapter 13. Middle East Skincare Ingredients Market
- 13.1 Saudi Arabia
- 13.2 United Arab Emirates
- 13.3 Turkey
- 13.4 Israel
- 13.5 Iran
- 13.6 Rest of the Middle East
Chapter 14. Africa Skincare Ingredients Market
- 14.1 South Africa
- 14.2 Egypt
- 14.3 Nigeria
- 14.4 Morocco
- 14.5 Rest of Africa
Chapter 15. Skincare Ingredients Company Profiles
- 15.1 [Company 01]
- 15.1.1 Company Overview
- 15.1.2 Key Management Personnel
- 15.1.3 Products & Services Portfolio
- 15.1.4 Financial Performance
- 15.1.5 Key Market Focus & Geographic Presence
- 15.1.6 Recent Developments & Strategic Initiatives
Note: The company profile list is preliminary and may change based on research findings, market developments, data availability, and client requirements.
Chapter 16. Appendices
- Appendix A – List of Abbreviations & Acronyms
- Appendix B – Industry Classification Code Reference – Full Series
- Appendix C – Production & Capacity Data Tables
- Appendix D – End-Use & Demand Base Tables
- Appendix E – Consumption & Replacement Rate Assumptions
- Appendix F – ASP Reference Tables
- Appendix G – Manufacturing & Facility Database
- Appendix H – Import-Export Data Tables
- Appendix I – Regulatory Summary Tables
- Appendix J – Primary Research Participant List (Anonymized)
- Appendix K – Primary Research Questionnaire Framework
- Appendix L – Data Sources & Bibliography
- Appendix M – Market Size Divergence & Source Comparison
Chapter 17. Research Methodology
- 17.1 Research Framework & Philosophy
- 17.2 Secondary Research – Sources, Hierarchy & Data Extraction
- 17.3 Data Modeling – Bottom-Up & Top-Down Market Sizing
- 17.4 Primary Research – Stakeholder Framework, LOI & Sample Sizes
- 17.5 Forecast Methodology – Regression, Scenario & Sensitivity Analysis
- 17.6 Quality Control – Four-Layer Validation Framework
- 17.7 Limitations & Standard Assumptions
- 17.8 Disclaimer
