Market Overview:
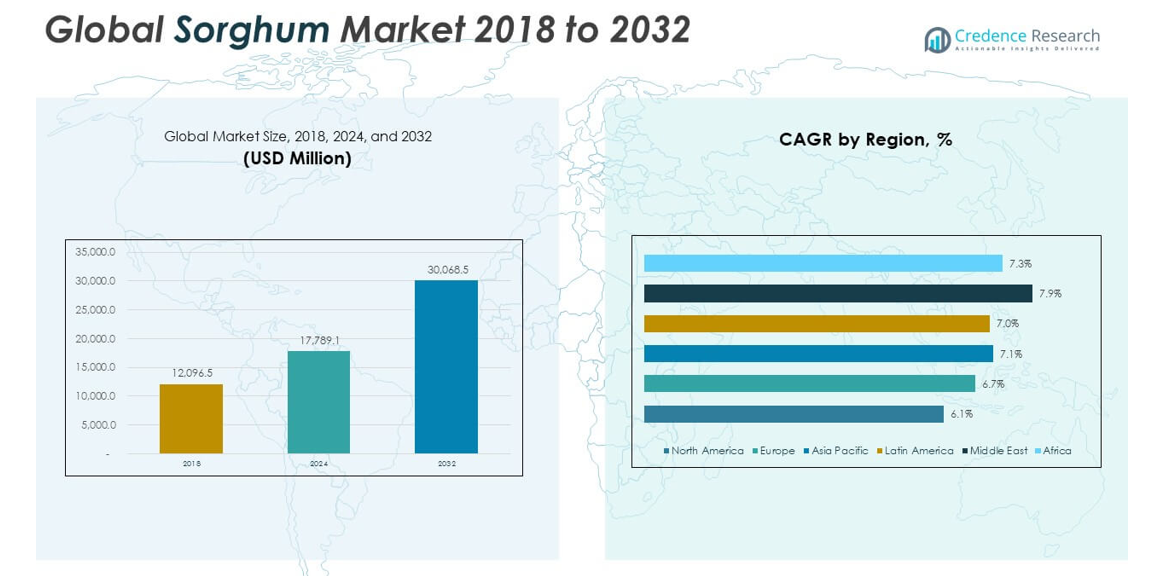
The Global Sorghum Market size was valued at USD 12,096.5 million in 2018 to USD 17,789.1 million in 2024 and is anticipated to reach USD 30,068.5 million by 2032, at a CAGR of 6.81% during the forecast period.
| REPORT ATTRIBUTE |
DETAILS |
| Historical Period |
2020-2023 |
| Base Year |
2024 |
| Forecast Period |
2025-2032 |
| Sorghum Market Size 2024 |
USD 17,789.1 million |
| Sorghum Market, CAGR |
6.81% |
| Sorghum Market Size 2032 |
USD 30,068.5 million |
The Global Sorghum Market is driven by increasing demand for gluten-free grains, expanding use in livestock feed, and growing adoption in renewable energy production. It benefits from sorghum’s drought tolerance, high nutritional value, and adaptability across diverse climates. Rising consumer preference for fiber-rich, healthy foods also contributes to growth. Hybrid seed innovations and precision agriculture technologies further support higher yields and improved crop resilience, strengthening sorghum’s role in food security and sustainability.
North America leads the Global Sorghum Market due to large-scale production and strong biofuel adoption, while Asia Pacific emerges as the largest consumer region with rising demand in China, India, and Australia. Europe is advancing its position through gluten-free food and beverage innovation. Latin America expands production for feed and export markets, and Africa remains vital as a traditional consumer and producer. The Middle East is also adopting sorghum in response to food security challenges and climate conditions.
Market Insights:
- The Global Sorghum Market size was USD 12,096.5 million in 2018, rising to USD 17,789.1 million in 2024, and is expected to reach USD 30,068.5 million by 2032, registering a CAGR of 6.81%.
- Asia Pacific led with a 36% share in 2024 due to strong demand in China, India, and Australia, followed by Europe at 27% with focus on gluten-free innovation, and North America at 21% driven by biofuel and livestock feed industries.
- The Middle East is the fastest-growing region with a 5% share, supported by rising food security initiatives, water-efficient crop adoption, and expanding demand for gluten-free diets.
- Grain sorghum dominated with 42% share in 2024, supported by its wide use in both food and feed sectors.
- Forage sorghum held 28% share, reflecting its importance in livestock nutrition and resilience under challenging climate conditions.
Access crucial information at unmatched prices!
Request your sample report today & start making informed decisions powered by Credence Research Inc.!
Download Sample
Market Drivers
Rising Consumer Demand For Gluten-Free And Nutrient-Dense Grain Alternatives
The Global Sorghum Market is gaining strong traction from the increasing demand for gluten-free alternatives. Consumers worldwide are shifting toward diets that prioritize health, digestive wellness, and nutrient-rich foods. Sorghum, being naturally gluten-free, fits well into this growing preference. It offers high fiber, essential minerals, and antioxidants, positioning it as a healthier option compared to wheat and corn. Rising cases of gluten intolerance and celiac disease also create wider adoption. Food processors are introducing sorghum-based flours, snacks, and beverages to cater to health-conscious buyers. Global awareness campaigns about sorghum’s benefits further drive consumption. Governments in several regions also support programs promoting its role in food security and nutrition.
Expanding Application Of Sorghum In Animal Feed And Livestock Nutrition
The Global Sorghum Market benefits significantly from its rising adoption in animal feed production. Sorghum serves as an effective alternative to maize and wheat in poultry, cattle, and swine feed. It provides essential proteins, starch, and energy, making it cost-effective for livestock nutrition. Feed manufacturers highlight sorghum’s adaptability and digestibility across multiple animal categories. Rising demand for meat and dairy products globally increases the requirement for reliable feed grains. It also strengthens market stability as farmers adopt sorghum to offset maize shortages. Expanding agribusiness investments in animal feed industries ensure long-term inclusion of sorghum. Its drought resistance secures stable yields even under fluctuating climatic conditions, supporting reliable supply chains.
- For instance, U.S. sorghum was tested in 2021–2022 poultry feed trials in Kenya, funded by the USDA and Texas Grain Sorghum Producers, where broiler chickens fed diets with full corn replacement by sorghum achieved growth rates and final weights comparable to corn-based controls, confirming its suitability for commercial feed formulations.
Increasing Focus On Renewable Energy And Biofuel Production Using Sorghum
The Global Sorghum Market sees significant momentum from its expanding role in biofuel industries. Sweet sorghum varieties are increasingly cultivated for ethanol production due to their high sugar content. This biofuel application aligns with sustainability targets and renewable energy policies across multiple regions. Governments and private players invest in refining technologies that maximize ethanol output from sorghum stalks. It positions sorghum as a viable competitor to corn in the biofuel segment. Growing concerns about fossil fuel dependency support the development of alternative energy crops. Its adaptability to marginal lands enables cultivation in areas unsuitable for other feedstocks. Industrial players scale up commercial projects that integrate sorghum into large-scale renewable energy frameworks.
Technological Advancements And Hybrid Seed Development Driving Productivity
The Global Sorghum Market benefits from continuous improvements in agricultural biotechnology and seed research. Hybrid sorghum varieties are engineered to resist pests, tolerate drought, and deliver higher yields. Research institutions and seed companies focus on genetic innovations to enhance productivity. Improved crop resilience reduces farmer risks and enhances profitability. Technology-driven irrigation and precision farming solutions also boost sorghum cultivation efficiency. Governments and organizations invest in farmer training to promote best agronomic practices. Advanced seed technology expands adoption in both developed and developing economies. The integration of R&D with commercial farming strengthens the market’s growth potential across food, feed, and energy applications.
- For instance, Colorado State University Sorghum Hybrid Performance Trials reported average commercial hybrid silage yields of 14 tons per acre (about 35 tons per hectare) in 2022, representing the highest recorded sorghum silage yield in Colorado over the past decade and reflecting advances by commercial seed companies.
Market Trends
Rising Popularity Of Sorghum-Based Beverages In Health-Conscious Consumer Markets
The Global Sorghum Market is experiencing strong growth from demand for sorghum-based beverages. Brewing companies explore sorghum as a base for gluten-free beers, energy drinks, and health-focused beverages. It offers a naturally rich profile of antioxidants and fibers, aligning with wellness trends. Small-scale and premium brands experiment with sorghum blends to create differentiated products. Consumer demand for functional drinks with unique ingredients fuels new product launches. Beverage firms position sorghum as a sustainable, clean-label ingredient for growing markets. Health-conscious buyers seek natural alternatives without additives, boosting acceptance of sorghum-based drinks. Expanding retail channels increase product visibility and drive steady consumption.
Integration Of Sorghum Into Bakery, Snacks, And Packaged Food Innovations
The Global Sorghum Market benefits from its rising use in bakery, snacks, and convenience foods. Sorghum flour is now included in bread, crackers, biscuits, and gluten-free pasta. Packaged food companies market sorghum-based products for consumers avoiding traditional grains. Its light texture and mild flavor enhance bakery innovation. Demand for plant-based and allergen-free snacks promotes sorghum as a functional ingredient. Major retailers expand gluten-free product lines, introducing sorghum across diverse packaged categories. Global urbanization and busy lifestyles favor healthy convenience food options. Sorghum’s growing presence in processed food portfolios ensures consistent demand from retail and food service chains.
- For instance, Bob’s Red Mill supplies gluten-free, non-GMO whole grain sorghum flour in a 22 oz stone-ground format, as confirmed by official product listings and retail documentation in the United States.
Growing Role Of Sorghum In Sustainable Agriculture And Climate Adaptation Practices
The Global Sorghum Market aligns with rising interest in sustainable agriculture practices. Its natural drought tolerance makes it suitable for climate-resilient farming. Farmers adopt sorghum to adapt to reduced rainfall and unpredictable weather cycles. International agencies promote sorghum as a crop that conserves water resources. Its ability to grow in marginal soils supports environmental conservation. Governments encourage cultivation through subsidies and awareness programs in water-stressed regions. Sorghum’s environmental profile enhances its image as a sustainable crop option. Increasing adoption in arid and semi-arid regions drives long-term expansion of cultivation.
Application Of Digital Farming And Precision Technology For Sorghum Cultivation
The Global Sorghum Market is shaped by the growing adoption of digital farming solutions. Farmers use precision irrigation, satellite mapping, and sensor technologies to optimize cultivation. Data-driven tools track soil moisture, seed performance, and crop health. It reduces input costs while improving output quality and yield. Agritech companies design applications that provide guidance on sorghum-specific conditions. Integration of IoT and AI helps small and large farmers enhance resource management. Adoption of drones and automated machinery further boosts efficiency. This trend strengthens sorghum’s role as a high-value crop under modern farming ecosystems.
- For example, Texas sorghum producers averaged 62 bushels per acre in 2024, rising from 49 bushels per acre in 2023, supported by improved hybrid selection and greater use of precision agriculture technologies, according to Texas A&M AgriLife Research performance trials and USDA production data.
Market Challenges Analysis
Limited Awareness, Market Penetration Issues, And Competition From Other Staple Crops
The Global Sorghum Market faces challenges from limited awareness among consumers in some regions. Many buyers still prefer wheat, rice, or corn due to familiarity. Lack of branding and marketing limits sorghum’s ability to compete in packaged food segments. It also faces stiff competition in animal feed markets from cheaper or more accessible grains. Low consumer education on sorghum’s nutritional benefits restricts adoption. Food companies hesitate to invest in new product lines without established demand. Import-export imbalances create further limitations in reaching high-value markets. Strengthening consumer campaigns and trade policies remains critical to expand reach.
Supply Chain Inefficiencies, Climatic Risks, And Technological Gaps In Production
The Global Sorghum Market encounters obstacles linked to supply chain and climatic risks. Drought resilience does not completely protect against severe weather shocks that damage yields. Variability in seed quality and inconsistent access to improved hybrids affect production stability. Smallholder farmers lack financial support and technical training to adopt modern practices. Market infrastructure in developing regions remains weak, limiting exports and logistics efficiency. Fluctuating global commodity prices also affect farmer incomes and investment levels. Processing and value-addition technologies for sorghum remain underdeveloped compared to other grains. Bridging these gaps is crucial for market sustainability.
Market Opportunities
Expanding Role Of Sorghum In Functional Foods, Nutraceuticals, And Specialty Products
The Global Sorghum Market holds opportunities in functional foods and nutraceutical development. Sorghum’s antioxidant, anti-inflammatory, and fiber-rich properties support wellness products. Nutraceutical brands can introduce sorghum-based dietary supplements, protein powders, and energy boosters. Rising consumer interest in natural, plant-based health solutions drives innovation. Its application in specialty foods like diabetic-friendly products enhances potential. Sorghum’s versatility enables entry into premium health food categories. Growing R&D investments from food companies strengthen adoption in functional applications. Expansion in this segment offers new revenue streams beyond traditional markets.
Emerging Opportunities In Bio-Industrial Applications And Circular Economy Integration
The Global Sorghum Market creates opportunities through bio-industrial applications. Sorghum biomass can be used in bio-plastics, biodegradable packaging, and bio-chemicals. Its role in the circular economy aligns with global sustainability goals. Industrial players explore cost-efficient sorghum feedstock for eco-friendly production. Government support for green industrial projects creates new incentives. Developing regions with large cultivation areas can expand exports for industrial processing. Partnerships between agriculture and manufacturing sectors open new commercialization pathways. These opportunities highlight sorghum’s transition into diverse, high-value applications beyond food and feed.
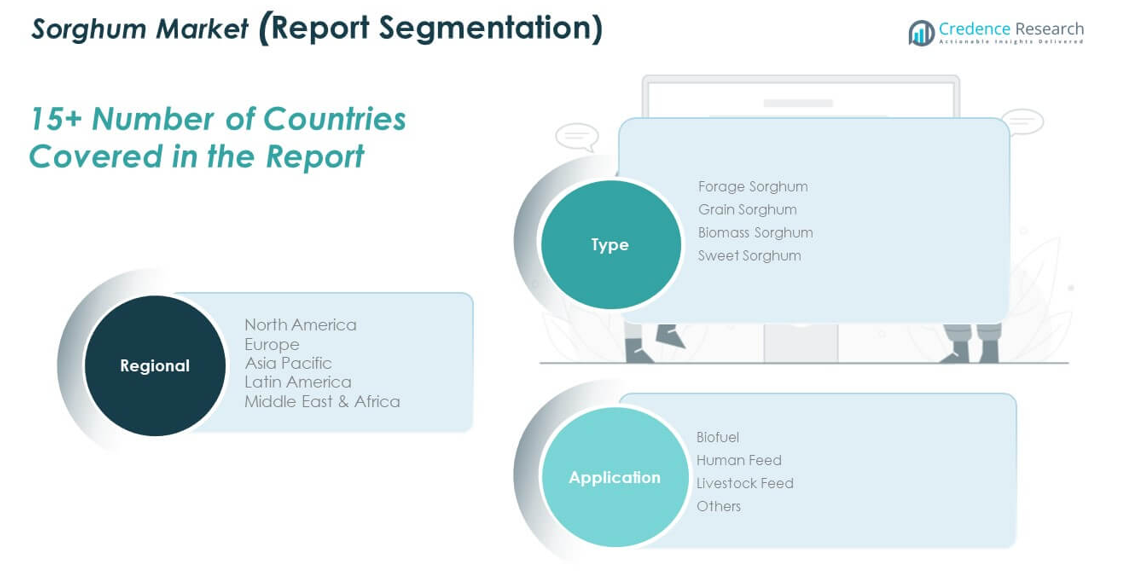
Market Segmentation Analysis:
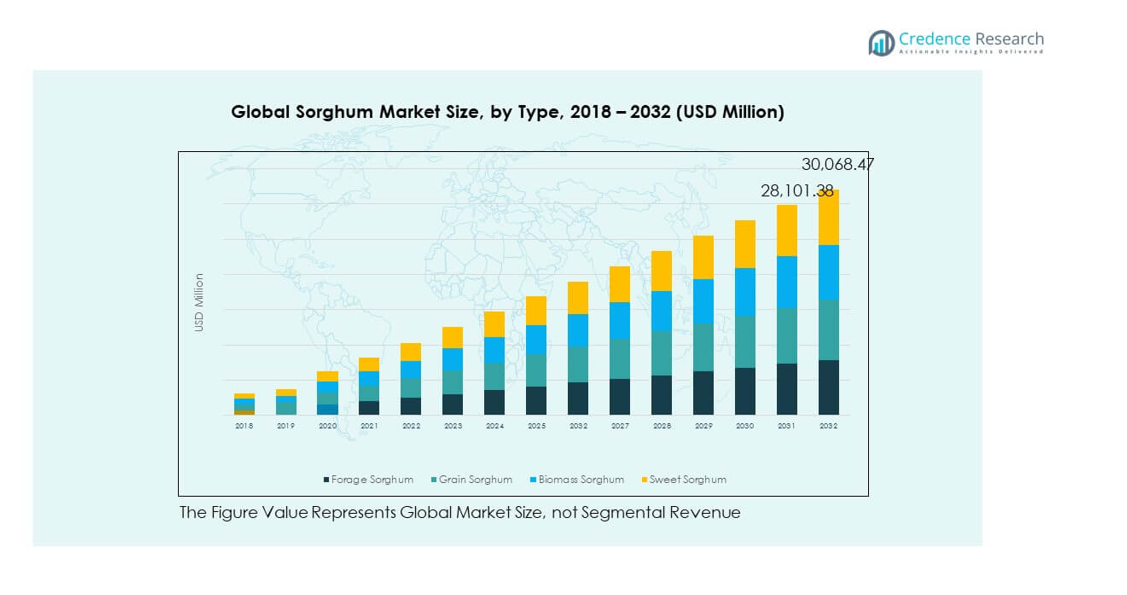
By type, the Global Sorghum Market is structured across multiple type categories that serve diverse industries. Grain sorghum dominates due to its extensive use in food and feed products, supported by strong demand for gluten-free diets and livestock nutrition. Forage sorghum maintains significance in animal husbandry, offering high yield and resilience for fodder production. Sweet sorghum gains traction for ethanol and renewable energy applications, driven by its high sugar content and alignment with biofuel targets. Biomass sorghum supports bio-industrial uses, reflecting its role in sustainability projects. Other types contribute to niche consumption, reinforcing versatility across agricultural systems.
- For instance, the Indian Institute of Millets Research in 2024 verified a new sweet sorghum variety delivering juice yields of 15,000–16,000 liters per hectare, compared to 12,000–14,000 liters per hectare in older varieties, strengthening support for government bioethanol initiatives.
By application, the Global Sorghum Market demonstrates strength in livestock feed, with consistent demand from poultry, cattle, and swine industries. Human feed applications expand, driven by consumer preferences for healthy grains in bakery, beverages, and packaged foods. Biofuel use grows steadily, positioning sorghum as a renewable alternative to conventional feedstocks. Other applications, including industrial uses, broaden the crop’s utility and enhance overall market adoption.
- For instance, documented performance trials published in February 2024 reported that sweet sorghum in India, specifically the CSH 22 SS hybrid, achieved ethanol yields of up to 53 liters per metric ton of stalk.
Segmentation:
By Type
- Forage Sorghum
- Grain Sorghum
- Biomass Sorghum
- Sweet Sorghum
- Others
By Application
- Biofuel
- Human Feed
- Livestock Feed
- Others
By Region
- North America
- Europe
- UK
- France
- Germany
- Italy
- Spain
- Russia
- Belgium
- Netherlands
- Austria
- Sweden
- Poland
- Denmark
- Switzerland
- Rest of Europe
- Asia Pacific
- China
- Japan
- South Korea
- India
- Australia
- Thailand
- Indonesia
- Vietnam
- Malaysia
- Philippines
- Taiwan
- Rest of Asia Pacific
- Latin America
- Brazil
- Argentina
- Peru
- Chile
- Colombia
- Rest of Latin America
- Middle East
- UAE
- KSA
- Israel
- Turkey
- Iran
- Rest of Middle East
- Africa
- Egypt
- Nigeria
- Algeria
- Morocco
- Rest of Africa
Regional Analysis:
North America
The North America Global Sorghum Market size was valued at USD 2,673.33 million in 2018 to USD 3,779.68 million in 2024 and is anticipated to reach USD 6,046.77 million by 2032, at a CAGR of 6.1% during the forecast period. North America holds a 21% market share in the Global Sorghum Market, driven by strong demand in biofuel production and livestock feed. The U.S. dominates with large-scale cultivation supported by government ethanol mandates and established export networks. It benefits from advanced farming practices, hybrid seeds, and precision technologies that secure consistent yields. Rising demand for gluten-free foods also increases sorghum’s use in human consumption. Canada shows gradual adoption, focusing on specialty grain exports. Mexico remains a significant consumer for feed and food segments. Strong infrastructure, research investments, and export opportunities consolidate North America’s position as a leading regional contributor.
Europe
The Europe Global Sorghum Market size was valued at USD 3,293.88 million in 2018 to USD 4,818.06 million in 2024 and is anticipated to reach USD 8,085.41 million by 2032, at a CAGR of 6.7% during the forecast period. Europe accounts for a 27% market share in the Global Sorghum Market, supported by its growing use in gluten-free foods and beverages. Countries such as France and Spain lead production, leveraging sorghum for both feed and human diets. Rising consumer preference for organic and sustainable crops strengthens its demand. Regulatory focus on reducing water usage makes sorghum attractive for environmentally conscious farming. Sorghum-based beers and bakery items expand its penetration in health-focused segments. Research programs in Germany and Italy emphasize biofuel potential and value-added products. Import reliance in northern markets creates opportunities for global suppliers. Europe’s strong food innovation culture keeps demand on an upward trajectory.
Asia Pacific
The Asia Pacific Global Sorghum Market size was valued at USD 4,245.88 million in 2018 to USD 6,338.52 million in 2024 and is anticipated to reach USD 10,926.88 million by 2032, at a CAGR of 7.1% during the forecast period. Asia Pacific leads with a 36% market share in the Global Sorghum Market, making it the largest regional contributor. China and India drive cultivation, fueled by demand for feed, food, and industrial applications. Expanding middle-class populations create a higher appetite for meat and dairy, supporting feed consumption. Japan and South Korea explore sorghum in specialty foods and beverages. Australia plays a vital role in exports, supplying feed-grade sorghum to Asian buyers. Government support for drought-resistant crops boosts adoption in semi-arid regions. Increasing investments in modern farming technologies enhance yields. Strong domestic demand coupled with global trade integration secures Asia Pacific’s dominant role.
Latin America
The Latin America Global Sorghum Market size was valued at USD 954.42 million in 2018 to USD 1,419.57 million in 2024 and is anticipated to reach USD 2,435.55 million by 2032, at a CAGR of 7.0% during the forecast period. Latin America holds an 8% market share in the Global Sorghum Market, led by Brazil and Argentina. Both countries expand production for livestock feed, aligning with their strong meat export industries. Brazil explores biofuel integration with sorghum as an alternative to sugarcane ethanol. Argentina emphasizes export opportunities for both feed and grain types. Rising awareness of sorghum’s nutritional benefits boosts its inclusion in human diets. Smaller economies in the region gradually adopt sorghum in feed and food processing. Climate resilience makes it attractive under shifting weather patterns. Export competitiveness strengthens Latin America’s growing footprint in the global market.
Middle East
The Middle East Global Sorghum Market size was valued at USD 524.99 million in 2018 to USD 823.13 million in 2024 and is anticipated to reach USD 1,506.43 million by 2032, at a CAGR of 7.9% during the forecast period. The Middle East represents a 5% market share in the Global Sorghum Market, with demand led by GCC countries. Rising dependence on imports drives regional trade activities. Governments promote sorghum adoption to reduce reliance on wheat and maize in food security programs. Israel and Turkey experiment with sorghum for sustainable agriculture and specialty foods. Feed industries integrate sorghum into livestock diets due to cost efficiency. Investments in water-saving crops align with regional climate challenges. Partnerships with African and Asian exporters secure supply chains. Growing consumer awareness of gluten-free grains expands niche market applications across the Middle East.
Africa
The Africa Global Sorghum Market size was valued at USD 404.02 million in 2018 to USD 610.17 million in 2024 and is anticipated to reach USD 1,067.43 million by 2032, at a CAGR of 7.3% during the forecast period. Africa accounts for a 3% market share in the Global Sorghum Market, supported by its role as both a producer and consumer. Nigeria, Sudan, and Ethiopia dominate regional output for food and traditional diets. Sorghum serves as a staple crop, ensuring food security for rural populations. Rising demand for livestock feed adds momentum in developing economies. South Africa supports commercial production and export growth. Limited infrastructure and smallholder farming practices present challenges. International aid programs and government initiatives promote modern cultivation methods. Africa’s long-standing reliance on sorghum reinforces its importance in nutrition and economic development.
Shape Your Report to Specific Countries or Regions & Enjoy 30% Off!
Key Player Analysis:
- Cargill, Incorporated
- ADM (Archer Daniels Midland Company)
- Seedway, LLC.
- Ernst Conservation Seeds
- The Scoular Company
- American Seed Co.
- Ardent Mills
- Sorghum Partners
- Advanta Seeds
- Other Key Players
Competitive Analysis:
The Global Sorghum Market is characterized by strong competition among multinational corporations, regional producers, and seed companies. Key players such as Cargill, ADM, The Scoular Company, and Ardent Mills dominate with extensive supply chains, advanced processing capabilities, and global trade networks. It focuses on product diversification, hybrid seed innovation, and biofuel integration to strengthen competitiveness. Companies such as Advanta Seeds and Sorghum Partners emphasize R&D to develop drought-resistant, high-yielding varieties. Regional firms and niche players target localized markets through feed supply and specialty food applications. Strategic initiatives include mergers, acquisitions, and partnerships that expand production footprints and export capacity. Investment in sustainability and digital agriculture technologies also plays a pivotal role. The Global Sorghum Market continues to evolve as leading companies balance food, feed, and industrial applications to capture long-term growth opportunities.
Recent Developments:
- In September 2025, Warner Seeds, a leading United States sorghum seed company, acquired the Sorghum Partners brand and its entire germplasm portfolio from S&W Seed Company. This move gives Warner Seeds access to a top-tier genetic library and positions the business for growth across North and South America, while enhancing its presence in Mexico.
- In July 2025, Cargill formed a strategic partnership with PepsiCo to promote regenerative agriculture across 240,000 acres of Iowa farmland through 2030, focusing on sustainable practices and increased supply chain resilience for staple crops, including sorghum.
- In May 2025, Dekalb introduced two innovative grain sorghum hybrids, DKS43-76 and DKS49-76, which feature improved yield potential, enhanced stalk and root strength, and advanced resistance to wind, pests, and diseases
Report Coverage:
The research report offers an in-depth analysis based on Type and Application. It details leading market players, providing an overview of their business, product offerings, investments, revenue streams, and key applications. Additionally, the report includes insights into the competitive environment, SWOT analysis, current market trends, as well as the primary drivers and constraints. Furthermore, it discusses various factors that have driven market expansion in recent years. The report also explores market dynamics, regulatory scenarios, and technological advancements that are shaping the industry. It assesses the impact of external factors and global economic changes on market growth. Lastly, it provides strategic recommendations for new entrants and established companies to navigate the complexities of the market.
Future Outlook:
- The Global Sorghum Market will expand with rising demand for gluten-free grains in food industries.
- Growth will be supported by stronger adoption of sorghum in animal feed for poultry, swine, and cattle.
- Biofuel integration will accelerate, with sweet sorghum becoming a reliable source for ethanol production.
- Hybrid seed innovations will drive yield improvement and enhance resilience against drought and pests.
- Food companies will diversify product lines with sorghum-based snacks, bakery, and functional beverages.
- Regional markets will strengthen exports, supported by Africa’s production and Asia Pacific’s consumption growth.
- Governments will invest in policies promoting climate-resilient crops, reinforcing sorghum’s strategic importance.
- Digital agriculture tools will improve farm productivity and optimize sorghum cultivation practices globally.
- Trade networks will expand, positioning sorghum as a competitive alternative to traditional feed grains.
- Sustainability initiatives will integrate sorghum into circular economy frameworks and bio-industrial applications


