
Chinese scale sets prices as Western plants close
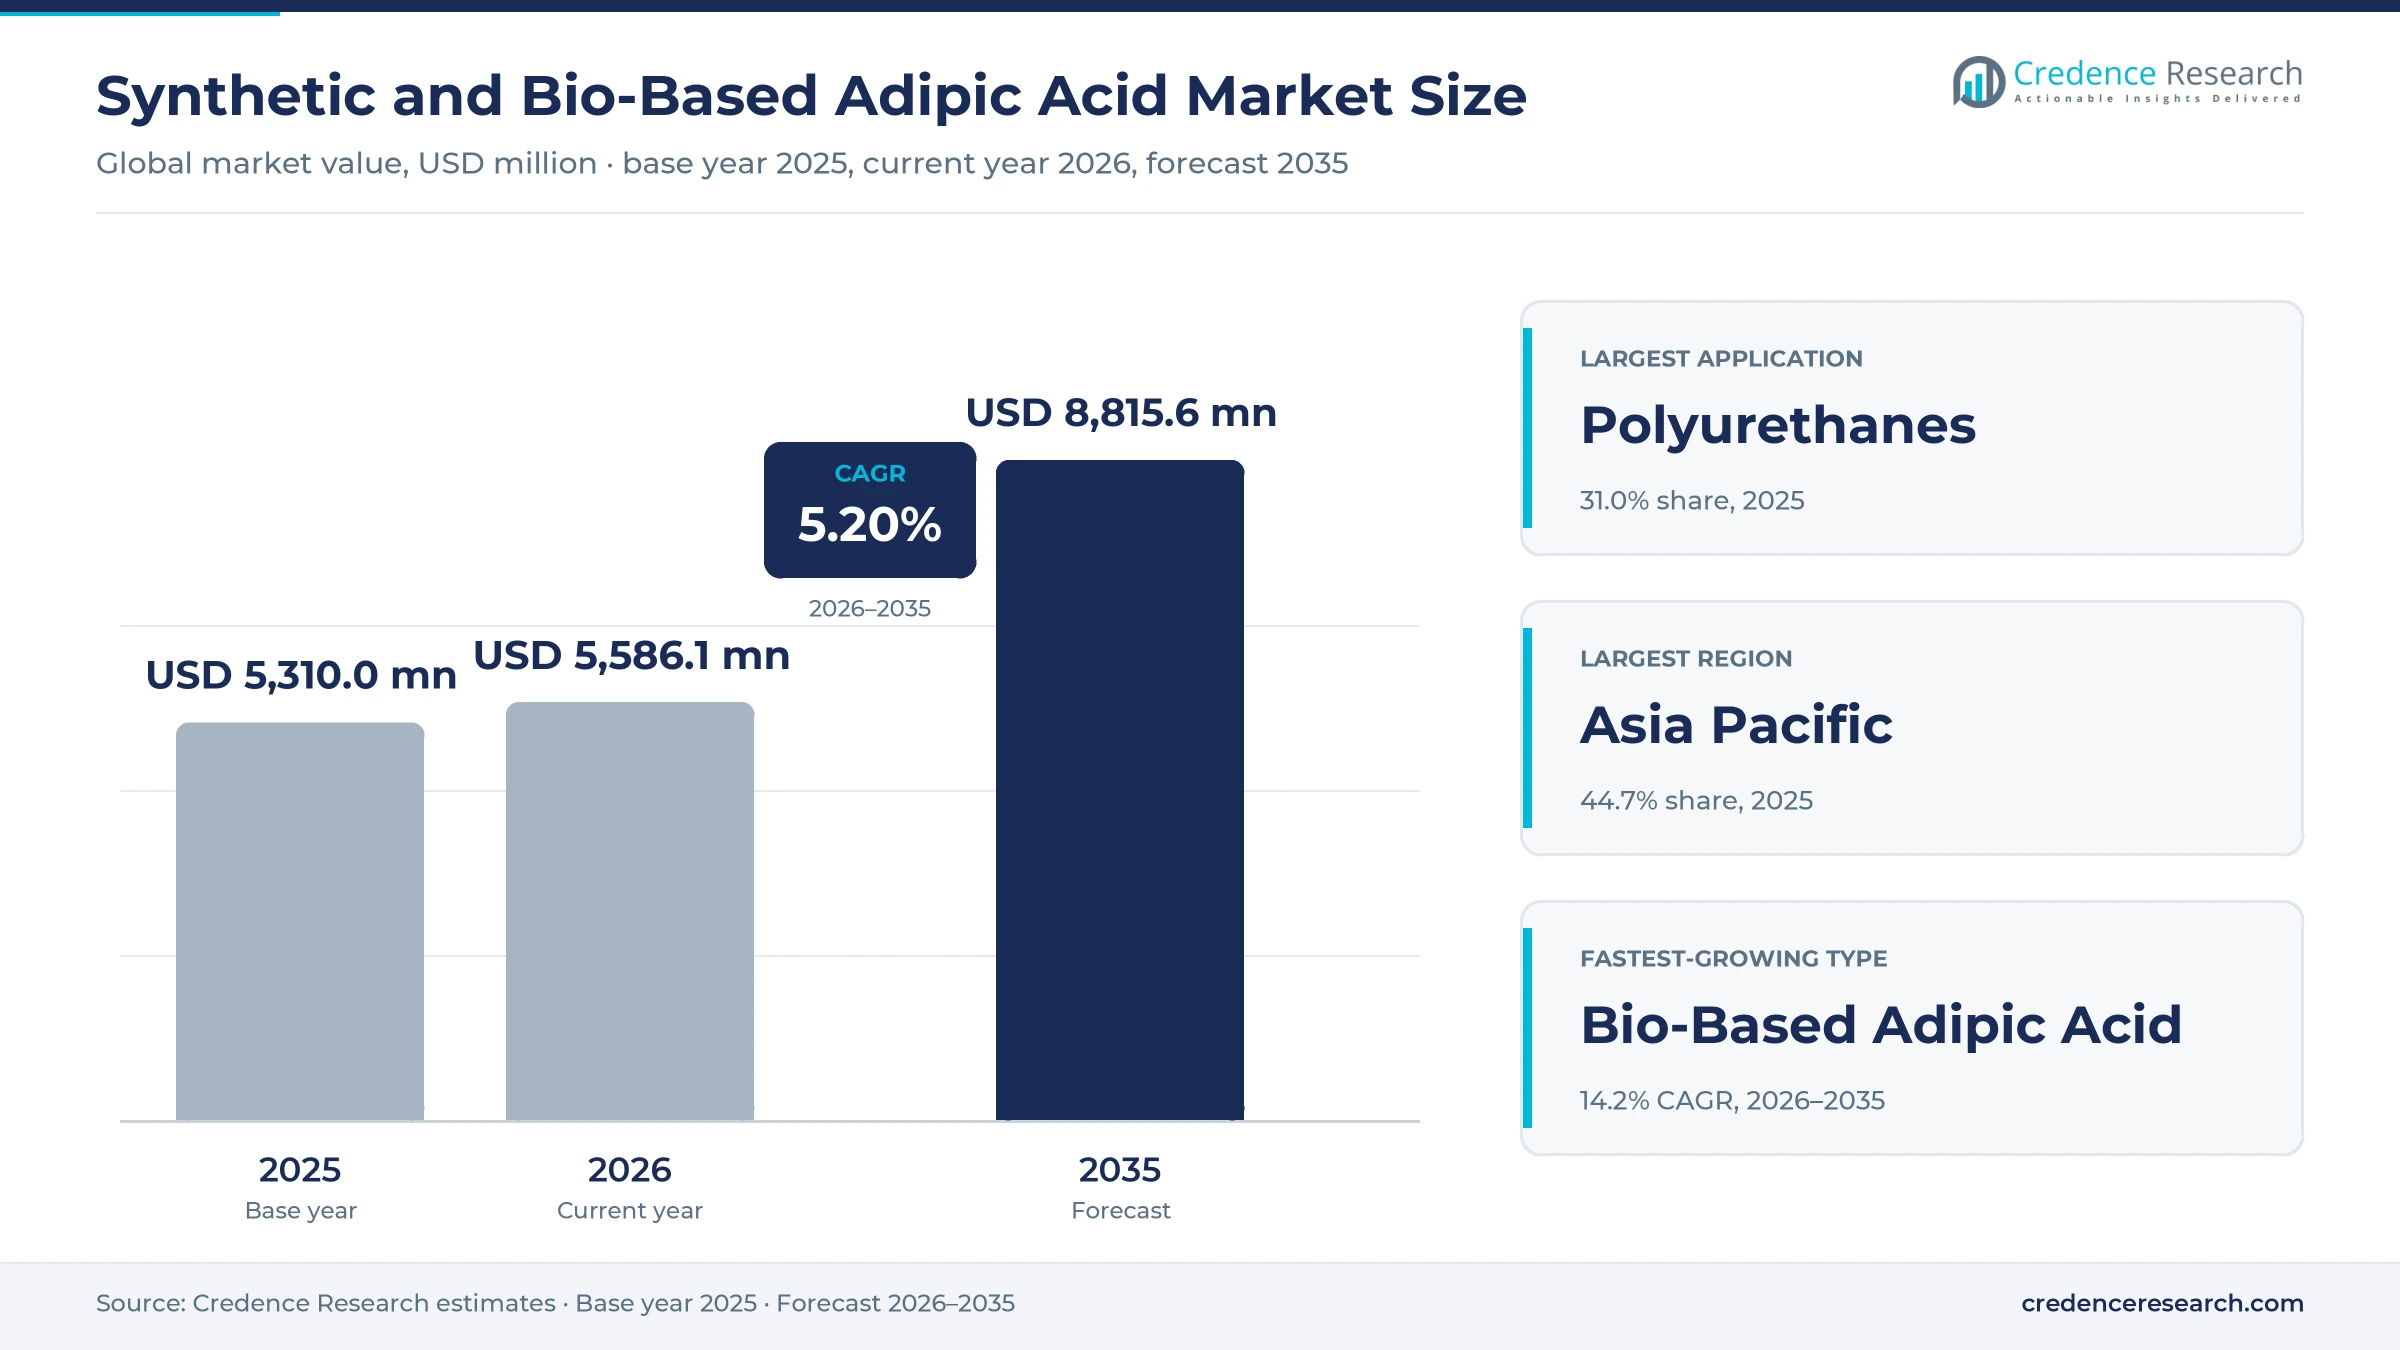
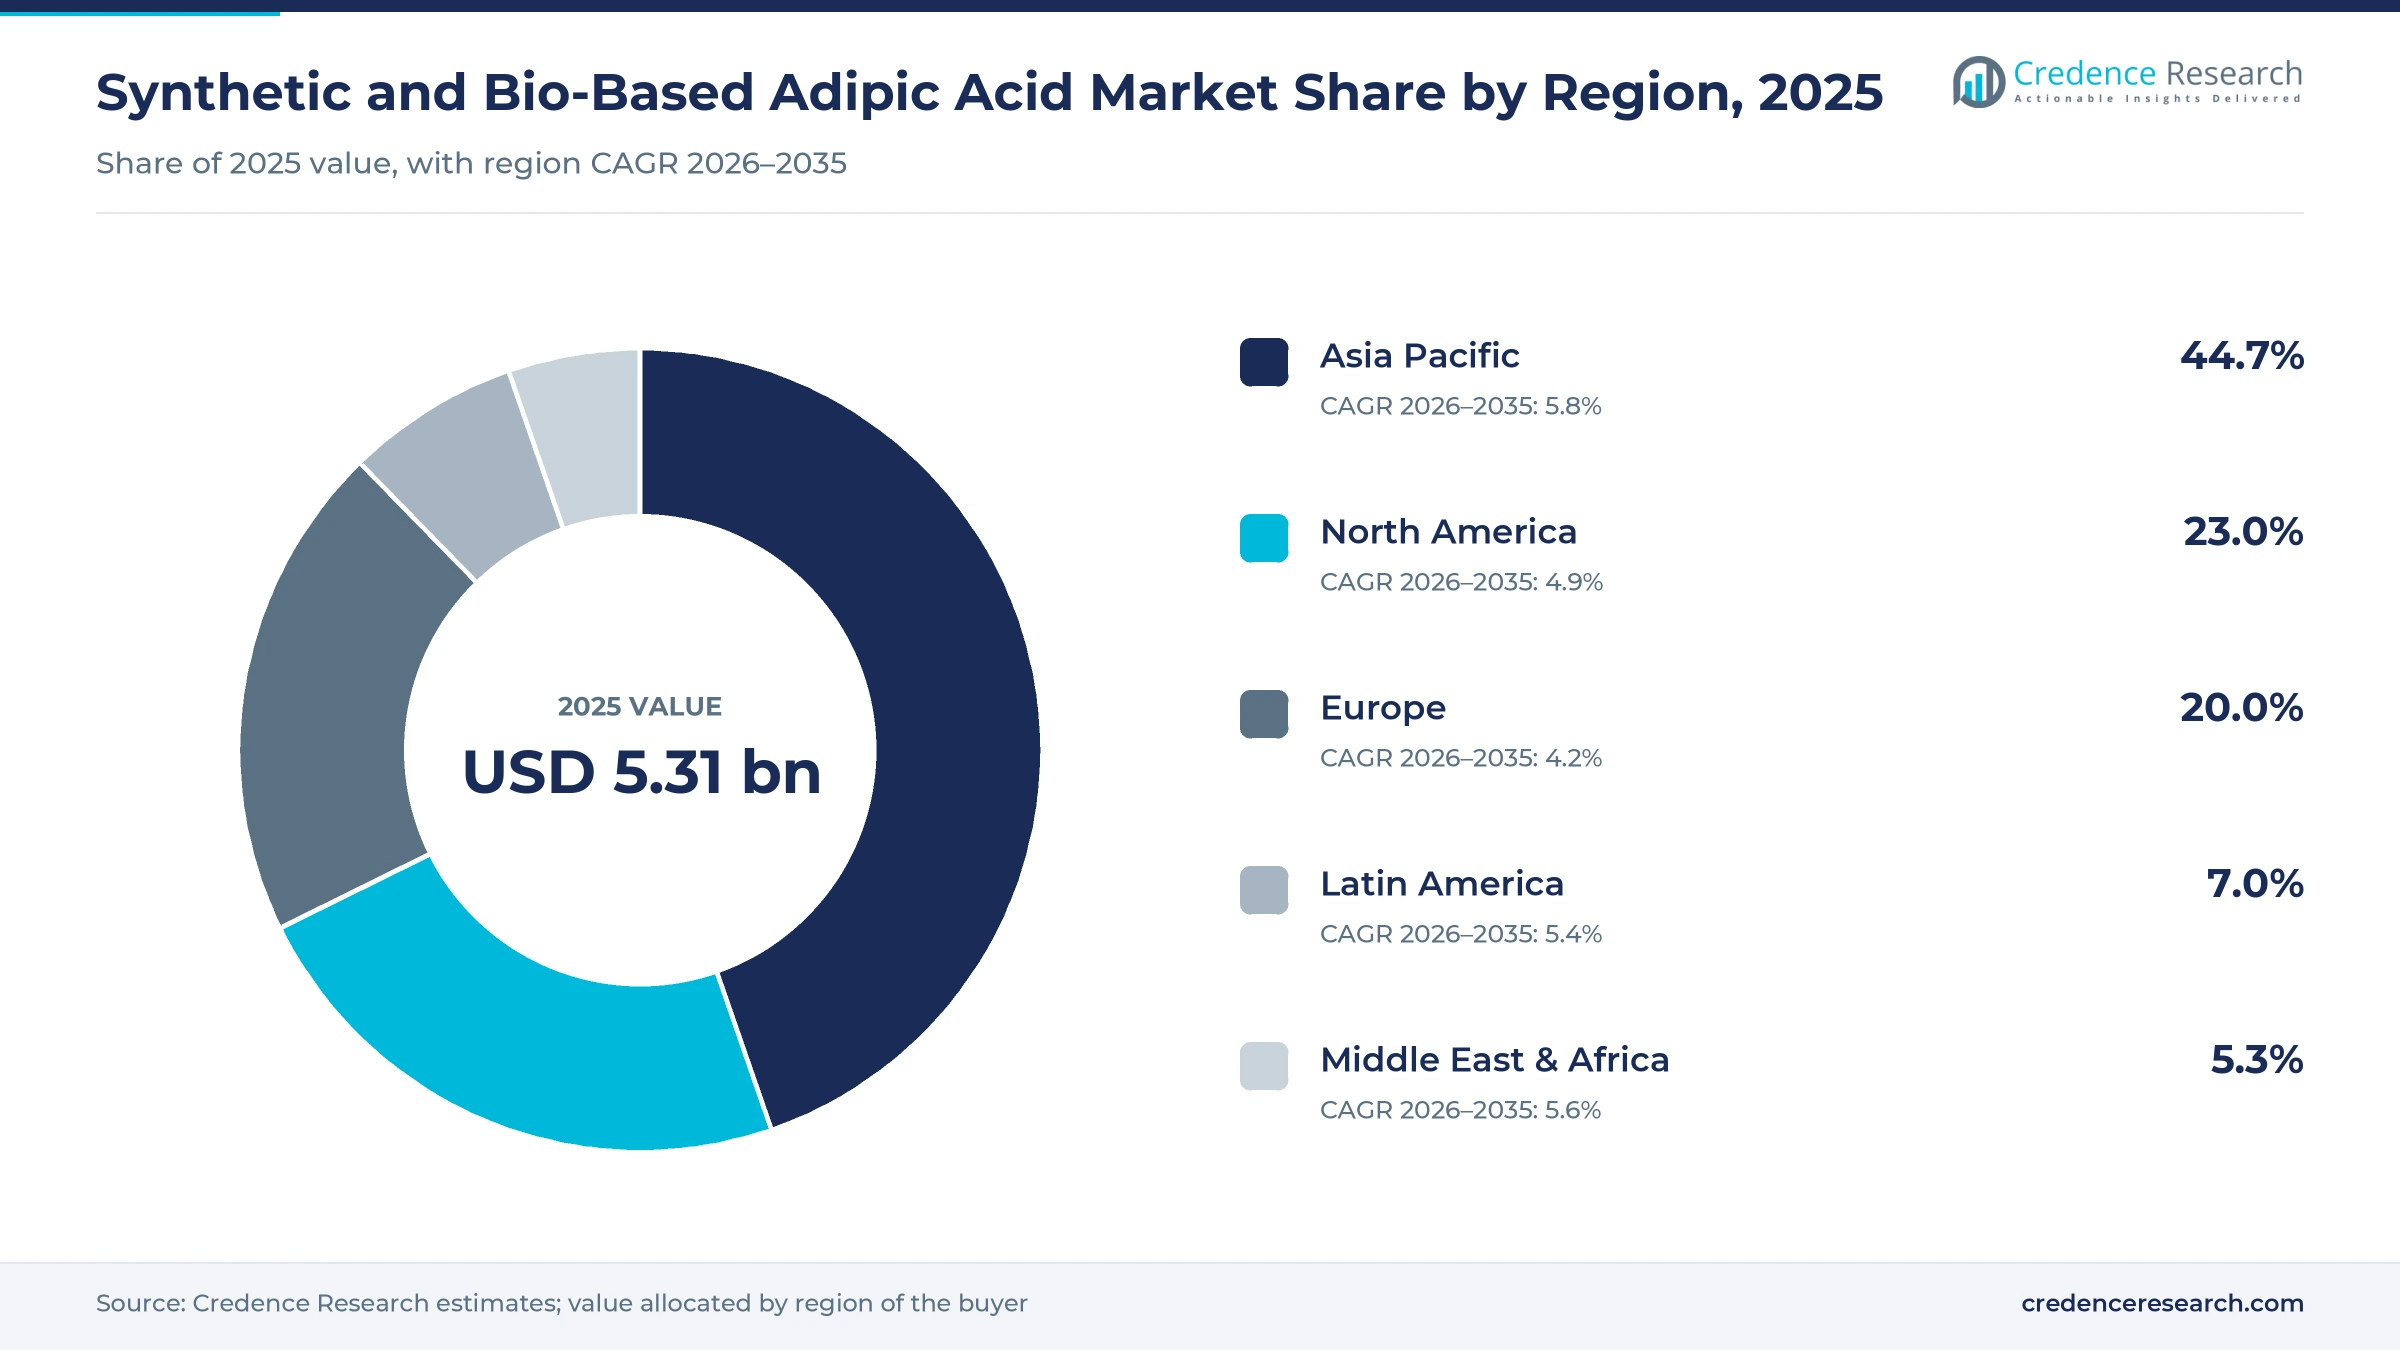
The global synthetic and bio-based adipic acid market was valued at USD 5.31 billion in 2025 and is projected to increase from USD 5.59 billion in 2026 to USD 8.82 billion by 2035, registering a CAGR of 5.20% during 2026–2035. Polyurethane polyols, nylon 6,6 fiber and nylon 6,6 resin take most of the acid, with automakers, footwear makers and textile mills as the main end users. Asia Pacific held the largest regional share, 44.7% in 2025, and is also the fastest-growing region at 5.8% a year, because Chinese plants supply most world output. North America follows with 23.0%, where integrated producers convert most of their acid into their own nylon. The European Commission imposed definitive anti-dumping duties on Chinese adipic acid in May 2026, which shifts European sourcing toward local and non-Chinese supply. Bio-based acid remains a small but fast-growing slice that depends on fermentation routes still at pilot scale, while nitrous oxide rules raise costs for plants without abatement.
Why does adipic acid value follow polyurethane and nylon chains?
The market counts adipic acid sold to outside buyers and transferred inside integrated groups for nylon 6,6, polyester polyols, adipate plasticizers, food acidulants and other uses, valued at the producer price. Synthetic acid comes from oxidizing a cyclohexanol and cyclohexanone mix with nitric acid, while bio-based acid comes from sugar fermentation or from mass-balance attribution of renewable feedstock at conventional plants.
Nylon 6,6 polymer, polyols and finished plastics are excluded from the value, although most acid is consumed inside the same groups that make them. The value chain runs from benzene and cyclohexane through acid plants in China, the U.S., Europe, Japan and South Korea to polyamide, polyurethane and plasticizer makers, which sell to vehicle, apparel, footwear and packaging producers.
Synthetic and Bio-Based Adipic Acid Market Insights
- The market is projected to rise from USD 5.31 billion in 2025 to USD 8.82 billion by 2035 at 5.20% a year, as polyurethane and nylon resin uses add the most new value.
- Asia Pacific held 44.7% of 2025 value and grows fastest at 5.8% a year, because Chinese plants hold most world capacity.
- Polyurethanes led the application split with 31.0% of 2025 value, as polyester polyols for shoe soles and coatings absorb most Chinese output.
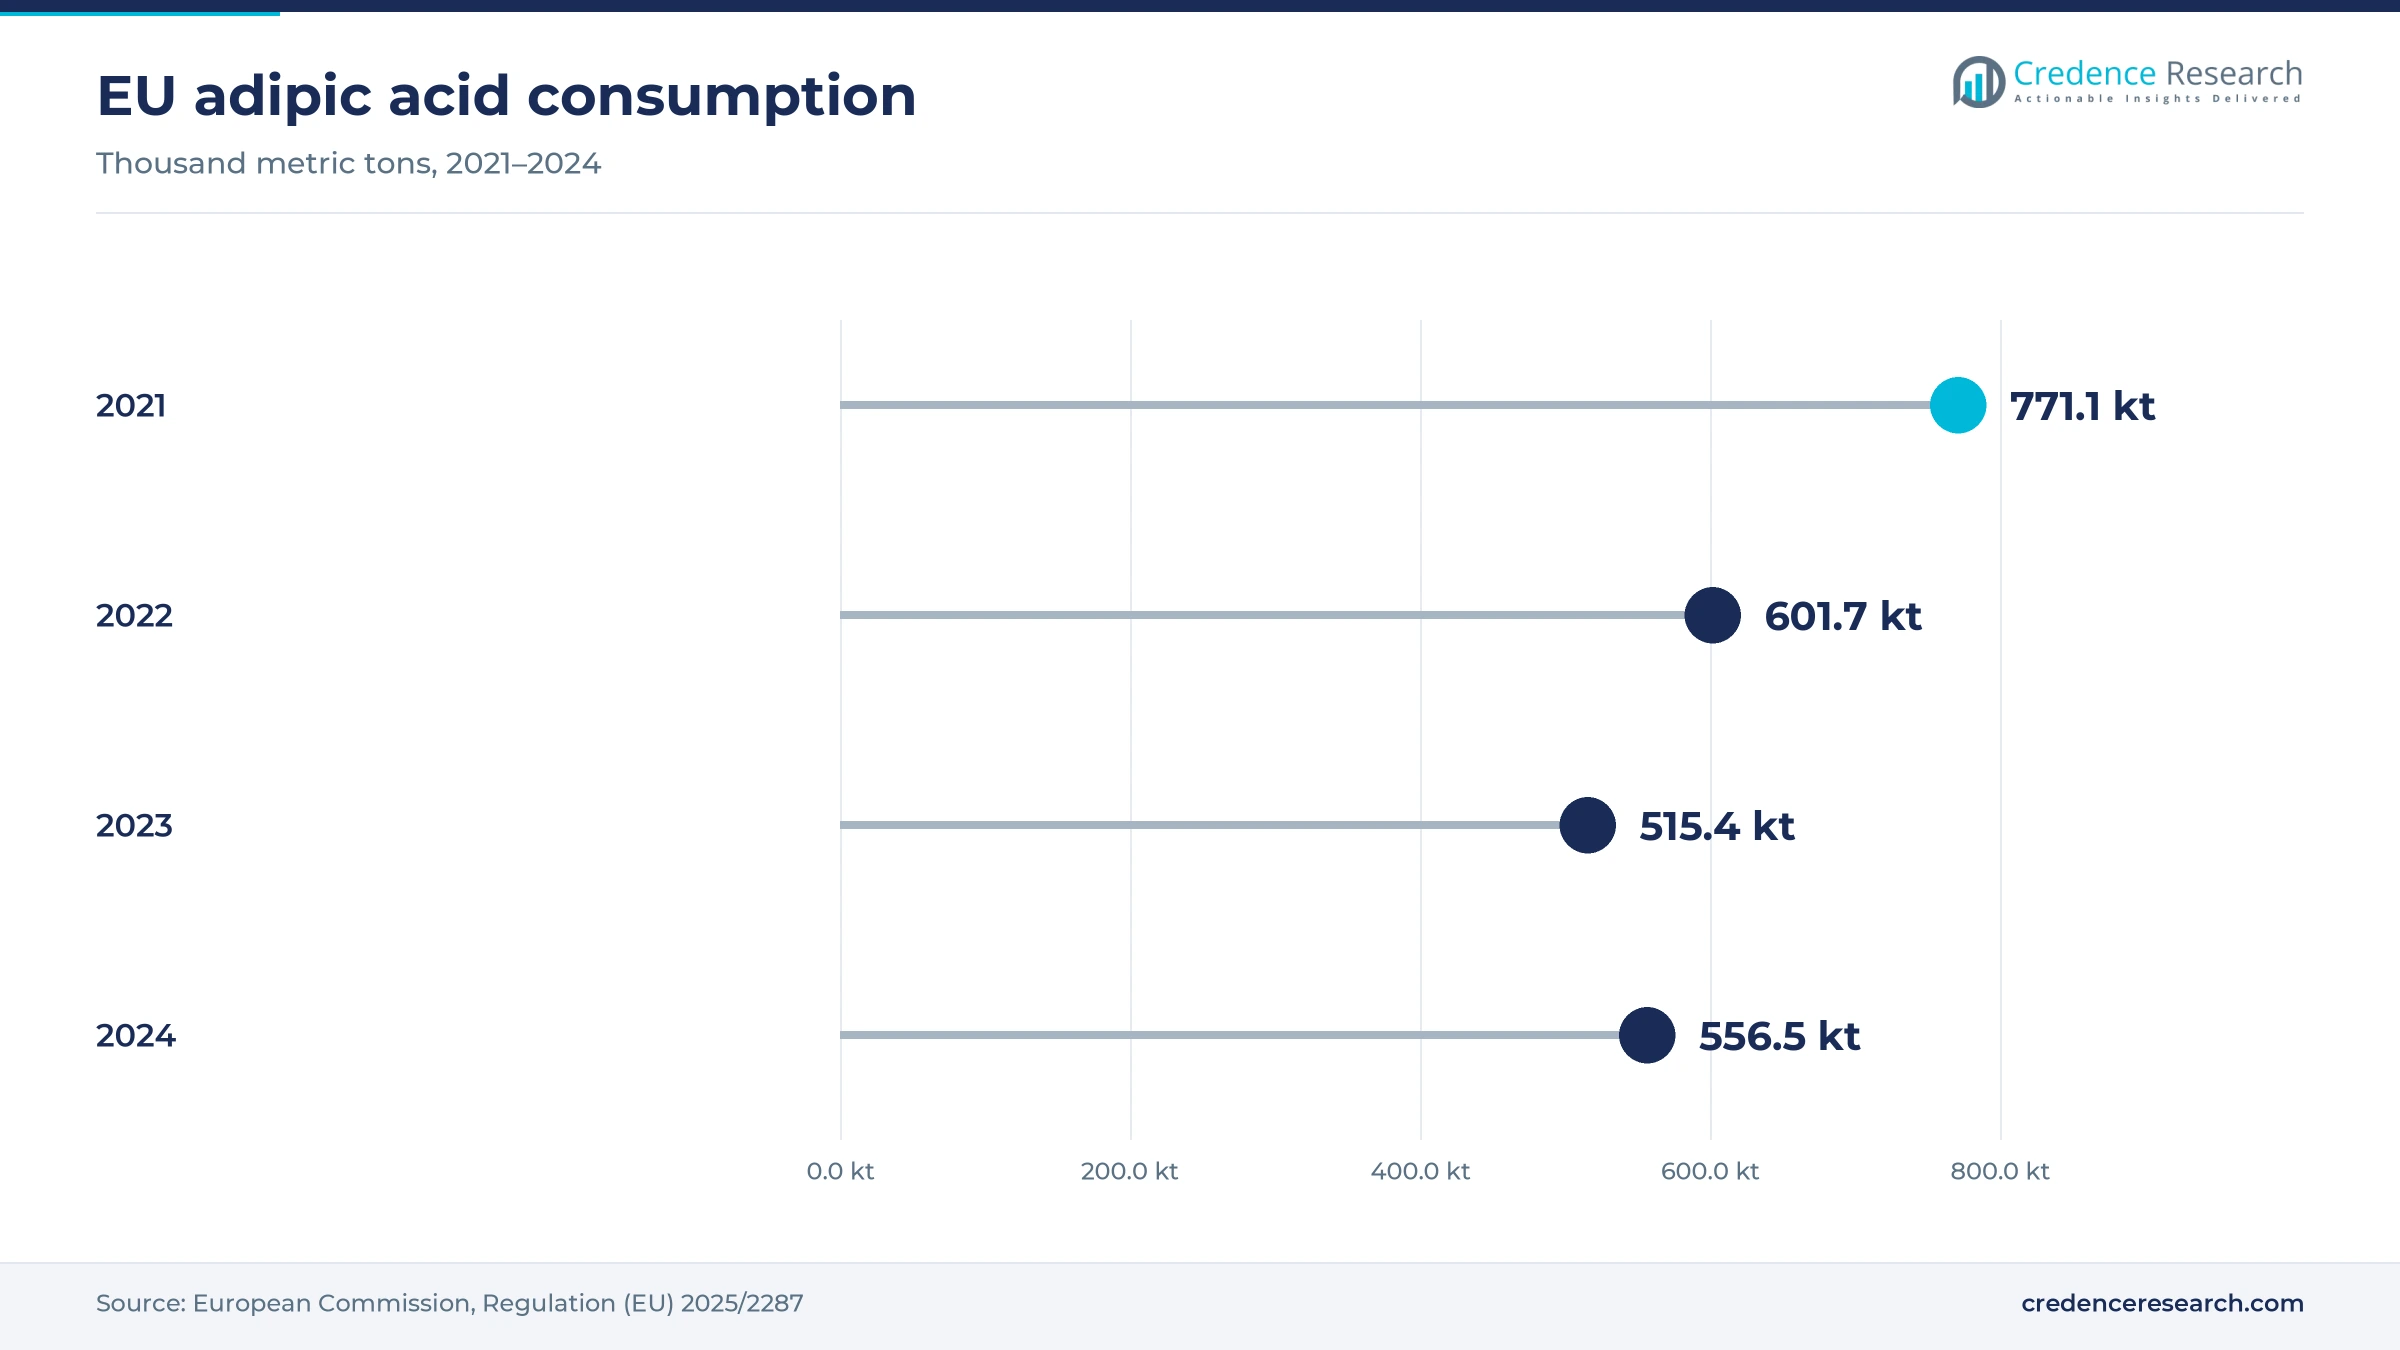
- EU adipic acid consumption fell from 771,080 metric tons in 2021 to 556,461 metric tons in 2024, according to the European Commission.
- Toray and PTT Global Chemical established a cassava-based route to bio-based adipic acid in May 2026, with fermentation validated at pilot scale.
Polyurethanes lead while nylon resin grows fastest
Why does synthetic acid still hold almost all supply?
Based on type, the market is categorized into synthetic adipic acid and bio-based adipic acid. Synthetic Adipic Acid led with 98.6% of 2025 value because nearly all commercial output comes from nitric acid oxidation plants worldwide, such as INVISTA's two units at Victoria, Texas and the 742,145 metric tons of EU capacity that the European Commission recorded for 2024. Bio-Based Adipic Acid grows fastest at 14.2% a year, as INVISTA received ISCC PLUS mass-balance certification for adipic acid in 2024, and Toray and PTT Global Chemical have a cassava-based route at pilot scale. Brand programs gain a certified route, while bulk buyers stay with synthetic acid.
Why do polyurethanes lead adipic acid use?
Based on application, the market is categorized into nylon 6,6 fiber, nylon 6,6 resin, polyurethanes, adipate esters and others. Polyurethanes led with 31.0% of 2025 value because polyester polyols for shoe soles, synthetic leather and coatings take most Chinese output, and the European Commission names polyester polyols and nylon 66 as the two main uses. Nylon 6,6 Resin grows fastest at 5.9% a year, as Chinese new-energy vehicle output rose 29% in 2025 and parts makers replace metal with engineering plastics in housings and connectors. Resin compounders near Asian vehicle plants gain, while fiber makers depend on slower apparel demand.
Why do vehicle makers anchor adipic acid demand?
Based on end user, the market is categorized into automotive, textiles, packaging, electronics and others. Automotive led with 30.0% of 2025 value because nylon 6,6 goes into engine covers, connectors and airbag fabric, and OICA counted 59.2 million vehicles built in Asia-Pacific in 2025, up 7.6%. Packaging grows fastest at 6.4% a year, as PBAT film, a biodegradable polyester made with adipic acid, gains export demand, with Chinese PBAT exports passing 20,000 metric tons in May 2026, according to Mysteel. Film makers gain volume, while automotive demand still rises and falls with vehicle production cycles.
| Segment Group | Leading Sub-segment | Share, 2025 | Fastest-growing Sub-segment | CAGR, 2026–2035 |
|---|---|---|---|---|
| By Type | Synthetic Adipic Acid | 98.6% | Bio-Based Adipic Acid | 14.2% |
| By Application | Polyurethanes | 31.0% | Nylon 6,6 Resin | 5.9% |
| By End User | Automotive | 30.0% | Packaging | 6.4% |
Chinese spot prices set the global floor
Adipic acid trades on monthly and quarterly contracts linked to benzene and cyclohexane costs, while Chinese spot sales set the floor for export offers across Asia. Trade rules widen the regional spread, since EU producers sold at EUR 1,500 to 1,800 per metric ton in 2024 while Chinese material landed well below that before duties. Nitric acid, energy and nitrous oxide abatement add cost to every metric ton, and those costs weigh more on plants outside China. Makers of non-phthalate plasticizers and polyols feel price moves first, because the acid is a large part of their raw material bill and their own selling prices adjust more slowly.
| Offer or region | Typical price or fee | Basis |
|---|---|---|
| Adipic acid, China ex-works | USD 1,520 per metric ton | Published price list, April 2026 |
| Adipic acid, U.S. export FOB | USD 1,470 per metric ton | Published price list, April 2026 |
| Chinese imports into the EU, average | EUR 1,251 per metric ton | European Commission, 2024 |
| EU producer free-market sales | EUR 1,500-1,800 per metric ton | European Commission, 2024 |
Request a Free Sample
Fill in your details and we'll send you a free sample report.
- Sample data tables & charts
- Research methodology
Polyols, vehicles and emission rules lift demand
Chinese polyurethane chains absorb most output
Polyurethane makers in China are the largest single outlet for adipic acid, because polyester polyols for shoe soles, synthetic leather, coatings and thermoplastic polyurethane all use it as the acid component. The European Commission lists polyester polyols, polyurethanes, adhesives, sealants, plasticizers and lubricants next to nylon 6,6 among its downstream uses. Huafon Chemical, a leading spandex and polyurethane resin maker, disclosed in December 2024 that its phase VI line had started production, lifting its Chongqing capacity to 1.2 million metric tons a year. Polyurethanes are the largest application by Credence Research estimates, ahead of either nylon 6,6 application on its own. Integrated polyurethane producers gain secure supply, while independent acid sellers face buyers that can switch suppliers quickly.
Vehicle electrification lifts nylon 6,6 resin use
Automakers mold nylon 6,6 into under-hood parts, air-intake systems and electrical connectors, so each vehicle built adds adipic acid demand through the polyamide chain. World vehicle output reached 96.4 million units in 2025, up 3.9%, and China built 34.53 million of them, according to OICA. New-energy vehicle production in China reached 16.626 million, and electric models add high-voltage connectors and battery components that are often molded in polyamide. Nylon 6,6 resin is the fastest-growing application by Credence Research estimates, with most of the gain at Asian plants that build the bulk of world vehicles. Resin compounders serving Asian automakers gain the most, while fiber-focused producers see less benefit.
Nitrous oxide rules reward plants with abatement
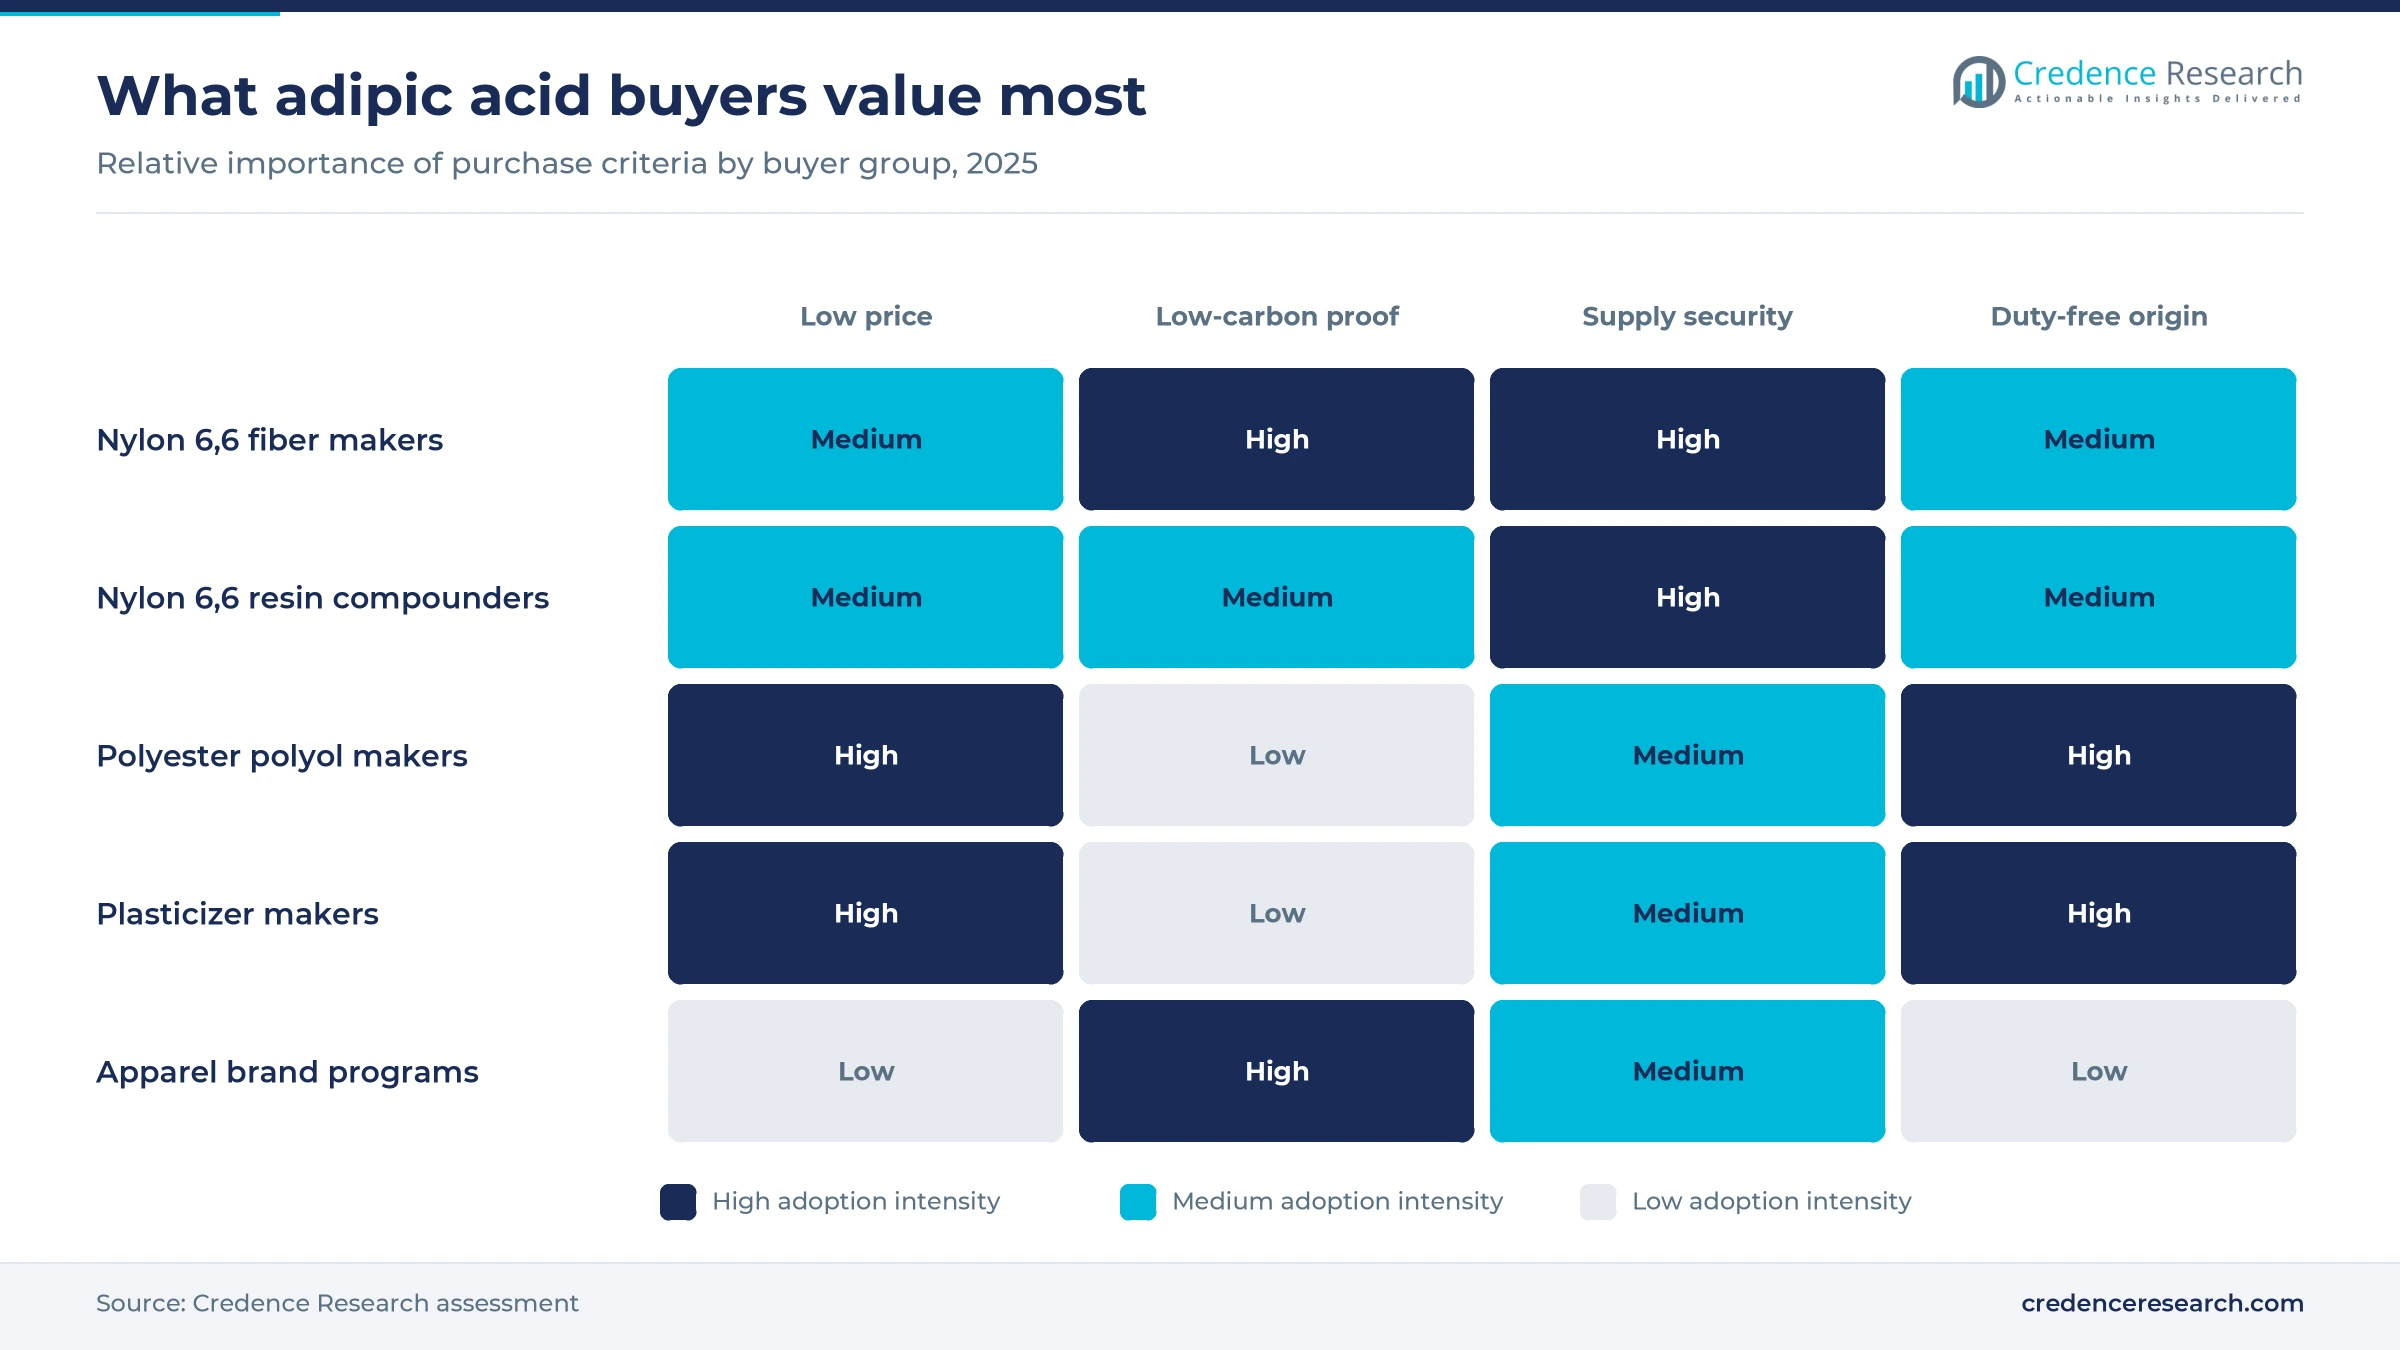
Nitric acid oxidation releases nitrous oxide, a gas almost 273 times as potent as carbon dioxide, so emission rules now shape which plants buyers prefer. Global Efficiency Intelligence estimates that Chinese plants emitted about 134 million metric tons of CO2 equivalent in 2021, against 8.5 million metric tons in the rest of the world, which puts Chinese lines at the center of any tighter rule. INVISTA said in February 2024 that two new projects would lift abatement at its Victoria, Texas, site above 98% and remove more than 500,000 metric tons of CO2 equivalent a year. Producers that already abate gain an edge with automakers and apparel brands that report supply chain emissions, while unabated Chinese lines face retrofit costs.
Chinese price recovery lifts market value in 2026
Market value depends as much on the acid price as on tonnage, and Chinese prices moved higher through 2026 after a weak 2025. Published price listings put the Chinese ex-works price 48% above its April 2025 level in April 2026, while U.S. export prices fell 17% over the same period. In Europe, the Commission recorded Chinese imports at an average EUR 1,251 per metric ton in 2024, against EU producer prices of EUR 1,500 to 1,800, a gap that the duties now narrow. The published sources do not explain the Chinese rebound, so Credence Research treats it as cyclical rather than structural. The recovery lifts Chinese producer margins, while Asian buyers on floating contracts carry the higher cost in the region most exposed to that swing.
Trade defense and bio routes reshape supply
Western capacity is shifting toward Chinese scale
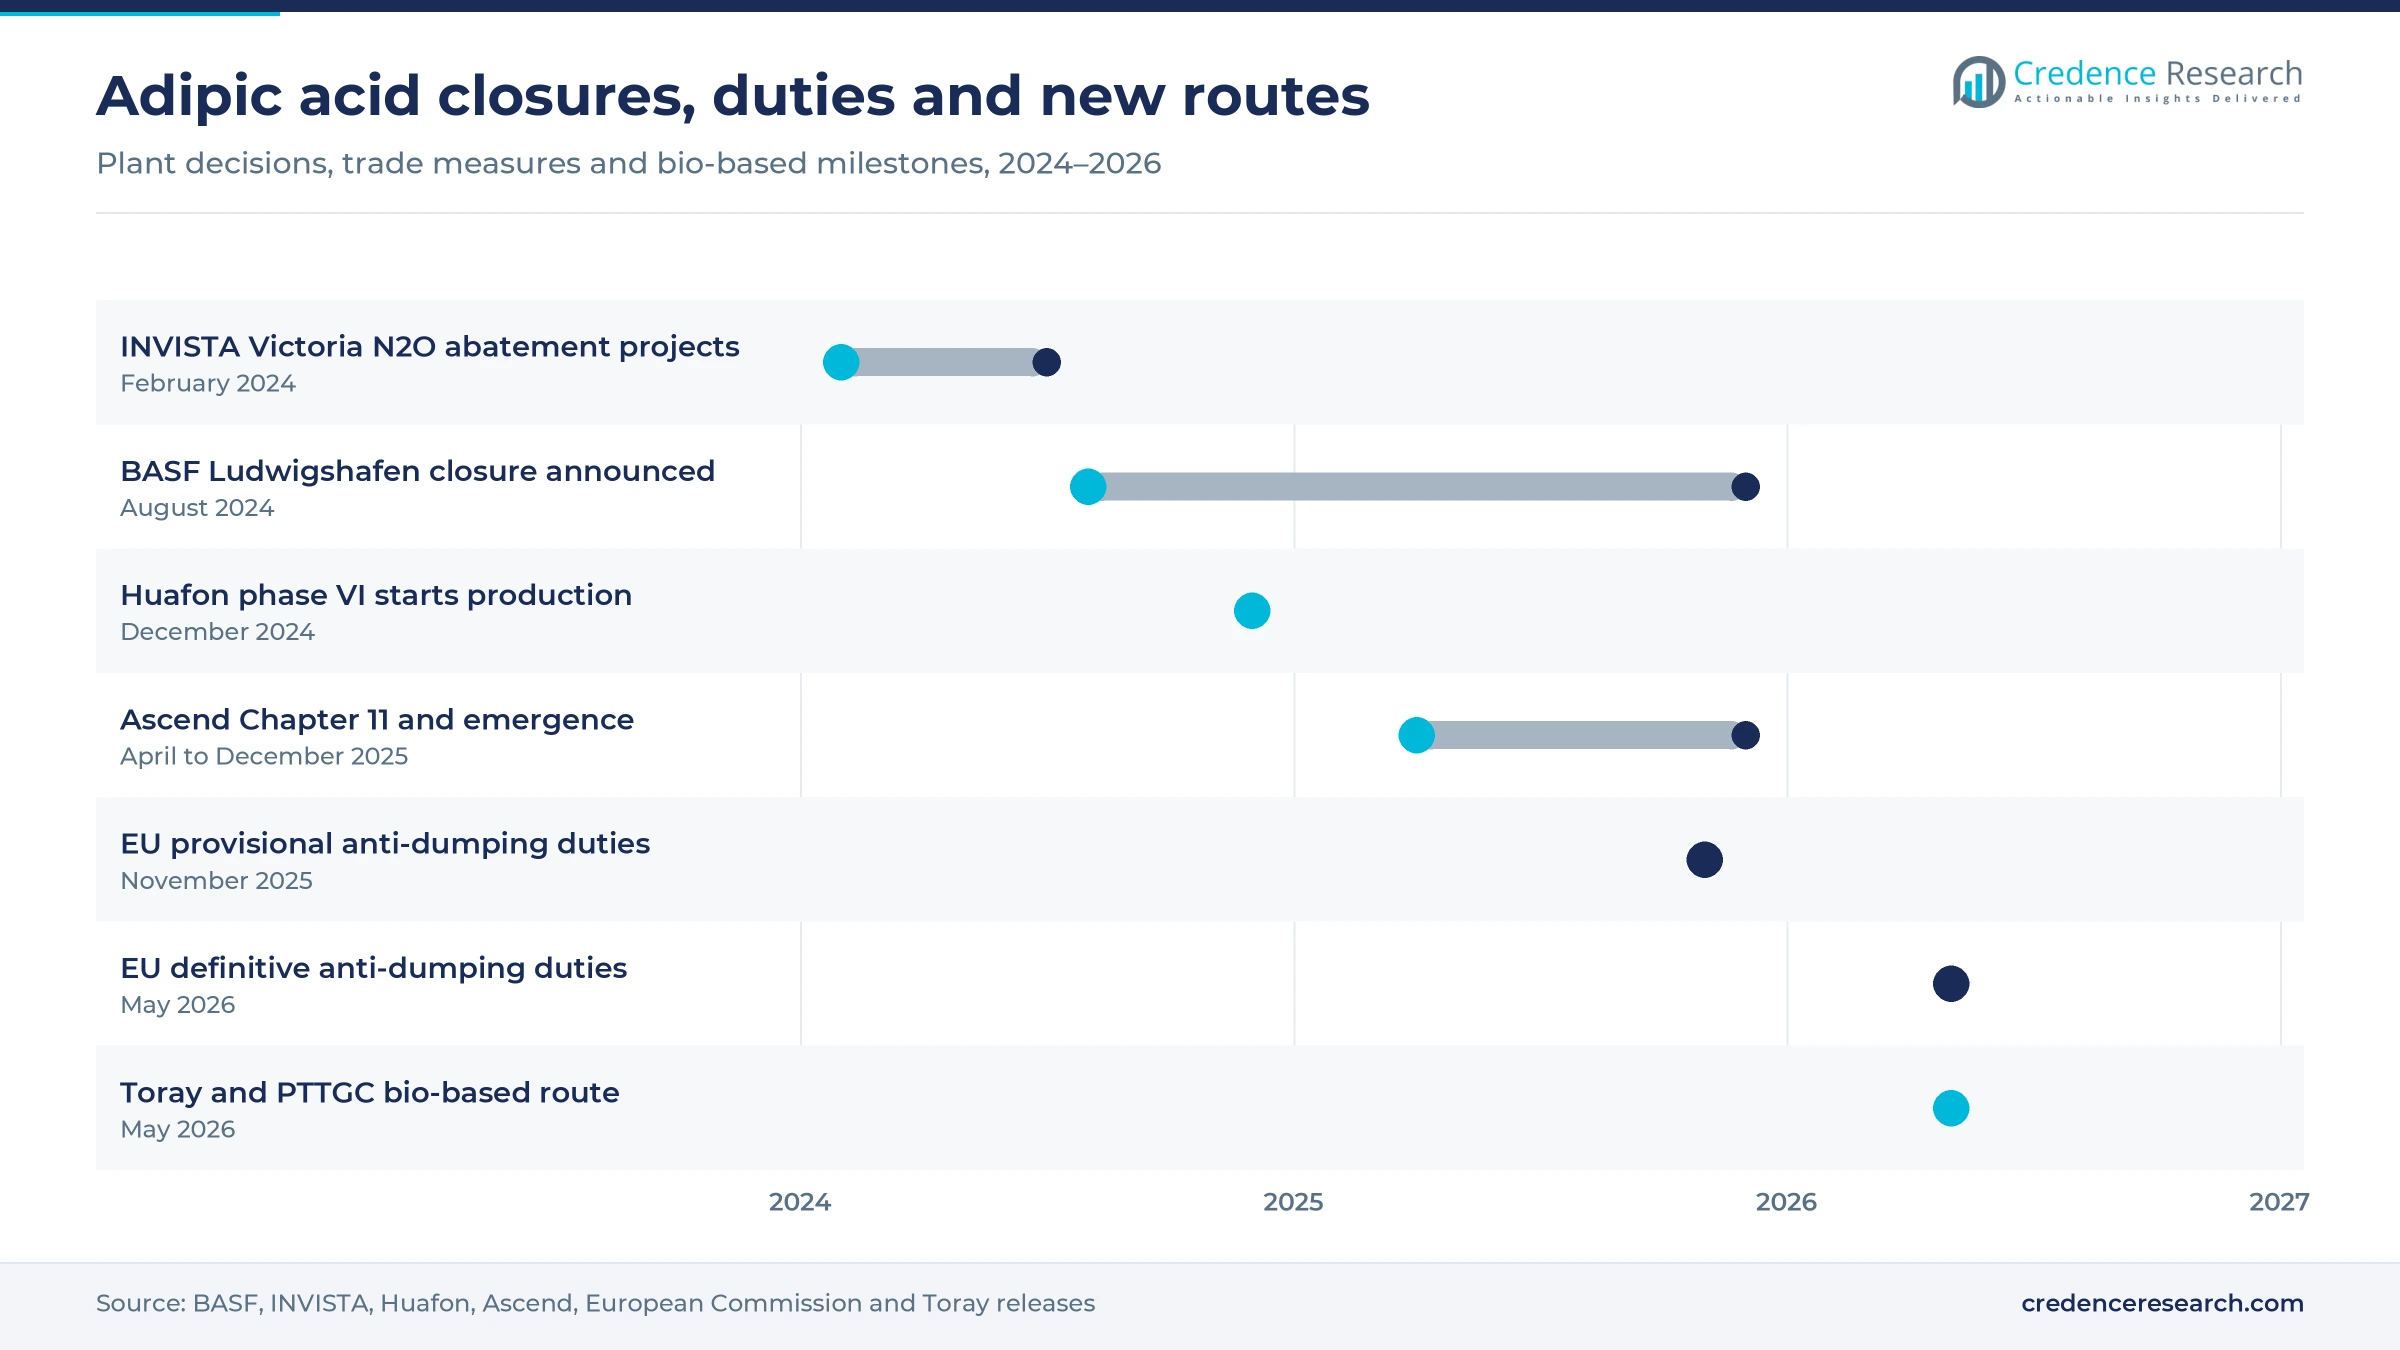
Adipic acid production is shifting from older European sites toward large integrated plants in China, which changes where buyers source and how far material travels. BASF said in an Aug. 29, 2024, release that it would close its remaining adipic acid production in Ludwigshafen during 2025, affecting about 180 employees, while keeping output in Onsan, South Korea and at its Chalampé joint venture in France. Huafon's Chongqing complex alone now exceeds the combined EU capacity of 742,145 metric tons that the European Commission recorded for 2024. Domo Chemicals' three German units, which make polyamide and engineering plastics, filed for insolvency in December 2025, citing polyamide resin imports from China. European converters gain cheaper inputs, but they lose nearby suppliers and short delivery times.
European trade defense is shifting import sourcing
European buyers are shifting away from Chinese adipic acid as anti-dumping duties raise landed costs, which creates openings for EU producers and non-Chinese exporters. The European Commission set provisional duties in November 2025 on Chongqing Huafon, Tangshan Zhonghao and other exporters, after LANXESS and Radici Chimica filed the complaint. Chinese material had reached 35.6% of the EU free market in 2024, sold well below the prices of EU producers. The definitive duties that the Commission announced on May 5, 2026, range from 29.1% to 42.3%, and China supplies most of the EU import bill by value. Polyol and nylon makers that bought on Chinese price now pay more, while South Korean and U.S. suppliers gain a hearing.
Bio-based acid for nylon apparel is an opening
Apparel and textile brands seeking fossil-free nylon 6,6 are an underserved customer group for bio-based adipic acid, because no commercial plant yet supplies it at scale. Toray and PTT Global Chemical said in late May 2026 that they had established a process from cassava pulp, a starch residue, through bio-muconic acid to adipic acid pure enough for nylon 66. Their saccharification step ran at 5 dry tons of glucose a day. Toray had first reported a sugar-derived adipic acid in August 2022, with a commercialization target of around 2030. Producers able to supply certified bio-based acid can sell to brands at a premium, although no public price for bio-based adipic acid exists yet.
Certified low-carbon acid for automakers is an opening
Automakers and their resin suppliers are an opening for certified low-carbon adipic acid, because nylon 6,6 parts are a main source of the nitrous oxide embodied in a car, according to Global Efficiency Intelligence. The same group estimates that high-level abatement costs less than USD 0.50 per metric ton of CO2 equivalent and adds about USD 0.40 per vehicle. INVISTA's Victoria site was first certified under ISCC PLUS in 2024 and is seeking recertification for adipic acid under bio, circular, bio-circular and renewable categories. Bio-based adipic acid, which includes such mass-balance grades, grows at 14.2% a year by Credence Research estimates. Suppliers that document both feedstock and abatement can win brand programs, while uncertified volume competes on price alone.
Overcapacity and weak European demand restrain value
Chinese overcapacity holds down operating rates
Chinese surplus output caps prices outside China, because exporters move volume into any market that lacks duties. The European Commission found that Chinese material rose from 19.4% of the EU free market in 2021 to 35.6% in 2024, before duties were imposed. Producers in Europe, North America, Japan and South Korea are most exposed when Chinese exporters redirect surplus into Southeast Asia and other open markets. Buyers in those markets gain lower prices, while local producers lose share and margin.
European demand and plant use have contracted
European demand has fallen sharply, which leaves regional plants underused and raises unit costs. The European Commission recorded EU consumption of 556,461 metric tons in 2024, down from 771,080 metric tons in 2021, while industry capacity use dropped from 82% to 60%. About 60% of EU production goes to captive use inside integrated nylon and polyol chains, so merchant sellers carry most of the volume risk. Independent European polyol and plasticizer makers are most exposed if duties fail to restore prices.
Bio-based routes remain at pilot scale
Bio-based adipic acid has not reached commercial volume, so buyers cannot yet contract for it in tonnage quantities. The Toray and PTT Global Chemical fermentation was validated only up to a pilot fermenter of about 50 cubic meters, and nylon polymerization remains at laboratory scale. No published cost per metric ton exists for any bio-based route, which Credence Research flags as an evidence gap. At about USD 74 million in 2025, bio-based value stays small, and apparel brands are most exposed to scale-up delays.
Financial strain at Western producers adds supply risk
Weak margins have pushed Western producers into restructuring, which raises supply risk for customers that rely on one source. Ascend Performance Materials filed for Chapter 11 on April 21, 2025, and emerged on Dec. 19, 2025, under a new ownership group, with its adipic acid and nylon operations continuing. U.S. nylon and polyol buyers with single-source contracts are most exposed if another producer restructures. Domestic supply rests on two integrated producers, so any outage shifts buyers toward imports.
Asia Pacific leads on Chinese capacity
| Region | Value, 2025 (USD billion) | Share, 2025 | CAGR, 2026–2035 |
|---|---|---|---|
| Asia Pacific | 2.37 | 44.7% | 5.8% |
| North America | 1.22 | 23.0% | 4.8% |
| Europe | 1.06 | 20.0% | 4.2% |
| Latin America | 0.37 | 7.0% | 5.3% |
| Middle East & Africa | 0.28 | 5.3% | 5.5% |
Asia Pacific leads on Chinese capacity
Asia Pacific held 44.7% of 2025 value and is the fastest-growing region at 5.8% a year, because China hosts most world capacity and the largest polyurethane and PBAT chains. Asahi Kasei describes itself as Asia's only adipic acid producer with two production bases, at Nobeoka in Japan and in South Korea through consignment, and BASF keeps its Onsan plant. Huafon and Tangshan Zhonghao, the two Chinese exporters sampled in the EU duty case, lead merchant supply with Henan Shenma. Credence Research puts China at about 70% of regional value, with Japan, South Korea, India and Southeast Asia sharing the rest.
North America relies on two integrated producers
North America held 23.0% of 2025 value and grows at 4.8% a year, with two large integrated producers serving nylon 6,6 and polyol demand. INVISTA runs two adipic acid units at Victoria, Texas and Ascend makes adipic acid for its own nylon chain and for merchant sales. Lower U.S. export prices in 2026, noted above, squeeze merchant margins. Credence Research puts the U.S. at about 88% of regional value, with Canada and Mexico buying mainly for vehicle parts and coatings.
Europe defends a shrinking base behind duties
Europe held 20.0% of 2025 value and grows at 4.2% a year, the slowest rate, because regional consumption has contracted and the BASF Ludwigshafen line has been scheduled for closure. Remaining producers in Germany, France and Italy, including LANXESS, Radici Chimica and the Chalampé joint venture, employ more than 1,100 people, according to the European Commission. The duties described above give them room to raise prices. European vehicle output fell 0.8% in 2025, according to OICA, which limits nylon resin demand in the region.
Latin America depends on imported acid
Latin America held 7.0% of 2025 value and grows at 5.3% a year, with demand from footwear soles, coatings and vehicle parts in Brazil and Mexico. Vehicle output in the Americas fell 2.1% in 2025, according to OICA, which slows nylon resin demand at Brazilian and Mexican parts plants. Credence Research could not verify current adipic acid output in the region, so this estimate rests on import and downstream data. Buyers depend on U.S. and Asian supply and pay freight on every contract.
Middle East and Africa remains import-led
Middle East & Africa held 5.3% of 2025 value and grows at 5.5% a year from the smallest base, with demand from polyurethane systems, coatings and plasticizers in the Gulf states and South Africa. Credence Research found no verified adipic acid plant in the region, so buyers import from China, South Korea and Europe. No public statistic separates adipic acid consumption by country, which remains an evidence gap. Distributors holding local stock win most orders, because regional buyers purchase in small lots.
Closures, duties and bio routes marked 2024 to 2026
| Development | Status and market relevance |
|---|---|
| In August 2024, BASF announced that it would close its remaining adipic acid production in Ludwigshafen during 2025, while keeping output in Onsan and at its Chalampé joint venture. | Announced closure scheduled for 2025; about 180 employees affected and supply continues from other sites. |
| In December 2024, Huafon Chemical started production on the phase VI expansion of its Chongqing adipic acid complex, bringing capacity to 1.2 million metric tons a year. | Operational launch; the added volume enters Chinese and export markets. |
| In December 2025, Ascend Performance Materials emerged from Chapter 11 after filing in April 2025, with operations continuing under new ownership. | Completed restructuring; a new ownership group took control. |
| In May 2026, the European Commission imposed definitive anti-dumping duties of 29.1% to 42.3% on adipic acid from China, after provisional duties from November 2025. | Approved definitive measure; it applies to imports into the EU. |
| In May 2026, Toray and PTT Global Chemical announced a complete manufacturing route for bio-based adipic acid from cassava pulp, with pilot-scale fermentation. | Testing milestone at pilot scale; textile sales of fully bio-based nylon 66 are targeted by fiscal 2028. |
Nitric acid oxidation still makes almost all supply
- KA oil oxidation converts a cyclohexanol and cyclohexanone mix with nitric acid and remains the route for almost all synthetic acid.
- Nitrous oxide abatement destroys the N2O in the off-gas with catalytic or thermal units and decides whether a plant can sell low-carbon grades.
- Fermentation routes turn plant sugars into bio-muconic acid, which is then converted chemically into adipic acid of polymer grade.
- Mass-balance certification assigns bio or circular feedstock to a share of output from conventional plants under schemes such as ISCC PLUS.
Need a Custom Version of This Report?
Tailor the scope, geography, or segments to your exact requirements.
- Custom geography or segment scope
- Direct access to our analyst team
Integrated nylon makers face Chinese merchant scale
Competition splits between integrated Western and Japanese producers that use most of their acid in nylon 6,6 and Chinese producers that sell into polyurethane, PBAT and export markets. INVISTA, Ascend and BASF compete on integration and long-term supply to nylon resin and fiber customers, while Asahi Kasei supplies the Japanese and Korean nylon chain. Chongqing Huafon, Henan Shenma, Hualu Hengsheng and Tangshan Zhonghao compete on scale and price. LANXESS and Radici Chimica defend European share behind anti-dumping duties. Abatement records, mass-balance certificates and duty-free origin now matter alongside price in large contracts. Toray and PTT Global Chemical are not yet sellers, but their bio-based route could give apparel buyers a new source later in the decade. Buyers in Europe and the U.S. also weigh supplier finances more closely since the Ascend restructuring.
Nylon integration keeps merchant acid sellers exposed
Supply sits with about a dozen producer groups running plants in China, the U.S., Europe, Japan and South Korea, and the largest Chinese sites now exceed whole regional capacities elsewhere. Integration is the main barrier, since INVISTA, Ascend, BASF and Asahi Kasei consume much of their own acid in nylon 6,6, while Chinese producers such as Huafon tie it to polyurethane and spandex. Nitric acid units, N2O abatement and secure access to cyclohexane raise capital needs for new entrants. Margins sit mainly downstream in polymer and compound sales, so merchant acid sellers absorb most of the price cycle.
Companies profiled and their roles in this market
| Company | Type | Role in the market |
|---|---|---|
| INVISTA (Koch Industries, Inc.) | Integrated producer | Adipic acid at Victoria, Texas, with ISCC PLUS certified grades |
| Ascend Performance Materials | Integrated producer | U.S. adipic acid for its nylon 6,6 chain and merchant sales |
| BASF SE | Integrated producer | Adipic acid from Onsan, South Korea and the Chalampé joint venture |
| Chongqing Huafon Chemical Co., Ltd. (Huafon Chemical) | Volume producer | Chongqing adipic acid complex with 1.2 million metric tons of yearly capacity |
| Henan Shenma Nylon Chemical Co., Ltd. (China Pingmei Shenma Group) | Integrated producer | Chinese adipic acid for its own nylon 6,6 salt and resin |
| Shandong Hualu Hengsheng Chemical Co., Ltd. | Volume producer | Shandong adipic acid sold to polyurethane and polyol makers |
| Tangshan Zhonghao Chemical Co., Ltd. | Volume producer | Chinese adipic acid exporter named in the EU duty case |
| Asahi Kasei Corporation | Integrated producer | Adipic acid at Nobeoka, Japan and in South Korea for nylon 66 |
| LANXESS AG | Specialist | European adipic acid producer and complainant in the EU duty case |
| RadiciGroup (Radici Chimica S.p.A.) | Integrated producer | Adipic acid at Novara, Italy, for its polyamide 6.6 chain |
Value follows abatement records and origin
Credence Research's view is that adipic acid value will follow abatement records and trade origin as much as tonnage, even though polyurethanes keep 31.0% of 2025 value. Chinese plants will keep setting the floor price, so producers elsewhere need integration, duty protection or certified low-carbon grades to hold margins. The 2026 price recovery in China lifts value but has no published cause, so buyers should not treat it as permanent. Bio-based acid is a real but distant opening, since commercial volume depends on pilot routes reaching scale near the end of the decade.
Estimates rest on trade cases and price build-up
The report uses 2025 as the base year and forecasts to 2035. The earlier Credence Research estimate was replaced with a new 2025 value built from production volume and regional prices, because acid prices fell sharply after 2022 and left the earlier value too high; the earlier growth rate was kept. Regional shares, segment splits and the bio-based share are Credence Research estimates. Sources include European Commission trade investigations, company releases, OICA production statistics and published price listings; no interviews or surveys are claimed.
Asian polyurethane and nylon resin carry growth
Nylon 6,6 Resin should keep growing at 5.9% a year to 2035, the fastest application rate in adipic acid demand. The market should reach USD 8.82 billion by 2035, with polyurethanes still the largest application and Asia Pacific the largest region. Growth through 2027 depends on Chinese operating rates, whether the 2026 price recovery holds and whether China tightens N2O rules for adipic acid plants. Western supply should keep consolidating around integrated sites, while bio-based grades move from pilot to first commercial sales. These projections are modeled estimates and would shift with prices and trade decisions.
Chinese run rates and the 2026 price rebound set the range
The range depends mainly on Chinese operating rates, the durability of the 2026 price recovery and the pace of vehicle and polyurethane demand in Asia. A return to 2025 price levels would cut value even with steady volume, while tighter N2O rules in China could retire unabated lines and support prices. Faster scale-up of bio-based and certified grades is a smaller upside, because they start from a small base.
| Scenario | CAGR, 2026–2035 | Value, 2035 | What has to hold |
|---|---|---|---|
| Downside | 3.7% | USD 7.75 billion | Chinese prices fall back to 2025 levels and European demand keeps shrinking |
| Base | 5.20% | USD 8.82 billion | Steady polyurethane use, moderate vehicle growth and stable trade remedies |
| Upside | 6.4% | USD 9.76 billion | N2O rules retire unabated Chinese lines and bio-based nylon reaches commercial scale |
Frequently Asked Questions
How big is the synthetic and bio-based adipic acid market?
How large is the bio-based adipic acid market?
Which application uses the most adipic acid?
Who are the leading adipic acid producers?
Why did the EU impose duties on Chinese adipic acid?
Which region leads the adipic acid market?
Why does adipic acid production matter for climate rules?
Is bio-based nylon 66 commercially available?
Table of Content
Chapter 1 Market Segmentation
- 1.1 Segmentation Framework
- 1.1.1 Product and Service Classification
- 1.1.2 Application and End-Use Classification
- 1.1.3 Technology and Solution Classification
- 1.1.4 Customer and Distribution Channel Classification
- 1.1.5 Geographic Segmentation
- 1.1.6 Market Segment Definitions and Boundaries
- 1.2 By Type
- 1.2.1 Synthetic Adipic Acid
- 1.2.2 Bio-Based Adipic Acid
- 1.3 By Application
- 1.3.1 Polyurethanes
- 1.3.2 Nylon 6,6 Resin
- 1.3.3 Nylon 6,6 Fiber
- 1.3.4 Adipate Esters
- 1.3.5 Others
- 1.4 By End User
- 1.4.1 Automotive
- 1.4.2 Textiles
- 1.4.3 Electronics
- 1.4.4 Packaging
- 1.4.5 Others
Chapter 2 Introduction
- 2.1 Report Objectives and Scope
- 2.2 Product Definition and Industry Terminology
- 2.3 Market Inclusions and Exclusions
- 2.4 Research Process
- 2.4.1 Primary Research and Expert Interviews
- 2.4.2 Secondary Research and Source Review
- 2.4.3 Top-Down and Bottom-Up Estimation
- 2.4.4 Data Triangulation and Verification
- 2.5 Market Size Measurement Basis
- 2.5.1 2025: USD 5.31 billion → 2035: USD 8.82 billion
- 2.6 Historical and Forecast Reference Periods
- 2.6.1 Historical Period: 2018-2025
- 2.6.2 Base Year: 2025
- 2.6.3 Forecast Period: 2025-2035
- 2.7 Research Assumptions and Limitations
Chapter 3 Executive Summary
- 3.1 Market Snapshot and Key Findings
- 3.2 Base-Year Market Size, 2025
- 3.3 Forecast Market Size, 2035
- 3.4 Revenue and Volume Growth Outlook
- 3.5 Key Demand and Supply Indicators
- 3.6 Leading Market Segments
- 3.7 Fastest-Growing Market Opportunities
- 3.8 Regional Performance Highlights
- 3.9 Technology and Industry Transformation
- 3.10 Competitive Landscape Summary
- 3.11 Analyst View and Strategic Implications
Chapter 4 Global Synthetic and Bio-Based Adipic Acid Market Trends and Developments
- 4.1 Historical Industry Development, 2018-2025
- 4.2 Recent Market Trends and Developments
- 4.3 Demand and Customer Behavior Trends
- 4.4 Technology and Product Innovation
- 4.5 Artificial Intelligence, Automation and Digitalization
- 4.6 Local Manufacturing and Supply Chain Realignment
- 4.7 Industry Partnerships, Mergers and Acquisitions
- 4.8 Sustainability and Circular Economy Developments
- 4.9 Government and Private Sector Investment Trends
- 4.10 Emerging Business Models and Commercialization
- 4.11 Industry Developments and Announcements
Chapter 5 Global Synthetic and Bio-Based Adipic Acid Market Production, Supply and Demand Analysis
- 5.1 Demand Trend and Consumption Analysis, 2018-2025
- 5.2 Demand Forecast, 2025-2035
- 5.3 Production and Output Trend, 2018-2025
- 5.4 Production and Output Forecast, 2025-2035
- 5.5 Installed Capacity and Capacity Utilization
- 5.6 Company-Wise Production Plants and Statistics
- 5.6.1 Installed Production Capacity
- 5.6.2 Actual Production
- 5.6.3 Planned Capacity and Expansion Targets
- 5.7 Supply Chain Structure and Procurement Trends
- 5.8 Supply-Demand Gap and Bottlenecks
- 5.9 Import Dependence and Sourcing Structure
- 5.10 Contract Manufacturing and Outsourcing
- 5.11 Regional Supply and Demand Concentration
Chapter 6 Global Synthetic and Bio-Based Adipic Acid Market Pricing Analysis
- 6.1 Pricing Structure and Measurement
- 6.2 Historical Pricing Trends, 2018-2025
- 6.3 Pricing Outlook, 2025-2035
- 6.4 Average Selling Price and Unit Economics
- 6.5 Pricing by Product and Market Segment
- 6.6 Geographic Pricing Differences
- 6.7 Key Input, Energy, Labor and Logistics Costs
- 6.8 Contract Pricing and Purchasing Models
- 6.9 Pricing Sensitivity and Competitive Positioning
- 6.10 Price, Margin and Profitability Implications
Chapter 7 Global Synthetic and Bio-Based Adipic Acid Market Dynamics
- 7.1 Market Growth Drivers
- 7.1.1 Demand-Side Drivers
- 7.1.2 Technology and Innovation Drivers
- 7.1.3 Infrastructure and Investment Drivers
- 7.1.4 Regulatory and Policy Drivers
- 7.2 Market Restraints
- 7.2.1 Cost and Affordability Constraints
- 7.2.2 Technology and Adoption Barriers
- 7.2.3 Supply Chain and Operational Constraints
- 7.3 Market Challenges
- 7.3.1 Competitive Pressure and Margin Erosion
- 7.3.2 Skills, Infrastructure and Implementation Gaps
- 7.4 Emerging Market Opportunities
- 7.5 Market Dynamics Impact and Time-Horizon Assessment
Chapter 8 Global Synthetic and Bio-Based Adipic Acid Value Chain Analysis
- 8.1 Industry Value Chain Overview
- 8.2 Upstream Suppliers and Critical Inputs
- 8.3 Technology and Component Providers
- 8.4 Manufacturing or Service Delivery
- 8.5 Distribution, Channel Partners and Integrators
- 8.6 Downstream Applications and End Users
- 8.7 Value Addition and Profit Pools
- 8.8 Vertical Integration and Outsourcing
- 8.9 Supplier Concentration and Risk
- 8.10 Supply Chain Localization and Resilience
Chapter 9 Global Synthetic and Bio-Based Adipic Acid Market Regulations and Policies
- 9.1 Relevant Laws, Standards and Compliance Frameworks
- 9.2 Product, Service, Safety and Quality Requirements
- 9.3 Government Policies, Incentives and Subsidies
- 9.4 Imports, Exports and Trade Barriers
- 9.5 Public Procurement and Local Content Requirements
- 9.6 Environmental and Sustainability Compliance
- 9.7 Upcoming Policy Changes and Market Implications
Chapter 10 Global Synthetic and Bio-Based Adipic Acid Market Hotspots and Opportunities
- 10.1 Market Opportunity Mapping and Growth Hotspots
- 10.2 High-Growth Applications and Customer Groups
- 10.3 Underserved Markets and White-Space Opportunities
- 10.4 Emerging Technology and Product Opportunities
- 10.5 New Capacity and Investment Hotspots
- 10.6 Market Entry and Expansion Opportunities
- 10.7 Distribution and Partnership Opportunities
- 10.8 Near-Term and Long-Term Commercial Potential
- 10.9 Opportunity Attractiveness and Execution Risks
Chapter 11 Global Synthetic and Bio-Based Adipic Acid Market Outlook, 2025-2035
- 11.1 Market Size and Analysis
- 11.1.1 Revenue (Market Measurement: 2025: USD 5.31 billion → 2035: USD 8.82 billion)
- 11.1.2 Market Volume and Quantity Sold
- 11.1.3 Historical Market Size, 2018-2025
- 11.1.4 Base-Year Market Size, 2025
- 11.2 Market Forecast, 2025-2035
- 11.2.1 Revenue Forecast to 2035
- 11.2.2 Volume Forecast to 2035
- 11.2.3 CAGR and Year-on-Year Growth
- 11.2.4 Incremental Revenue Opportunity
- 11.3 Forecast Assumptions and Scenario Analysis
- 11.3.1 Base-Case Forecast
- 11.3.2 Optimistic and Conservative Scenarios
- 11.3.3 Technology, Pricing and Policy Sensitivities
- 11.4 Market Attractiveness and Growth Outlook
Chapter 12 Global Synthetic and Bio-Based Adipic Acid Market Segmentation and Outlook
- 12.1 Segmentation Summary and Market Shares, 2025
- 12.2 Largest and Fastest-Growing Segments
- 12.3 By Type - Market Size and Forecast, 2025-2035
- 12.3.1 Segment Definition and Scope
- 12.3.2 Historical Market Size, 2018-2025
- 12.3.3 Revenue Forecast, 2025-2035
- 12.3.4 Volume Forecast, 2025-2035
- 12.3.5 Base-Year Market Share, 2025
- 12.3.6 Segment CAGR and Growth Drivers
- 12.3.7 Subsegment Market Size and Forecast
- 12.3.7.1 Synthetic Adipic Acid
- 12.3.7.2 Bio-Based Adipic Acid
- 12.3.8 Subsegment Pricing and Adoption Trends
- 12.3.9 Leading Suppliers and Competition
- 12.3.10 Regional Demand and Opportunities
- 12.4 By Application - Market Size and Forecast, 2025-2035
- 12.4.1 Segment Definition and Scope
- 12.4.2 Historical Market Size, 2018-2025
- 12.4.3 Revenue Forecast, 2025-2035
- 12.4.4 Volume Forecast, 2025-2035
- 12.4.5 Base-Year Market Share, 2025
- 12.4.6 Segment CAGR and Growth Drivers
- 12.4.7 Subsegment Market Size and Forecast
- 12.4.7.1 Polyurethanes
- 12.4.7.2 Nylon 6,6 Resin
- 12.4.7.3 Nylon 6,6 Fiber
- 12.4.7.4 Adipate Esters
- 12.4.7.5 Others
- 12.4.8 Subsegment Pricing and Adoption Trends
- 12.4.9 Leading Suppliers and Competition
- 12.4.10 Regional Demand and Opportunities
- 12.5 By End User - Market Size and Forecast, 2025-2035
- 12.5.1 Segment Definition and Scope
- 12.5.2 Historical Market Size, 2018-2025
- 12.5.3 Revenue Forecast, 2025-2035
- 12.5.4 Volume Forecast, 2025-2035
- 12.5.5 Base-Year Market Share, 2025
- 12.5.6 Segment CAGR and Growth Drivers
- 12.5.7 Subsegment Market Size and Forecast
- 12.5.7.1 Automotive
- 12.5.7.2 Textiles
- 12.5.7.3 Electronics
- 12.5.7.4 Packaging
- 12.5.7.5 Others
- 12.5.8 Subsegment Pricing and Adoption Trends
- 12.5.9 Leading Suppliers and Competition
- 12.5.10 Regional Demand and Opportunities
- 12.6 Segment Growth Comparison
- 12.7 Segment Attractiveness and Priority Matrix
Chapter 13 Global Synthetic and Bio-Based Adipic Acid End-Use and Application Market Outlook
- 13.1 End-Use Industry and Customer Demand Structure
- 13.2 Leading Applications and Customer Groups
- 13.3 End-Use Market Size, Share and Forecast
- 13.4 Major End-Use Industry Deep Dives
- 13.4.1 Customer Requirements and Use Cases
- 13.4.2 Demand and Replacement Cycles
- 13.4.3 Technical and Regulatory Considerations
- 13.4.4 Purchasing and Procurement Models
- 13.4.5 Leading Vendors and Distribution Channels
- 13.4.6 Forecast and Commercial Opportunities
- 13.5 Emerging Applications and Cross-Segment Demand
- 13.6 End-Use Industry Investment Priorities
Chapter 14 Global Synthetic and Bio-Based Adipic Acid Geographic Market Outlook, 2025-2035
- 14.1 Regional Market Size and Share, 2025
- 14.2 Regional Market Forecast, 2025-2035
- 14.3 Regional Pricing, Production and Demand Differences
- 14.4 North America
- 14.4.1 United States
- 14.4.2 Canada
- 14.4.3 Mexico
- 14.5 Europe
- 14.5.1 Germany
- 14.5.2 France
- 14.5.3 Italy
- 14.5.4 United Kingdom
- 14.5.5 Spain
- 14.5.6 Poland
- 14.5.7 Russia
- 14.5.8 Netherlands
- 14.5.9 Belgium
- 14.5.10 Sweden
- 14.5.11 Denmark
- 14.5.12 Norway
- 14.5.13 Rest of Europe
- 14.6 Asia Pacific
- 14.6.1 China
- 14.6.2 India
- 14.6.3 Japan
- 14.6.4 South Korea
- 14.6.5 Thailand
- 14.6.6 Indonesia
- 14.6.7 Vietnam
- 14.6.8 Malaysia
- 14.6.9 Australia
- 14.6.10 Rest of Asia Pacific
- 14.7 Latin America
- 14.7.1 Brazil
- 14.7.2 Argentina
- 14.7.3 Colombia
- 14.7.4 Chile
- 14.7.5 Rest of Latin America
- 14.8 Middle East
- 14.8.1 Saudi Arabia
- 14.8.2 United Arab Emirates
- 14.8.3 Turkey
- 14.8.4 Israel
- 14.8.5 Iran
- 14.8.6 Rest of the Middle East
- 14.9 Africa
- 14.9.1 South Africa
- 14.9.2 Egypt
- 14.9.3 Nigeria
- 14.9.4 Morocco
- 14.9.5 Rest of Africa
- 14.10 Regional Investment, Policy and Supply Chain Differences
- 14.11 Regional Competitive Landscape
- 14.12 Geographic Growth Hotspots
Chapter 15 Global Synthetic and Bio-Based Adipic Acid Technology, Innovation and Sustainability Outlook
- 15.1 Technology Landscape and Maturity
- 15.2 Product, Process and Service Innovation
- 15.3 AI, Automation and Digital Tools in the Industry
- 15.4 Technology Adoption and Performance Benchmarking
- 15.5 Innovation Pipeline and R&D Investment
- 15.6 Patent and Intellectual Property Trends
- 15.7 Energy Efficiency and Resource Management
- 15.8 Sustainability, Recycling and Circularity
- 15.9 Technology Roadmap, 2025-2035
- 15.10 Risks of Obsolescence and Technology Substitution
Chapter 16 Global Synthetic and Bio-Based Adipic Acid Market Key Strategic Imperatives
- 16.1 Growth and Market Entry Priorities
- 16.2 High-Return Products and Segments
- 16.3 Pricing, Profitability and Cost Optimization
- 16.4 Technology Investment and Product Differentiation
- 16.5 Supply Chain Localization and Resilience
- 16.6 Distribution and Customer Acquisition
- 16.7 Partnership, Acquisition and Capacity Strategy
- 16.8 Regional Expansion Priorities
- 16.9 Short-, Medium- and Long-Term Actions
Chapter 17 Competition Outlook
- 17.1 Industry Competition Characteristics
- 17.2 Market Structure and Concentration
- 17.3 Market Share and Competitive Positioning, 2025
- 17.4 Company-Wise Revenue and Product Benchmarking
- 17.5 Production and Service Capacity Benchmarking
- 17.6 Technology, Pricing and Differentiation
- 17.7 Regional Footprint and Distribution Strength
- 17.8 Mergers, Acquisitions and Strategic Alliances
- 17.9 New Entrants and Competitive Threats
- 17.10 Porter's Five Forces and Industry Attractiveness
- 17.11 Competitive Outlook, 2025-2035
Chapter 18 Company Profiles
- 18.1 Company Coverage and Selection Criteria
- 18.2 INVISTA (Koch Industries, Inc.)
- 18.2.1 Business Description
- 18.2.2 Company Ownership and Geographic Presence
- 18.2.3 Product and Service Portfolio
- 18.2.4 Manufacturing and Operating Footprint
- 18.2.5 Production Capacity and Expansion Plans
- 18.2.6 Financial Performance and Investment
- 18.2.7 Market Share and Competitive Position
- 18.2.8 Technology and Innovation Capabilities
- 18.2.9 Strategic Alliances or Partnerships
- 18.2.10 Recent Developments
- 18.2.11 Growth Strategy and Outlook
- 18.3 Ascend Performance Materials
- 18.4 BASF SE
- 18.5 Chongqing Huafon Chemical Co., Ltd. (Huafon Chemical)
- 18.6 Henan Shenma Nylon Chemical Co., Ltd. (China Pingmei Shenma Group)
- 18.7 Shandong Hualu Hengsheng Chemical Co., Ltd.
- 18.8 Tangshan Zhonghao Chemical Co., Ltd.
- 18.9 Asahi Kasei Corporation
- 18.10 LANXESS AG
- 18.11 RadiciGroup (Radici Chimica S.p.A.)
- 18.12 Other Relevant Market Participants
Note: Every listed company is profiled on the structure shown under the first company. The company list is preliminary and may change based on research findings, market developments, data availability and client requirements.
Chapter 19 Disclaimer
- 19.1 Research and Forecast Disclaimer
- 19.2 Data Source and Estimation Limitations
Note: The depth of individual sections depends on data availability for this market. Volume, capacity, trade and other unit-based metrics are included where applicable.

