
Market Overview
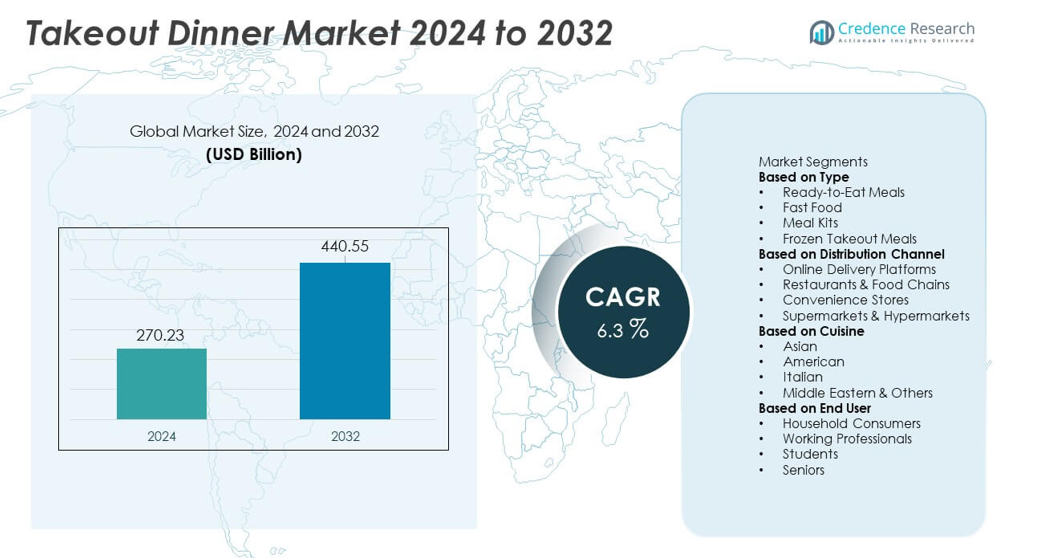
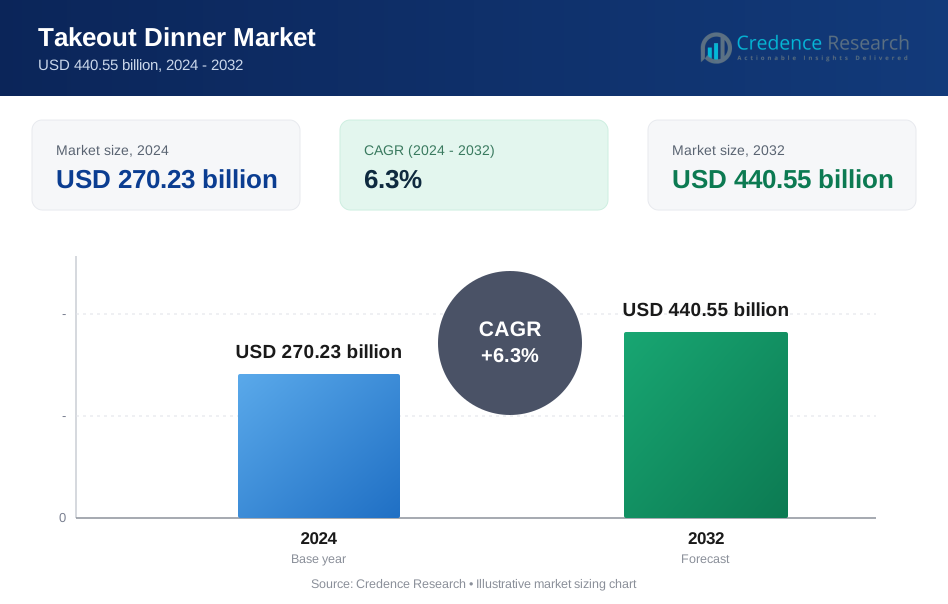
The Takeout Dinner market reached USD 270.23 billion in 2024 and is projected to grow to USD 440.55 billion by 2032, reflecting a CAGR of 6.3% during the forecast period.
| REPORT ATTRIBUTE | DETAILS |
|---|---|
| Historical Period | 2020-2023 |
| Base Year | 2024 |
| Forecast Period | 2025-2032 |
| Takeout Dinner market Size 2024 | USD 270.23 billion |
| Takeout Dinner market, CAGR | 6.3% |
| Takeout Dinner market Size 2032 | USD 440.55 billion |
The Takeout Dinner market is driven by major players such as McDonald’s, Domino’s Pizza, Yum! Brands, Starbucks, DoorDash, Uber Eats, Just Eat Takeaway, Chipotle Mexican Grill, Panera Bread, and Grubhub, all of which expand their reach through strong delivery partnerships, digital ordering systems, and diverse menu offerings. These companies invest in faster delivery models, improved packaging, and loyalty programs to enhance customer retention. Regionally, North America leads the market with 37% share, supported by high digital adoption and strong delivery platform usage, while Europe follows with 28% share, driven by widespread restaurant participation and growing demand for convenient evening meals.
Market Insights
- The Takeout Dinner market reached USD 270.23 billion in 2024 and will grow at a CAGR of 6.3% through 2032, supported by strong demand for convenient evening meals.
- Strong market drivers include busy consumer routines, rapid growth of digital ordering, and rising demand for ready-to-eat meals, with ready-to-eat meals holding 36% share in the segment.
- Key trends include the rise of healthier takeout choices, rapid expansion of subscription-based meal kits, and increased use of AI-based delivery optimization among major players.
- Competitive pressure grows as companies enhance menus, speed up delivery, and introduce loyalty programs, while restraints include high delivery fees, food freshness concerns, and rising operational costs.
- Regionally, North America leads with 37% share, followed by Europe at 28% and Asia Pacific at 26%, driven by strong online ordering use and expanding restaurant and cuisine diversity.
Market Segmentation Analysis:
By Type
Ready-to-eat meals lead the segment with 39% share, driven by rising demand for quick, convenient dining solutions among busy consumers, working professionals, and urban families. These meals gain popularity due to their time-saving nature, diverse options, and improved packaging that maintains freshness and flavor. Fast food continues to grow with strong brand visibility and wide accessibility, while meal kits appeal to consumers seeking partially prepared, customizable options. Frozen takeout meals maintain steady demand as households prioritize affordability and longer shelf life. Growth in convenience-driven lifestyles and expanding product innovation strengthen ready-to-eat meal dominance.
- For instance, Nestlé continually introduces new products and invests in its manufacturing capabilities to meet demand and adapt to consumer trends. The company has invested millions of dollars to expand its U.S. production facilities for frozen meals, such as the Gaffney, South Carolina, plant, which produces items under the Stouffer's and Lean Cuisine brands.
By Distribution Channel
Online delivery platforms dominate the market with 46% share, supported by strong adoption of food delivery apps and increasing consumer preference for doorstep service. Digital platforms offer wide cuisine choices, promotional pricing, and real-time order tracking, making them the preferred option for takeout dinners. Restaurants and food chains follow as they expand takeaway and curbside pickup models. Convenience stores gain momentum through ready-to-eat sections and grab-and-go offerings, while supermarkets and hypermarkets serve households seeking packaged meal solutions. Rising mobile penetration and app-based ordering continue to drive online platform leadership.
- For instance, DoorDash grew its logistics network to reach over 42 million monthly active users and added approximately 600,000 merchant partners across North America. The platform also handled over 2.5 billion delivery orders in the last operating year (2024).
By Cuisine
Asian cuisine holds the largest share at 34%, driven by widespread consumer preference for flavorful, affordable, and diverse meal options such as Chinese, Indian, Thai, and Japanese dishes. American cuisine follows with strong demand for burgers, sandwiches, and comfort foods, supported by established fast-food chains. Italian cuisine remains popular with takeout staples like pizza and pasta. Middle Eastern and other global cuisines grow steadily as consumers explore new flavors and healthier meal choices. Expanding multicultural populations, rising global food trends, and strong representation on delivery apps reinforce the leading position of Asian cuisine in the takeout dinner market.
Key Growth Driver
Rising Demand for Convenience and Time-Saving Meals
Busy lifestyles and growing work commitments drive strong demand for convenient takeout dinner options. Consumers increasingly prefer ready-to-eat meals, fast food, and quick-service offerings that reduce time spent on cooking. Urbanization and increasing dual-income households further support this shift. Delivery apps make access easier by offering fast ordering and diverse menu choices. As consumers prioritize convenience, the takeout dinner market continues to expand across both metropolitan and suburban regions.
- For instance, McDonald's generates income globally through its business model. The company has a significant international presence, operating in numerous countries worldwide. The business strategy involves both company-operated restaurants and a large number of franchised locations.
Expansion of Online Delivery Platforms
Online delivery apps accelerate market growth by offering improved accessibility, personalized recommendations, and multiple payment options. These platforms allow customers to browse menus, track orders, and receive doorstep delivery with minimal effort. Restaurants benefit from higher visibility and extended reach through app-based promotions. Growth in smartphone usage and digital payments further drives adoption. As online platforms integrate loyalty rewards and faster delivery models, demand for takeout dinners rises significantly.
- For instance, Uber Eats facilitates millions of food delivery trips regularly. The platform maintains extensive global coverage and partners with a vast network of restaurants worldwide, operating at a massive scale across numerous regions.
Increased Menu Diversity and Global Cuisine Adoption
Growing interest in global cuisines supports wider acceptance of takeout dinners across diverse consumer groups. Asian, Italian, American, and Middle Eastern meals gain popularity due to variety, affordability, and strong representation on delivery apps. Restaurants expand menus to include healthier options, plant-based meals, and customizable dishes. Multicultural populations and exposure to international flavors also boost demand. As consumers explore more diverse food categories, takeout providers benefit from higher order frequency and broader meal preferences.
Key Trend & Opportunity
Growth of Healthier and Premium Takeout Options
Consumers increasingly seek healthier takeout meals, including low-calorie, plant-based, and protein-rich offerings. Restaurants and delivery brands respond by introducing nutritious dishes, premium ingredients, and clean-label packaging. Wellness-driven dining habits support opportunities for meal kits, frozen meals with better nutrition value, and fresh ready-to-eat bowls. Rising awareness of diet quality and lifestyle-related health issues accelerates demand for premium and health-forward takeout options. This shift encourages innovation across product development and menu expansion.
- For instance, Chipotle continues to see strong demand for protein-rich and plant-based options. The company sources a significant amount of responsibly grown produce each year and has achieved its goal of using wholesome ingredients without artificial colors, flavors, or preservatives in all of its core ingredients.
Rising Adoption of Technology in Delivery and Order Management
Technology plays a key role in improving order accuracy, delivery speed, and customer experience across the takeout dinner market. Restaurants adopt automated kitchen tools, digital menu boards, and AI-driven demand forecasting to optimize operations. Delivery platforms use route optimization, subscription models, and real-time tracking to enhance service reliability. Contactless payments and mobile ordering boost consumer trust. As digital tools evolve, technology-driven innovation creates significant opportunities for operational efficiency and better consumer engagement.
- For instance, Domino’s runs numerous "Domino’s AnyWare" digital ordering integrations and processes a significant percentage of phone orders through its AI system, DOM Voice. The company also uses GPS-enabled delivery tracking for orders across key markets.
Key Challenge
High Operational and Delivery Costs
Rising food prices, labor shortages, and delivery charges create cost pressures for restaurants and delivery partners. Maintaining quality, speed, and affordability becomes difficult as expenses increase across cooking, packaging, and last-mile delivery. Smaller restaurants struggle to match the scale and pricing of large chains. High commission fees from delivery platforms add further strain. Balancing cost efficiency while maintaining service standards remains a major challenge in sustaining profit margins.
Food Quality and Consistency During Delivery
Ensuring food freshness and maintaining taste during transportation remain persistent challenges. Meals may lose texture or temperature due to delays or handling issues. Packaging limitations can affect quality, especially for fried or delicate dishes. These issues impact customer satisfaction and repeat purchases. Restaurants and delivery providers must invest in better packaging, improved handling technologies, and more efficient logistics systems. Maintaining consistent food quality across long distances is essential for long-term customer retention.
Regional Analysis
North America
North America holds 37% share of the takeout dinner market, supported by strong adoption of online delivery platforms, high consumer spending, and a well-developed quick-service restaurant ecosystem. The United States leads the region with widespread use of apps offering fast delivery and diverse cuisine choices. Busy work schedules and growing preference for convenient meals further drive demand. Restaurants expand digital ordering, curbside pickup, and subscription-based meal services to attract customers. Canada contributes with rising urbanization and stronger interest in global cuisines. High digital maturity and strong food-service infrastructure continue to reinforce North America’s leadership.
Europe
Europe accounts for 28% share, driven by expanding food delivery networks, increasing demand for restaurant-quality meals at home, and strong penetration of multinational fast-food and casual dining chains. Countries such as the United Kingdom, Germany, and France lead with advanced delivery ecosystems and high consumer preference for convenient meals. Growth in healthier takeout options and premium ready-to-eat meals strengthens market adoption. Rising urban lifestyles, busy work schedules, and wider availability of international cuisines support steady demand across major cities. Strong digital payment systems and regulatory support for food safety enhance Europe’s position in the market.
Asia Pacific
Asia Pacific holds 25% share, supported by rapid urbanization, growing middle-class populations, and strong adoption of mobile-based food delivery services. China and India lead with large user bases, expanding quick-service chains, and high demand for affordable meal options. Southeast Asia shows strong growth driven by rising smartphone penetration and popularity of app-based takeout services. Diverse culinary preferences, increasing disposable incomes, and busy work environments encourage consumers to opt for convenient dinner solutions. Expansion of cloud kitchens and competitive delivery pricing further strengthens Asia Pacific’s role as one of the fastest-growing regions in the takeout dinner market.
Latin America
Latin America captures 6% share, supported by expanding digital delivery platforms, increasing consumer interest in convenient dining, and growing participation of fast-food chains. Brazil and Mexico lead the region due to strong urban populations and higher adoption of mobile ordering. Economic recovery and rising middle-class spending support growth in ready-to-eat meals and quick takeout options. Despite challenges such as inconsistent delivery infrastructure, large cities show strong demand driven by busy lifestyles and affordability. Rising popularity of regional cuisines on delivery apps further boosts market momentum across Latin America.
Middle East & Africa
The Middle East and Africa hold 4% share, driven by expanding food-service sectors, rising expatriate populations, and high demand for convenient meals among urban consumers. Gulf countries, especially the UAE and Saudi Arabia, lead with strong digital delivery ecosystems and diverse international cuisine offerings. Africa shows gradual growth supported by improving internet access and increasing adoption of fast-food and ready-to-eat meals in metropolitan areas. Restaurants and delivery apps invest in better logistics and wider menu availability to meet rising consumer expectations. Continuous digitalization and lifestyle changes sustain long-term growth in the region.
Market Segmentations:
By Type
- Ready-to-Eat Meals
- Fast Food
- Meal Kits
- Frozen Takeout Meals
By Distribution Channel
- Online Delivery Platforms
- Restaurants & Food Chains
- Convenience Stores
- Supermarkets & Hypermarkets
By Cuisine
- Asian
- American
- Italian
- Middle Eastern & Others
By End User
- Household Consumers
- Working Professionals
- Students
- Seniors
By Geography
- North America
- U.S.
- Canada
- Mexico
- Europe
- Germany
- France
- U.K.
- Italy
- Spain
- Rest of Europe
- Asia Pacific
- China
- Japan
- India
- South Korea
- South-east Asia
- Rest of Asia Pacific
- Latin America
- Brazil
- Argentina
- Rest of Latin America
- Middle East & Africa
- GCC Countries
- South Africa
- Rest of the Middle East and Africa
Competitive Landscape
Competitive landscape analysis shows strong participation from major players such as McDonald’s, Domino’s Pizza, Yum! Brands, Starbucks, DoorDash, Uber Eats, Just Eat Takeaway, Chipotle Mexican Grill, Panera Bread, and Grubhub. These companies strengthen their market position through extensive delivery networks, menu innovation, and strong partnerships with third-party delivery platforms. Leading restaurant chains expand digital ordering, loyalty programs, and curbside pickup to enhance customer convenience. Delivery platforms invest in route optimization, subscription models, and faster delivery capabilities to increase order volume. Cloud kitchens and virtual restaurant brands further intensify competition by offering diverse meals with lower overhead costs. Companies focus on improving packaging quality, reducing delivery time, and offering personalized promotions to boost customer retention. As consumer demand for convenience grows, competition centers on delivery efficiency, menu variety, digital experience, and value-driven offerings.
Key Player Analysis
- McDonald’s
- Domino’s Pizza
- Yum! Brands (KFC, Pizza Hut, Taco Bell)
- Starbucks
- DoorDash
- Uber Eats
- Just Eat Takeaway
- Chipotle Mexican Grill
- Panera Bread
- Grubhub
Recent Developments
- In November 2025, Yum! Brands began a formal strategic review of Pizza Hut - its parent company said Pizza Hut may be sold or restructured to improve performance.
- In August 2025, McDonald's and DoorDash announced a further expansion of their global partnership, which included a new online ordering experience in the U.S.
- In April 2025, Domino’s Pizza and DoorDash announced a strategic partnership where Domino's would begin offering delivery orders via the DoorDash app across the U.S., with a nationwide launch planned to begin in May 2025. Plans were also in place to expand to Canada later in 2025.
Report Coverage
The research report offers an in-depth analysis based on Type, Distribution Channel, Cuisine, End User and Geography. It details leading market players, providing an overview of their business, product offerings, investments, revenue streams, and key applications. Additionally, the report includes insights into the competitive environment, SWOT analysis, current market trends, as well as the primary drivers and constraints. Furthermore, it discusses various factors that have driven market expansion in recent years. The report also explores market dynamics, regulatory scenarios, and technological advancements that are shaping the industry. It assesses the impact of external factors and global economic changes on market growth. Lastly, it provides strategic recommendations for new entrants and established companies to navigate the complexities of the market.
Future Outlook
- Takeout dinner demand will rise as consumers continue to prioritize convenience.
- Online delivery platforms will expand services with faster and more reliable delivery options.
- Restaurants will invest more in kitchen automation to improve preparation speed and accuracy.
- Health-focused and clean-label takeout meals will gain stronger customer interest.
- Meal kit subscriptions will grow as households seek flexible at-home dining solutions.
- AI-based route planning will improve delivery efficiency and reduce delays.
- Cloud kitchens will expand across urban areas to support rising digital food orders.
- Personalization in menus and portion sizes will increase through data-driven insights.
- Sustainability practices will improve with recyclable packaging and reduced food waste.
- Global cuisine variety will grow as consumers explore diverse and premium takeout options.
Request a Free Sample
Fill in your details and we'll send you a free sample report.
- Sample data tables & charts
- Research methodology
Need a Custom Version of This Report?
Tailor the scope, geography, or segments to your exact requirements.
- Custom geography or segment scope
- Direct access to our analyst team
Frequently Asked Questions
What is the current market size for Takeout Dinner market, and what is its projected size in 2032?
At what Compound Annual Growth Rate is the Takeout Dinner market projected to grow between 2025 and 2032?
Which segment is leading the market share in terms of delivery platforms?
What are the primary factors fueling the growth of the Takeout Dinner market?
Who are the major players in the global takeout dinner market?
What are the major market drivers of the takeout dinner industry?
Which region commanded the largest share of the Takeout Dinner market in 2024?
Table of Content
Chapter 1. Report Introduction
- 1.1 Report Description & Purpose
- 1.1.1 Report Title & Market Definition
- 1.1.2 Unique Selling Propositions (USP) & Key Differentiators
- 1.1.3 Value Proposition for Stakeholders
- 1.2 Research Objectives
- 1.2.1 Market Sizing Objectives (Volume & Revenue) (Volume Where Applicable)
- 1.2.2 Segmentation Objectives
- 1.2.3 Competitive Intelligence Objectives
- 1.2.4 Forecast & Scenario Objectives
- 1.3 Report Scope
- 1.3.1 Takeout Dinner Scope – Segments & Subsegments Covered
- 1.3.2 Geographic Scope – Regions & Countries Covered
- 1.3.3 Historical Period, Base Year & Forecast Period (2024; forecast to 2032)
- 1.3.4 Inclusions & Exclusions
- 1.4 Industry Classification & Applicable Codes
- 1.5 Currency, Measurement Units & Valuation Basis
- 1.6 Target Stakeholders
- 1.7 Limitations & Assumptions
Chapter 2. Executive Summary
- 2.1 Global Takeout Dinner Market Snapshot
- 2.1.1 Market Size – Historical (2024) & Forecast (2024-2032) (2024: USD 270.23 billion → 2032: USD 440.55 billion)
- 2.1.2 Volume & Revenue – Global Totals (Volume Where Applicable)
- 2.1.3 Key Market Highlights – Top Five Facts
- 2.2 Takeout Dinner Market Segmentation Snapshot
- 2.2.1 Market Split by Region – 2024 vs. 2032
- 2.3 Competitive Snapshot
- 2.3.1 Top 10 Players by Revenue Share – 2024
- 2.3.2 Top 10 Players by Volume Share – 2024 (Volume Where Applicable)
- 2.3.3 Recent Strategic Developments (18-Month Summary)
- 2.4 Key Investment Highlights & Strategic Conclusions
Chapter 3. Takeout Dinner Market Dynamics & Industry Analysis
- 3.1 Market Overview & Context
- 3.1.1 Takeout Dinner Market Position in the Broader Industry Value Chain
- 3.1.2 Demand Structure & Purchasing Dynamics
- 3.1.3 Market Maturity & Development Stage by Region
- 3.2 Takeout Dinner Market Drivers
- 3.3 Takeout Dinner Market Restraints & Challenges
- 3.4 Takeout Dinner Market Opportunities
- 3.5 Porter's Five Forces Analysis
- 3.5.1 Threat of New Entrants
- 3.5.2 Bargaining Power of Suppliers
- 3.5.3 Bargaining Power of Buyers
- 3.5.4 Threat of Substitutes
- 3.5.5 Competitive Rivalry – Intensity Assessment
- 3.6 Takeout Dinner Value Chain Analysis
- 3.6.1 Upstream – Key Inputs, Resources & Suppliers
- 3.6.1.1 Key Input/Resource 1
- 3.6.1.2 Key Input/Resource 2
- 3.6.1.3 Key Input/Resource 3
- 3.6.2 Midstream – Core Operations & Value Creation
- 3.6.2.1 Operating Model & Process Overview
- 3.6.2.2 Key Operating Locations & Capabilities by Company
- 3.6.3 Downstream – Market Channels & End Users
- 3.6.3.1 Direct Sales & Customer Engagement Channels
- 3.6.3.2 Indirect Sales, Intermediaries & Partner Channels
- 3.6.4 Value Chain Profitability Analysis
- 3.6.1 Upstream – Key Inputs, Resources & Suppliers
- 3.7 PESTEL Analysis
- 3.7.1 Political Factors
- 3.7.2 Economic Factors
- 3.7.3 Social Factors
- 3.7.4 Technological Factors
- 3.7.5 Environmental Factors
- 3.7.6 Legal Factors
- 3.8 Takeout Dinner Supply Chain Analysis
- 3.8.1 Critical Input & Resource Availability Risk Assessment
- 3.8.2 Supplier & Operational Concentration Risk (Geographic Exposure)
- 3.8.3 Supply & Service Disruption Impact Analysis
- 3.9 Regulatory & Policy Landscape
Note: The regulatory and policy landscape section covers regulations based on their applicability to the market, Takeout Dinner category, geography, and scope of the study. Only regulatory frameworks with a material impact on operations, compliance, trade, sustainability, or market access are analyzed in detail.
Chapter 4. Key Investment Pockets & Opportunity Analysis
- 4.1 Takeout Dinner Market Attractiveness Analysis
- 4.1.1 By Region – Investment Attractiveness Matrix (Market Size × CAGR)
- 4.2 Absolute Revenue Growth Opportunity
- 4.2.1 By Region – Absolute Revenue Growth Through 2032
- 4.3 Incremental Demand Opportunity
- 4.3.1 By Region – Incremental Demand Through 2032
- 4.3.2 Segment – Incremental Demand
- 4.4 Emerging Submarket Opportunity Deep Dive (Subject to Applicability)
- 4.5 Priority Market Opportunity Scorecards
- 4.5.1 United States
- 4.5.2 Europe
- 4.5.3 Asia
- 4.5.4 Middle East & Africa
Note: Priority market opportunity scorecards reflect the geographic scope and strategic relevance of the study. Listed markets are indicative and may be adapted to the industry.
Chapter 5. Takeout Dinner Cross-Border Trade & Market Access Analysis
- 5.1 International Trade & Cross-Border Activity Overview
- 5.1.1 Global Export Value by Country (2024)
- 5.1.2 Global Export Volume by Country (2024) (Volume Where Applicable)
- 5.1.3 Global Import Value by Country (2024)
- 5.1.4 Global Import Volume by Country (2024) (Volume Where Applicable)
- 5.1.5 Net Trade Balance by Country (2024)
- 5.2 Export Analysis – Segment
- 5.2.1 Category 1 (Applicable Classification Code)
- 5.2.2 Category 2 (Applicable Classification Code)
- 5.2.3 Category 3 (Applicable Classification Code)
- 5.2.4 Category 4 (Applicable Classification Code)
- 5.2.5 Category 5 (Applicable Classification Code)
- 5.3 Import Analysis – Segment
- 5.3.1 Category 1 (Applicable Classification Code)
- 5.3.2 Category 2 (Applicable Classification Code)
- 5.3.3 Category 3 (Applicable Classification Code)
- 5.3.4 Category 4 (Applicable Classification Code)
- 5.3.5 Category 5 (Applicable Classification Code)
- 5.4 Cross-Border Pricing & Transaction Benchmarks
- 5.4.1 Export Pricing – Segment & Country
- 5.4.2 Import Pricing – Segment & Source Country
- 5.4.3 Price Trends (2024)
- 5.5 Key Cross-Border Trade & Delivery Routes
- 5.5.1 Cross-Border Trade/Delivery Route 1
- 5.5.2 Cross-Border Trade/Delivery Route 2
- 5.5.3 Cross-Border Trade/Delivery Route 3
- 5.5.4 Cross-Border Trade/Delivery Route 4
- 5.5.5 Cross-Border Trade/Delivery Route 5
- 5.6 Trade Policy & Market Access Impact Assessment
- 5.6.1 Tariff & Non-Tariff Barriers
- 5.6.2 Regional Trade & Economic Integration Frameworks
- 5.6.3 Bilateral & Multilateral Trade Agreements
- 5.6.4 Cross-Border Operating, Licensing & Localization Requirements
Note: This chapter applies where cross-border trade or delivery is relevant to Takeout Dinner. Goods, services, and digital offerings are assessed using applicable classifications and transaction measures. Import-export volumes, trade balances, and route analyses are included only where meaningful to the market.
Chapter 6. Competitive Landscape & Company Benchmarking
- 6.1 Takeout Dinner Market Concentration & Structure
- 6.1.1 Herfindahl-Hirschman Index (HHI) – vs. 2024
- 6.1.2 Leading, Mid-Sized & Emerging Player Structure
- 6.1.3 Global, Regional & Local Player Dynamics
- 6.2 Takeout Dinner Market Share Analysis – 2024
- 6.2.1 Global Revenue Share by Company
- 6.2.2 Global Volume Share by Company (Volume Where Applicable)
- 6.2.3 Regional Revenue Share
- 6.2.4 Market Share Evolution ( vs. 2024)
- 6.2.5 Company Market Share by Key Segment
- 6.2.6 Company Market Share by Customer Group
- 6.3 Operating Scale, Capacity & Infrastructure Analysis
- 6.3.1 Global Operating Scale & Supply Capacity
- 6.3.2 Resource Utilization & Operating Efficiency
- 6.3.3 Output, Service Delivery & Activity Metrics
- 6.3.4 Operating Footprint & Infrastructure Map
- 6.3.5 Planned Operational & Capacity Expansion
- 6.4 Takeout Dinner Competitive Benchmarking Matrix
- 6.4.1 Revenue, Growth, Profitability & Operating Metric Comparison
- 6.4.2 Channel Revenue Mix
- 6.4.3 Geographic Revenue Exposure
- 6.4.4 R&D Intensity
- 6.4.5 Sustainability Maturity
- 6.5 Strategic Developments in Takeout Dinner (Last 24 Months)
- 6.5.1 Mergers, Acquisitions & Divestments
- 6.5.2 New Products, Services & Solutions in Takeout Dinner
- 6.5.3 Operational & Infrastructure Expansions
- 6.5.4 Strategic Alliances, Joint Ventures & Partnerships
- 6.5.5 Distribution Expansion & Market Entry
- 6.5.6 Sustainability & ESG Initiatives
- 6.6 Competitive Strategy Mapping
- 6.6.1 Leader, Challenger, Follower & Niche Classification
- 6.6.2 Pricing Strategy Comparison
- 6.6.3 Channel Strategy Matrix
Note: Strategic developments are included based on their materiality and the availability of reliable information.
Chapter 7. Global Takeout Dinner Market – By Sales & Delivery Channel
- 7.1 Segment Overview
- 7.1.1 Volume & Revenue Split by Channel (2024 & 2032) (Volume Where Applicable)
- 7.1.2 Channel Mix Evolution (2024-2032)
Chapter 8. Regional Market Analysis – Global Overview
- 8.1 Global Regional Overview
- 8.1.1 Regional Volume Share (Volume Where Applicable)
- 8.1.2 Regional Revenue Share
- 8.1.3 Regional Volume by Region (Volume Where Applicable)
- 8.1.4 Regional Revenue by Region
- 8.1.5 Regional Forecast Through 2032
- 8.2 Cross-Regional Segment Analysis
- 8.2.1 By Sales & Delivery Channel
- 8.2.2 By Competitive Positioning & Price Tier
Chapter 9. North America Takeout Dinner Market
- 9.1 United States
- 9.2 Canada
- 9.3 Mexico
Chapter 10. Europe Takeout Dinner Market
- 10.1 Germany
- 10.2 France
- 10.3 Italy
- 10.4 United Kingdom
- 10.5 Spain
- 10.6 Poland
- 10.7 Russia
- 10.8 Netherlands
- 10.9 Belgium
- 10.10 Sweden
- 10.11 Denmark
- 10.12 Norway
- 10.13 Rest of Europe
Chapter 11. Asia Pacific Takeout Dinner Market
- 11.1 China
- 11.2 India
- 11.3 Japan
- 11.4 South Korea
- 11.5 Thailand
- 11.6 Indonesia
- 11.7 Vietnam
- 11.8 Malaysia
- 11.9 Australia
- 11.10 Rest of Asia Pacific
Chapter 12. Latin America Takeout Dinner Market
- 12.1 Brazil
- 12.2 Argentina
- 12.3 Colombia
- 12.4 Chile
- 12.5 Rest of Latin America
Chapter 13. Middle East Takeout Dinner Market
- 13.1 Saudi Arabia
- 13.2 United Arab Emirates
- 13.3 Turkey
- 13.4 Israel
- 13.5 Iran
- 13.6 Rest of the Middle East
Chapter 14. Africa Takeout Dinner Market
- 14.1 South Africa
- 14.2 Egypt
- 14.3 Nigeria
- 14.4 Morocco
- 14.5 Rest of Africa
Chapter 15. Takeout Dinner Company Profiles
- 15.1 [Company 01]
- 15.1.1 Company Overview
- 15.1.2 Key Management Personnel
- 15.1.3 Products & Services Portfolio
- 15.1.4 Financial Performance
- 15.1.5 Key Market Focus & Geographic Presence
- 15.1.6 Recent Developments & Strategic Initiatives
Note: The company profile list is preliminary and may change based on research findings, market developments, data availability, and client requirements.
Chapter 16. Appendices
- Appendix A – List of Abbreviations & Acronyms
- Appendix B – Industry Classification Code Reference – Full Series
- Appendix C – Supply, Output & Operating Capacity Data Tables
- Appendix D – End-Use & Demand Base Tables
- Appendix E – Demand, Adoption & Usage Assumptions
- Appendix F – Pricing & Revenue Metric Reference Tables
- Appendix G – Company Operations & Infrastructure Database
- Appendix H – Cross-Border Trade & Activity Data Tables (Where Applicable)
- Appendix I – Regulatory Summary Tables
- Appendix J – Primary Research Participant List (Anonymized)
- Appendix K – Primary Research Questionnaire Framework
- Appendix L – Data Sources & Bibliography
- Appendix M – Market Size Divergence & Source Comparison
Chapter 17. Research Methodology
- 17.1 Research Framework & Philosophy
- 17.2 Secondary Research – Sources, Hierarchy & Data Extraction
- 17.3 Data Modeling – Bottom-Up & Top-Down Market Sizing
- 17.4 Primary Research – Stakeholder Framework, LOI & Sample Sizes
- 17.5 Forecast Methodology – Regression, Scenario & Sensitivity Analysis
- 17.6 Quality Control – Four-Layer Validation Framework
- 17.7 Limitations & Standard Assumptions
- 17.8 Disclaimer
