Market overview
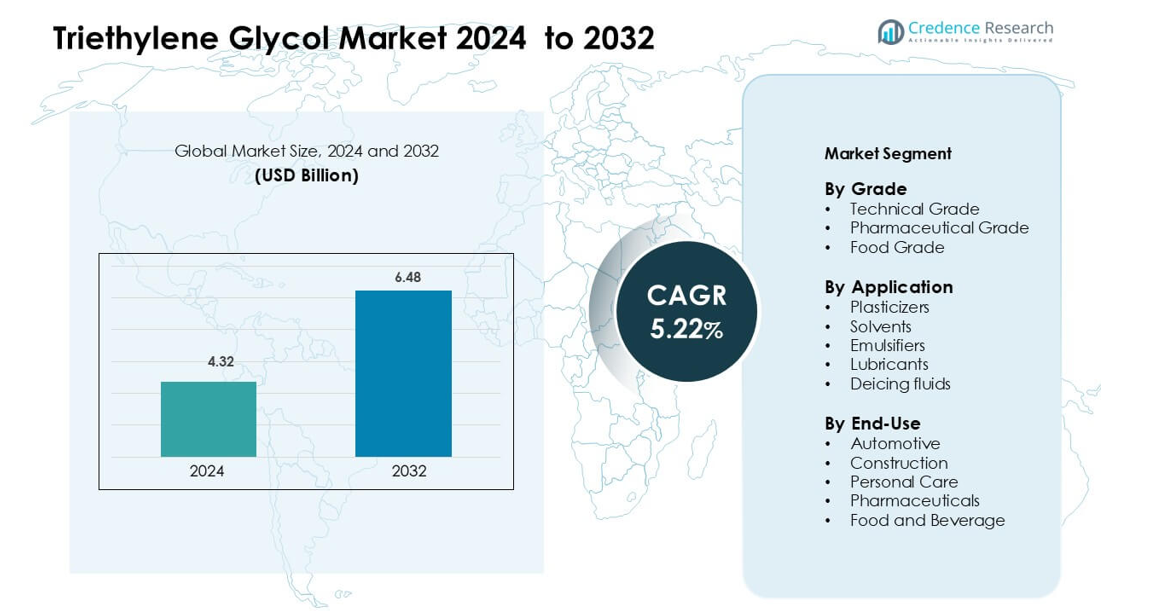
Triethylene Glycol Market was valued at USD 4.32 billion in 2024 and is anticipated to reach USD 6.48 billion by 2032, growing at a CAGR of 5.22 % during the forecast period.
| REPORT ATTRIBUTE |
DETAILS |
| Historical Period |
2020-2023 |
| Base Year |
2024 |
| Forecast Period |
2025-2032 |
| Triethylene Glycol Market Size 2024 |
USD 4.32 billion |
| Triethylene Glycol Market, CAGR |
5.22% |
| Triethylene Glycol Market Size 2032 |
USD 6.48 billion |
The triethylene glycol market is led by prominent companies including Shell, Mitsubishi Chemical Corporation, Orlen, BASF, PTT Global Chemical, Nan YA Plastics, Arham Petrochem, Dow, Sevron, and SABIC. These players focus on technological advancements, process optimization, and strategic expansion to strengthen their global footprint. Shell and SABIC dominate large-scale production for natural gas dehydration, while Dow and BASF specialize in high-purity grades for industrial and pharmaceutical applications. Asian manufacturers such as Nan YA Plastics and PTT Global Chemical are expanding capacity to meet rising regional demand. North America leads the global triethylene glycol market with a 37.6% share in 2024, supported by a well-established petrochemical infrastructure, strong natural gas processing industry, and consistent demand from construction and automotive sectors.
Market Insights
- The global triethylene glycol market was valued at USD 4.32 billion in 2024 and is projected to reach USD 6.48 billion by 2032, growing at a CAGR of 5.22% during the forecast period.
- Strong demand from natural gas dehydration, plasticizers, and solvent applications drives market expansion, supported by rising industrial and construction activities worldwide.
- Ongoing trends include increased adoption of bio-based production methods and advanced purification technologies that improve efficiency and environmental compliance.
- The competitive landscape features key players such as Shell, BASF, Dow, SABIC, and Mitsubishi Chemical, focusing on product innovation, cost optimization, and capacity expansion to maintain market dominance.
- North America leads with a 37.6% regional share, while the technical grade segment accounts for 63.4% of total demand, reflecting strong industrial use and the region’s advanced petrochemical infrastructure supporting large-scale production.
Access crucial information at unmatched prices!
Request your sample report today & start making informed decisions powered by Credence Research Inc.!
Download Sample
Market Segmentation Analysis:
By Grade
The technical grade segment dominates the triethylene glycol market with a 63.4% share in 2024, driven by its extensive use in industrial applications such as natural gas dehydration and as a plasticizer in polymer processing. Its high purity and cost-effectiveness make it suitable for large-scale production environments. The pharmaceutical and food-grade variants cater to niche applications where strict purity standards are required. However, the technical grade remains preferred due to its versatile performance and lower processing cost, particularly in chemical and manufacturing industries.
- For instance, a typical technical‑grade triethylene glycol product specification shows a water content under 0.10 % by weight and a purity of around 99.7 % for the glycol component.
By Application
The plasticizers segment holds the largest market share of 41.2% in 2024, driven by increasing use of triethylene glycol in flexible PVC and polymer formulations. Its ability to enhance elasticity, durability, and moisture resistance supports widespread adoption in industrial and consumer goods production. The solvent and lubricant applications follow, supported by growing demand in coatings, adhesives, and textile processing. The superior solvency, low volatility, and chemical stability of triethylene glycol further strengthen its position in high-performance plasticizer formulations.
- For instance, Eastman Chemical Company does indeed market a plasticizer named TEG-EH, or Triethylene Glycol Bis(2-Ethylhexanoate).
By End-Use
The automotive sector leads the triethylene glycol market with a 35.6% share in 2024, propelled by its use in lubricants, deicing fluids, and brake system formulations. The compound’s hygroscopic nature and thermal stability make it ideal for vehicle maintenance and component protection. Construction and personal care sectors also show steady growth, leveraging triethylene glycol’s performance as a plasticizer and humectant. Expanding vehicle production and focus on advanced material engineering continue to reinforce the dominance of the automotive segment globally.
Key Growth Drivers
Expanding Demand in Natural Gas Dehydration
The rising global demand for natural gas has significantly boosted the use of triethylene glycol (TEG) as a dehydration agent. TEG efficiently removes water vapor from natural gas streams, preventing pipeline corrosion and hydrate formation. The rapid expansion of gas infrastructure projects in North America, the Middle East, and Asia-Pacific has further elevated consumption. Additionally, the compound’s high boiling point and excellent thermal stability make it the preferred glycol over alternatives such as diethylene glycol. With increasing energy transition activities and LNG capacity expansions, TEG’s critical role in gas processing plants continues to drive consistent market growth worldwide.
- For instance, the Gas Processors Suppliers Association specifies that glycol systems often target a water content of 7 lb/MMSCF of gas for pipeline quality.
Rising Use in Industrial Solvents and Plasticizers
Triethylene glycol’s superior solvency, low volatility, and compatibility with diverse chemical compounds have strengthened its demand in solvent and plasticizer formulations. It serves as an effective component in coatings, resins, and polymer processing industries. The material’s ability to enhance flexibility and moisture resistance in plastics supports large-scale use in construction and packaging sectors. Furthermore, manufacturers are shifting toward eco-friendly plasticizers to meet evolving environmental standards, where TEG provides a low-toxicity and biodegradable alternative. This increasing adoption across end-user industries has positioned TEG as a critical material in sustainable industrial chemistry and manufacturing.
- For instance, Eastman Chemical Company markets the product TEG‑EH (Triethylene Glycol Bis(2‑Ethylhexanoate)) Plasticizer, a TEG‑based plasticizer compatible with PVC and PVB resins, designed for applications in automotive and building‑window glazing.
Growth of Personal Care and Pharmaceutical Applications
The personal care and pharmaceutical sectors have emerged as vital growth areas for triethylene glycol. It is widely used as a humectant, solvent, and disinfectant base in skin-care products, mouthwashes, and drug formulations. The compound’s non-irritant, stable, and low-odor properties make it suitable for sensitive applications requiring high safety and performance. The expansion of healthcare infrastructure and rising consumer focus on hygiene and wellness further contribute to product demand. Additionally, ongoing innovations in biocompatible formulations and medical-grade glycols are broadening TEG’s application scope across therapeutic and cosmetic manufacturing industries.
Key Trends & Opportunities
Shift Toward Sustainable and Bio-Based Production
Growing environmental awareness is encouraging producers to develop bio-based triethylene glycol using renewable ethylene oxide sources. These sustainable alternatives reduce carbon footprint while maintaining similar performance characteristics to conventional glycol. Global chemical companies are investing in green chemistry technologies and circular production processes to align with carbon-neutral goals. This transition toward bio-derived TEG not only meets regulatory compliance but also attracts environmentally conscious industries such as cosmetics, pharmaceuticals, and packaging. The shift presents significant opportunities for innovation and differentiation in the chemical manufacturing landscape.
- For instance, India Glycols Limited reports that its sales of bio‑based glycols (including MEG, DEG, TEG and heavy glycols from renewable feedstock) rose from 75,767 metric tons in FY 2020‑21 to 81,077 metric tons in FY 2021‑22.
Expanding Use in Functional Fluids and Lubricants
The increasing integration of triethylene glycol in functional fluids, including heat transfer and deicing formulations, reflects its growing versatility. Its superior hygroscopic properties, high boiling point, and chemical stability enable optimal performance under extreme temperature conditions. Automotive and aerospace sectors particularly benefit from these attributes, as they demand reliable fluid systems for enhanced safety and efficiency. Moreover, ongoing development of advanced lubricant additives based on glycol chemistry creates new growth potential in precision machinery and electric mobility segments, expanding the material’s industrial footprint.
- For instance, glycols are widely used in heat transfer fluids and cooling systems (often in Dow’s branded products like DOWFROST and DOWCAL), triethylene glycol (TEG) is primarily marketed by Dow for other applications, most notably as a liquid desiccant for dehydrating natural gas and in air conditioning systems.
Increasing Investment in Emerging Markets
Rising industrialization in Asia-Pacific and the Middle East is stimulating demand for triethylene glycol across multiple sectors. Rapid growth in construction, automotive, and pharmaceutical manufacturing in countries such as China, India, and Saudi Arabia is fueling consumption. Local producers are expanding capacity to reduce dependence on imports and leverage regional cost advantages. Additionally, government-led energy diversification projects involving natural gas processing and LNG infrastructure create a sustained need for TEG-based dehydration systems, offering long-term expansion opportunities for global suppliers.
Key Challenges
Volatility in Raw Material Prices
The production of triethylene glycol is heavily dependent on ethylene oxide, whose price fluctuations directly impact manufacturing costs. Market instability in crude oil and natural gas sectors, from which ethylene oxide is derived, creates uncertainty in supply and pricing. Additionally, disruptions in logistics and energy costs amplify operational challenges for glycol producers. Such volatility affects profit margins and limits pricing flexibility across downstream applications. Manufacturers are increasingly exploring cost optimization strategies and alternative feedstocks to minimize dependency and maintain competitiveness in fluctuating raw material markets.
Environmental and Health Concerns in Industrial Use
While triethylene glycol is relatively less toxic than many petrochemical derivatives, its large-scale industrial use poses environmental and safety risks. Improper disposal and emissions during production can contribute to air and water pollution. Stringent regulations under REACH and EPA frameworks have increased compliance burdens, requiring advanced waste treatment and emission control technologies. Furthermore, exposure concerns among workers handling concentrated glycol solutions demand better safety practices. Meeting these environmental and occupational standards increases production costs, posing a key challenge for manufacturers aiming to balance sustainability with profitability.
Regional Analysis
North America
North America dominates the triethylene glycol market with a 37.6% share in 2024, supported by strong demand from natural gas processing, construction, and automotive industries. The U.S. leads regional production due to abundant ethylene oxide availability and advanced chemical manufacturing infrastructure. The growing use of triethylene glycol in HVAC systems, deicing fluids, and lubricant formulations further contributes to steady regional consumption. Ongoing investments in shale gas projects and green chemical technologies continue to reinforce North America’s position as a key supplier in the global market.
Europe
Europe holds a 26.8% share of the triethylene glycol market, driven by stringent environmental regulations promoting eco-friendly industrial chemicals. Countries such as Germany, the U.K., and France lead demand due to strong automotive, pharmaceutical, and coatings industries. The region’s focus on sustainable solvent production and circular economy initiatives supports the adoption of bio-based triethylene glycol. Additionally, research investments in alternative glycol synthesis and compliance with REACH standards are enhancing product innovation and maintaining Europe’s competitive edge in high-performance applications.
Asia-Pacific
Asia-Pacific accounts for 28.5% of the global triethylene glycol market, fueled by rapid industrialization and rising consumption in manufacturing sectors. China, India, Japan, and South Korea represent major contributors, with expanding production in construction, plastics, and cosmetics industries. Increasing investments in natural gas processing facilities and infrastructure development drive significant TEG demand. Moreover, the region benefits from lower production costs and growing exports, positioning Asia-Pacific as a major growth engine for the global triethylene glycol industry during the forecast period.
Latin America
Latin America captures a 4.2% share in the triethylene glycol market, supported by moderate industrial expansion in Brazil, Mexico, and Argentina. The region’s chemical and automotive sectors are gradually integrating triethylene glycol into lubricant and polymer applications. Infrastructure modernization projects and expanding pharmaceutical production also contribute to demand. However, economic volatility and limited technological advancement slightly restrain market penetration. Efforts to attract foreign investment and strengthen local chemical production capacity are expected to improve regional competitiveness in the coming years.
Middle East & Africa
The Middle East & Africa region holds a 2.9% share in the triethylene glycol market, driven primarily by its role in natural gas dehydration and petrochemical manufacturing. Countries such as Saudi Arabia, Qatar, and the UAE are investing in large-scale gas processing projects that utilize triethylene glycol as a key dehydration medium. Industrial growth and infrastructure development in Africa further support consumption in construction and automotive fluids. Strategic partnerships between regional refiners and global chemical firms continue to enhance production capabilities and market penetration.
Market Segmentations
By Grade
- Technical Grade
- Pharmaceutical Grade
- Food Grade
By Application
- Plasticizers
- Solvents
- Emulsifiers
- Lubricants
- Deicing fluids
By End-Use
- Automotive
- Construction
- Personal Care
- Pharmaceuticals
- Food and Beverage
By Geography
- North America
- Europe
- Germany
- France
- U.K.
- Italy
- Spain
- Rest of Europe
- Asia Pacific
- China
- Japan
- India
- South Korea
- South-east Asia
- Rest of Asia Pacific
- Latin America
- Brazil
- Argentina
- Rest of Latin America
- Middle East & Africa
- GCC Countries
- South Africa
- Rest of the Middle East and Africa
Competitive Landscape
The triethylene glycol market features a competitive landscape driven by global and regional manufacturers focusing on product quality, technological innovation, and capacity expansion. Leading companies such as Shell, Mitsubishi Chemical Corporation, Orlen, BASF, PTT Global Chemical, Nan YA Plastics, Arham Petrochem, Dow, Sevron, and SABIC dominate production through integrated petrochemical operations and advanced processing technologies. These players emphasize refining efficiency, cost optimization, and strategic partnerships to secure supply chain stability. For instance, Dow and BASF invest in high-purity triethylene glycol grades to serve pharmaceutical and personal care applications, while Shell and SABIC leverage their robust refining networks to meet industrial demand in natural gas dehydration. Moreover, emerging manufacturers in Asia-Pacific are expanding regional production to address growing domestic consumption, enhancing competitive intensity. Sustainability-driven innovation and bio-based production initiatives are expected to redefine market competition, positioning eco-friendly glycol variants as the next growth frontier in the global triethylene glycol industry.
Shape Your Report to Specific Countries or Regions & Enjoy 30% Off!
Key Player Analysis
- Shell (U.K.)
- Mitsubishi Chemical Corporation (Japan)
- Orlen (Poland)
- BASF (Germany)
- PTT Global Chemical (Thailand)
- Nan YA Plastics (China)
- Arham Petrochem (India)
- Dow (U.S.)
- Sevron (France)
- SABIC (Saudi Arabia)
Recent Developments
- In September 2025, Mitsubishi Chemical Corporation (Japan): Announced plans to form a joint operating entity with Asahi Kasei Corporation and Mitsui Chemicals, Inc. in the upstream ethylene segment, signalling downstream derivatives restructuring including glycol products.
- In December 2023, In a strategic step toward reducing carbon emissions, SABIC collaborated with Scientific Design (SD) and Linde Engineering. This joint effort seeks to investigate ways to make the EG production process eco-friendly, focusing on creative approaches that greatly lower the carbon impact and introducing technology for low-emission processes.
- In October 2023, To meet the increasing demand and as per BASF’s customer-focused corporate strategy, the company expanded its capacities for ethylene oxide and ethylene oxide derivatives at its Verbund site in Antwerp, Belgium. The expansion will add around 400 kilotons of annual production to its existing capacity.
Report Coverage
The research report offers an in-depth analysis based on Grade, Application, End-Use and Geography. It details leading market players, providing an overview of their business, product offerings, investments, revenue streams, and key applications. Additionally, the report includes insights into the competitive environment, SWOT analysis, current market trends, as well as the primary drivers and constraints. Furthermore, it discusses various factors that have driven market expansion in recent years. The report also explores market dynamics, regulatory scenarios, and technological advancements that are shaping the industry. It assesses the impact of external factors and global economic changes on market growth. Lastly, it provides strategic recommendations for new entrants and established companies to navigate the complexities of the market.
Future Outlook
- Demand for triethylene glycol will continue to rise with expanding natural gas processing projects worldwide.
- Bio-based TEG production will gain traction as manufacturers shift toward sustainable chemical solutions.
- Advancements in purification technology will improve efficiency and reduce production costs.
- Growing automotive and construction activities will enhance demand for lubricants and plasticizers derived from TEG.
- Pharmaceutical and personal care applications will expand due to rising use of high-purity glycol grades.
- Strategic collaborations between global and regional producers will strengthen supply chain resilience.
- Asia-Pacific will emerge as a major growth hub driven by industrialization and manufacturing expansion.
- Regulatory focus on eco-friendly chemicals will encourage innovation in low-toxicity formulations.
- Increased investment in gas dehydration infrastructure will boost consumption in energy-rich regions.
- Continuous R&D in glycol derivatives will open new opportunities across coatings, textiles, and adhesives industries.



