Market Overview
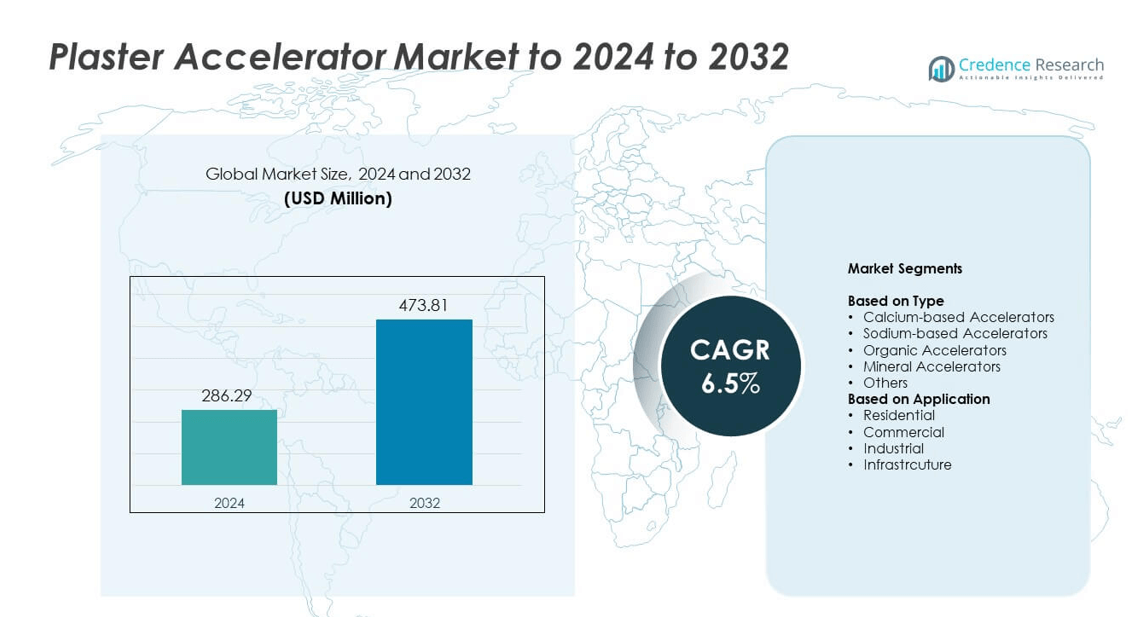
Plaster Accelerator Market size was valued at USD 286.29 million in 2024 and is anticipated to reach USD 473.81 million by 2032, at a CAGR of 6.5% during the forecast period.
| REPORT ATTRIBUTE |
DETAILS |
| Historical Period |
2020-2023 |
| Base Year |
2024 |
| Forecast Period |
2025-2032 |
| Plaster Accelerator Market Size 2024 |
USD 286.29 million |
| Plaster Accelerator Market, CAGR |
6.5% |
| Plaster Accelerator Market Size 2032 |
USD 473.81 million |
The Plaster Accelerator Market features strong competition among major players such as Wacker Chemie AG, LafargeHolcim Ltd., GCP Applied Technologies Inc., BUA Group, Sika AG, BASF SE, Mapei S.p.A., USG Corporation, Knauf Gips KG, and Saint-Gobain S.A., each focusing on faster-setting formulations and better performance under varied site conditions. These companies strengthen their presence through advanced additive technologies, wider distribution, and solutions tailored for residential, commercial, and infrastructure projects. North America leads the global market with about 34% share in 2024, supported by high renovation activity and strong adoption of ready-mix plaster systems.
Market Insights
- Plaster Accelerator Market reached USD 286.29 million in 2024 and will hit USD 473.81 million by 2032 at a CAGR of 6.5%.
- Strong demand for faster construction cycles drives market growth, with calcium-based accelerators holding about 41% share due to wide use in gypsum applications.
- Eco-friendly and low-emission accelerator formulations shape market trends as builders shift toward sustainable and high-performance interior finishing materials.
- Competition intensifies as global manufacturers focus on fast-setting additives, product consistency, and wider distribution, especially across residential projects that lead with nearly 38% share.
- North America leads with about 34% share, followed by Europe at 29% and Asia Pacific at 24%, while Latin America and Middle East & Africa hold 7% and 6% respectively, supported by rising urban development and renovation activity.
Access crucial information at unmatched prices!
Request your sample report today & start making informed decisions powered by Credence Research Inc.!
Download Sample
Market Segmentation Analysis:
By Type
Calcium-based accelerators lead this segment with about 41% share in 2024 due to strong use in fast-setting gypsum mixes for construction sites. Builders favor these accelerators because they shorten drying time and support quick surface finishing. Sodium-based and organic accelerators grow at a steady pace as projects demand better control over set time in interior work. Mineral accelerators gain traction in sustainable projects as they offer stable performance with low impact. Other types serve niche repair and decorative tasks and show slower expansion.
- For instance, Saint-Gobain operated approximately 1,100 manufacturing facilities worldwide in 2024, supporting large-scale gypsum and plaster output.
By Application
Residential construction dominates this segment with nearly 38% share in 2024 due to high use of plaster in walls, ceilings, and interior finishing. Fast-setting needs in home renovation and new housing push demand for strong accelerator blends. Commercial sites show solid growth as large buildings require quick turnaround for partitions and surface leveling. Industrial and infrastructure projects adopt accelerators as they support strict timelines and stable curing under varied conditions.
- For instance, Knauf reports a network of over 300 manufacturing sites and more than 80 raw-material processing plants supplying drywall and plaster solutions globally.
Key Growth Drivers
Rising Demand for Faster Construction Cycles
Growing pressure to shorten project timelines drives wider adoption of plaster accelerators across residential, commercial, and infrastructure projects. Builders prefer accelerators because they reduce setting time and allow quicker layering, sanding, and finishing. Rapid urban expansion and frequent renovation cycles support steady use of these additives. Increased demand for ready-mix plaster products further strengthens market traction. Faster construction workflows help developers reduce labor costs and meet strict delivery schedules, making this driver central to long-term market growth.
- For instance, USG’s 2018 annual report confirms that it accounted for approximately 24.5% of total U.S. industry shipments of gypsum board, reflecting heavy use in fast-track building projects.
Expansion of Drywall and Interior Finishing Applications
Drywall systems continue to replace traditional plastering in many regions, and this shift boosts the need for accelerators that support quick joint filling, patching, and skim-coating tasks. Interior finishing work requires consistent setting behavior, which accelerators help maintain across varied temperatures and humidity levels. Rising adoption of lightweight construction materials increases compatibility needs for fast-curing additives. Growth in residential remodeling and small-scale repair work also supports this demand. This expansion remains one of the strongest contributors to market growth.
- For instance, Armstrong World Industries has diverted 217 million square feet of ceiling tiles through its recycling program. The company reports this recycling has saved 201 million gallons of water since 1999.
Growth of Infrastructure and Large-Scale Projects
Major infrastructure projects rely on materials that support controlled and predictable setting, which makes plaster accelerators essential for improved workability and timeline efficiency. Urban transit, public buildings, and utility structures require fast and durable surface preparation, reinforcing accelerator use. Government investment in social housing and civic upgrades strengthens demand across developing regions. Large contractors prefer accelerators that maintain performance under variable site conditions. This driver plays a key role as global construction spending continues to rise.
Key Trends and Opportunities
Shift Toward Eco-Friendly and Low-Emission Formulations
Manufacturers invest in low-emission accelerators as sustainability standards tighten across major construction markets. Eco-friendly options reduce chemical impact and improve indoor air quality, supporting adoption in residential and commercial spaces. Growing demand for green building certifications encourages suppliers to reformulate products using mineral-based and low-toxicity ingredients. This shift opens new market opportunities for brands that balance fast setting with safer performance. The trend accelerates due to stricter regulations on construction chemicals worldwide.
- For instance, Sika’s 2023 sustainability reporting records a greenhouse-gas emissions intensity of 15.7 kilograms of CO₂ equivalent per ton of product sold, guiding development of lower-impact construction additives.
Rising Adoption of Pre-Mixed and High-Performance Plaster Systems
Pre-mixed plasters gain popularity as builders seek products that deliver consistent quality and faster application. These systems require accelerators that support uniform setting and strong adhesion across large surfaces. High-performance gypsum blends used in premium interiors and industrial environments further expand demand. Growth in modular construction and prefabricated housing creates fresh opportunities for accelerator manufacturers. The trend enhances product standardization and drives innovation in controlled-setting additives.
- For instance, Etex operates more than 160 sites in 45 countries and highlights plasterboard solutions as a main growth driver, supported by new high-efficiency plasterboard lines such as its Bristol plant.
Integration of Smart Construction Practices
Digital tools and modern site management techniques increase the demand for predictable and optimized material performance. Contractors rely on accelerators that align with automated mixing, precise batching, and efficient on-site workflows. Smart construction practices increase focus on time-saving additives that reduce labor needs and project delays. Rising use of data-driven project planning supports further adoption of accelerators that ensure repeatable setting behavior. This trend offers strong market opportunities as construction becomes more technology-driven.
Key Challenges
Fluctuating Raw Material Availability
The market faces challenges due to inconsistent supply of chemical and mineral inputs used in accelerator production. Variations in global sourcing, mining output, and transportation affect cost stability and product availability. Manufacturers struggle to maintain uniform quality when raw material grades shift. These fluctuations increase production risk and reduce pricing flexibility for suppliers. The challenge becomes stronger as demand rises across large markets with limited local supply chains.
Regulatory Pressure on Chemical Additives
Tighter regulations on construction chemicals create barriers for producers using synthetic or high-emission ingredients. Compliance with safety and environmental standards requires reformulation, higher investment, and extended product testing. Some regions impose restrictions on certain accelerator compounds, limiting market entry for specific products. These regulatory constraints slow innovation cycles and increase development costs. The challenge remains significant as governments continue to prioritize health and environmental protection in building materials.
Regional Analysis
North America
North America holds about 34% share in the Plaster Accelerator Market in 2024 driven by strong demand from residential renovation, commercial construction, and advanced interior finishing practices. The region benefits from a mature building sector that values fast-setting materials to reduce labor time and support tight project schedules. Adoption of drywall systems and pre-mixed plaster blends remains high, which increases the use of accelerators for consistent curing. The U.S. dominates regional consumption due to rising home remodeling activity and steady investments in infrastructure upgrades across urban areas.
Europe
Europe accounts for nearly 29% share in 2024 supported by strict construction standards, strong demand for interior finishing quality, and high adoption of eco-friendly accelerators. The region relies heavily on gypsum-based systems, which improves compatibility with calcium and mineral accelerator formulations. Renovation programs in Germany, France, and the U.K. continue to strengthen market use as aging buildings require faster repair and refurbishment cycles. Growing preference for sustainable and low-emission additives also fuels steady adoption across residential and commercial applications.
Asia Pacific
Asia Pacific leads in long-term growth potential with about 24% share in 2024, supported by rapid urbanization, large-scale construction projects, and expanding housing demand. Countries such as China, India, and Southeast Asian markets drive strong consumption of fast-setting plaster products to meet high-volume building needs. The region sees rising adoption of accelerators as contractors push for shorter project cycles and improved interior finishing standards. Infrastructure expansion and increasing acceptance of ready-mix plaster systems continue to accelerate regional market momentum.
Latin America
Latin America holds around 7% share in 2024 with demand driven by urban housing development and improving adoption of efficient construction materials. Markets such as Brazil, Mexico, and Colombia use plaster accelerators mainly in residential and commercial projects where faster setting supports cost-effective timelines. Economic fluctuations limit large-scale expansion, yet steady renovation activity sustains moderate growth. Rising focus on affordable housing programs and gradual modernization of construction practices is expected to strengthen regional use in the coming years.
Middle East and Africa
Middle East and Africa account for nearly 6% share in 2024, supported by increasing commercial developments, hospitality projects, and infrastructure expansion in GCC countries. Accelerators see consistent use in high-temperature environments where faster curing improves application performance. Residential construction growth in Africa adds moderate demand, though adoption remains uneven due to varying building standards. Government-led urban development and rising investment in modern construction materials are helping expand the market across both premium and mid-scale building segments.
Market Segmentations:
By Type
- Calcium-based Accelerators
- Sodium-based Accelerators
- Organic Accelerators
- Mineral Accelerators
- Others
By Application
- Residential
- Commercial
- Industrial
- Infrastrcuture
By Geography
- North America
- Europe
- Germany
- France
- U.K.
- Italy
- Spain
- Rest of Europe
- Asia Pacific
- China
- Japan
- India
- South Korea
- South-east Asia
- Rest of Asia Pacific
- Latin America
- Brazil
- Argentina
- Rest of Latin America
- Middle East & Africa
- GCC Countries
- South Africa
- Rest of the Middle East and Africa
Competitive Landscape
The Plaster Accelerator Market is shaped by leading companies such as Wacker Chemie AG, LafargeHolcim Ltd., GCP Applied Technologies Inc., BUA Group, Sika AG, BASF SE, Mapei S.p.A., USG Corporation, Knauf Gips KG, and Saint-Gobain S.A. Competition remains strong as manufacturers focus on improving setting speed, enhancing formulation stability, and supporting consistent performance in diverse climate conditions. Most players invest in advanced additive technologies to align with growing demand for fast-curing plaster systems used in modern construction. Product development efforts emphasize low-emission and eco-friendly blends to meet tightening global regulations. Companies strengthen their market position through expanded distribution networks, partnerships with major contractors, and tailored solutions for residential, commercial, and infrastructure projects. Rising adoption of pre-mixed plasters and high-volume building activities further intensify competitive strategies across regions.
Shape Your Report to Specific Countries or Regions & Enjoy 30% Off!
Key Player Analysis
Recent Developments
- In 2025, Wacker Chemie AG expanded its production capacity for specialty silicones in Japan and South Korea, which supports growing demand in the construction industry including applications like plaster accelerators and related additives.
- In 2024, BUA Group unveiled a new state-of-the-art gypsum plaster plant in West Africa to meet growing regional demand and reduce reliance on imports.
- In 2024, Saint-Gobain (via CertainTeed Canada Inc.) introduced CarbonLowTM, a low-carbon gypsum wallboard line with significantly reduced embodied carbon, set to be sold in Canada starting 2025.
Report Coverage
The research report offers an in-depth analysis based on Type, Application and Geography. It details leading market players, providing an overview of their business, product offerings, investments, revenue streams, and key applications. Additionally, the report includes insights into the competitive environment, SWOT analysis, current market trends, as well as the primary drivers and constraints. Furthermore, it discusses various factors that have driven market expansion in recent years. The report also explores market dynamics, regulatory scenarios, and technological advancements that are shaping the industry. It assesses the impact of external factors and global economic changes on market growth. Lastly, it provides strategic recommendations for new entrants and established companies to navigate the complexities of the market.
Future Outlook
- The market will grow as construction projects demand faster setting materials.
- Residential renovation activity will boost adoption of quick-curing accelerator blends.
- Eco-friendly accelerator formulas will gain stronger traction across major regions.
- Pre-mixed plaster systems will increase demand for controlled-setting additives.
- Infrastructure programs will drive steady use in large public projects.
- Manufacturers will invest in safer, low-emission chemical compositions.
- Accelerators with better performance in harsh climates will see higher demand.
- Digital construction workflows will favor consistent and predictable curing behavior.
- Emerging markets will expand use as urban housing needs rise.
- Product innovation will focus on faster drying without reducing plaster strength.



