
Denser racks and new colocation halls set airflow budgets
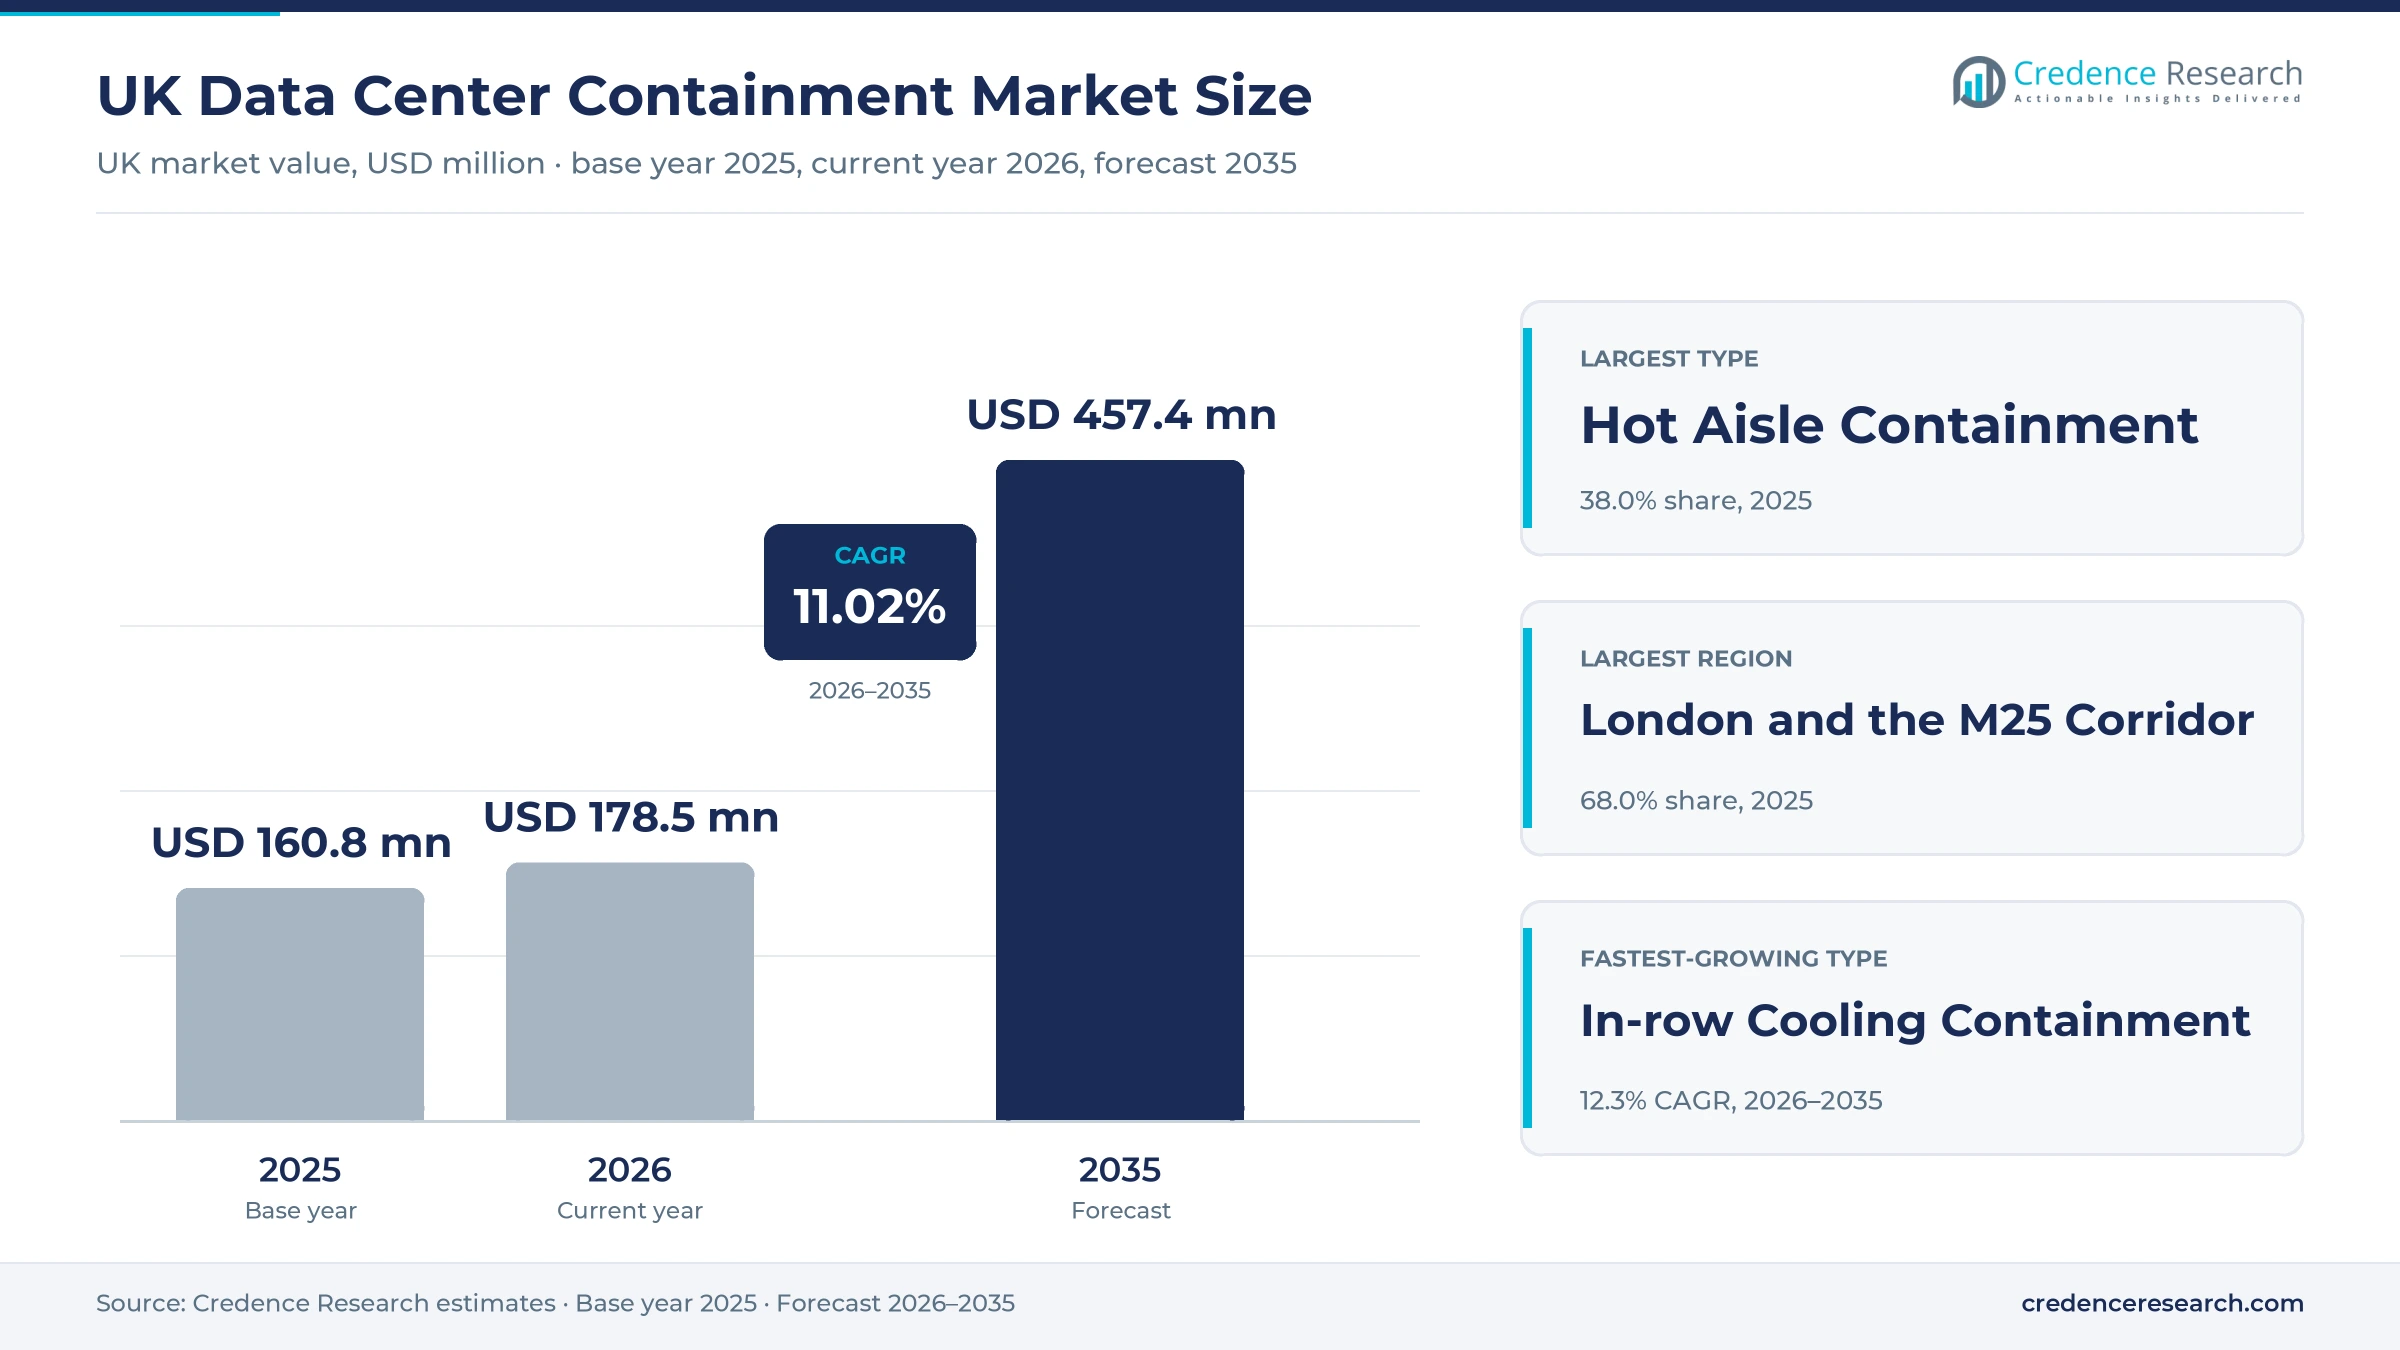
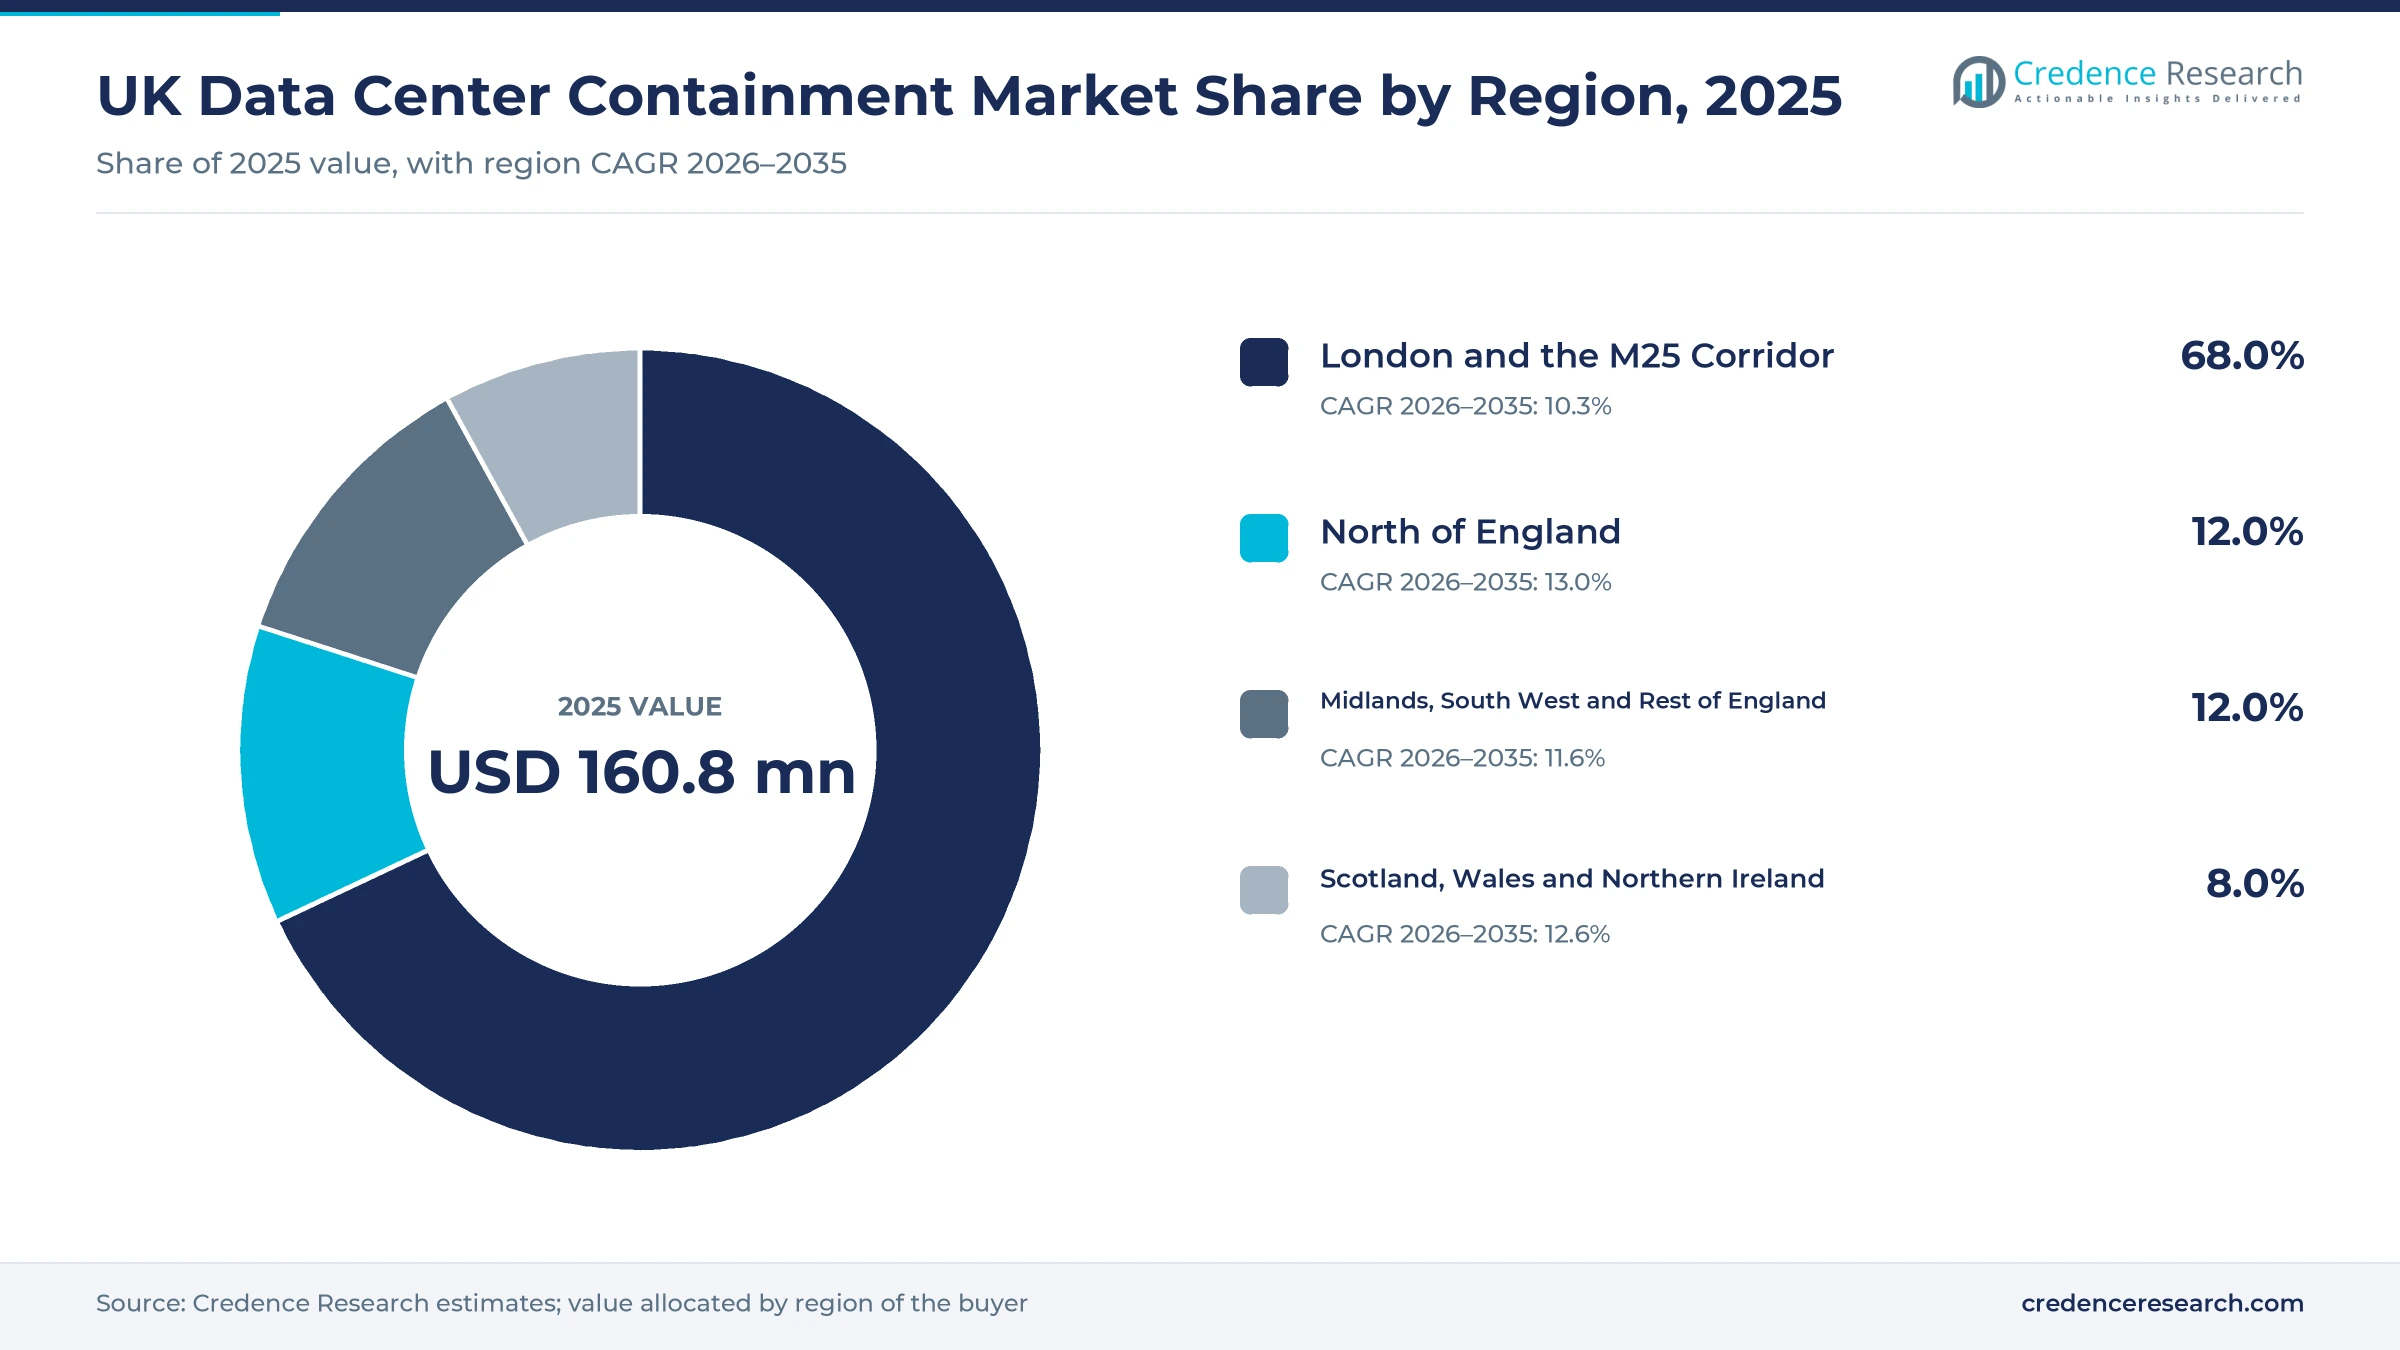
The U.K. data center containment market was valued at USD 160.8 million in 2025 and is projected to increase from USD 178.5 million in 2026 to USD 457.4 million by 2035, registering a CAGR of 11.02% during 2026–2035. Spending comes from colocation landlords fitting out new halls around London, hyperscale cloud providers adding campuses for artificial intelligence and cloud workloads, and enterprises and public bodies upgrading older server rooms to cut cooling bills. London and the M25 Corridor held the largest regional share, 68.0% in 2025, because almost all live and under-construction capacity sits in the London market. North of England is the fastest-growing region at 13.0% a year as large campuses follow cheaper land and spare grid capacity. The main commercial change is the hybrid hall, where liquid-cooled AI racks share rooms with air-cooled servers, so containment is now specified with liquid loops rather than as a stand-alone retrofit.
Hot aisle, cold aisle, chimney and in-row systems are counted
This report sizes annual spending in the U.K. on physical systems that separate hot exhaust air from cold supply air around server racks. It counts hot aisle and cold aisle enclosures with doors, roof panels and end panels, rack-based chimney ducts, enclosed pods built around in-row coolers, and the blanking and sealing parts and installation work sold with them.
Room cooling plant such as chillers and computer room air handlers, liquid cooling loops and the racks themselves are excluded unless they are sold as part of an enclosed pod. Buyers include colocation operators, hyperscale and cloud providers, enterprises, universities and NHS trusts, and most buy through fit-out contractors, rack makers or specialist installers rather than directly from manufacturers.
UK Data Center Containment Market Insights
- The U.K. data center containment market was worth USD 160.8 million in 2025 and is forecast to reach USD 457.4 million by 2035, growing at 11.02% a year during 2026–2035.
- London and the M25 Corridor held 68.0% of 2025 spending, while the North of England grows fastest at 13.0% a year as large campuses move to cheaper land.
- Hot Aisle Containment systems took 38.0% of 2025 spending, because new high-density colocation suites are designed around ducted hot aisles.
- The U.K. delivered a record 231 MW of new data center capacity in 2025, according to Savills, and each new hall needs its own airflow enclosures.
- Kao Data specified hybrid-cooled hot aisle containment for its 17.6 MW Harlow building announced in March 2025, with racks of up to 130 kW.
Hot aisle systems lead while in-row pods grow fastest
Why do hot aisle systems take the largest share?
Based on type, the market is categorized into hot aisle containment, cold aisle containment, rack-based chimney containment and in-row cooling containment. Hot Aisle Containment led with 38.0% of 2025 spending, because it keeps the rest of the room at supply temperature, which suits dense colocation suites, and Kao Data chose hybrid-cooled hot aisle systems for every technology suite of its new Harlow building. In-row Cooling Containment grows fastest at 12.3% a year as operators add cooling close to high-load racks, and Airedale lists its InRak in-row unit from 10 kW to 67 kW, while Rittal lists in-row liquid cooling packages from 10 kW to 60 kW.
Why do colocation operators buy most enclosures?
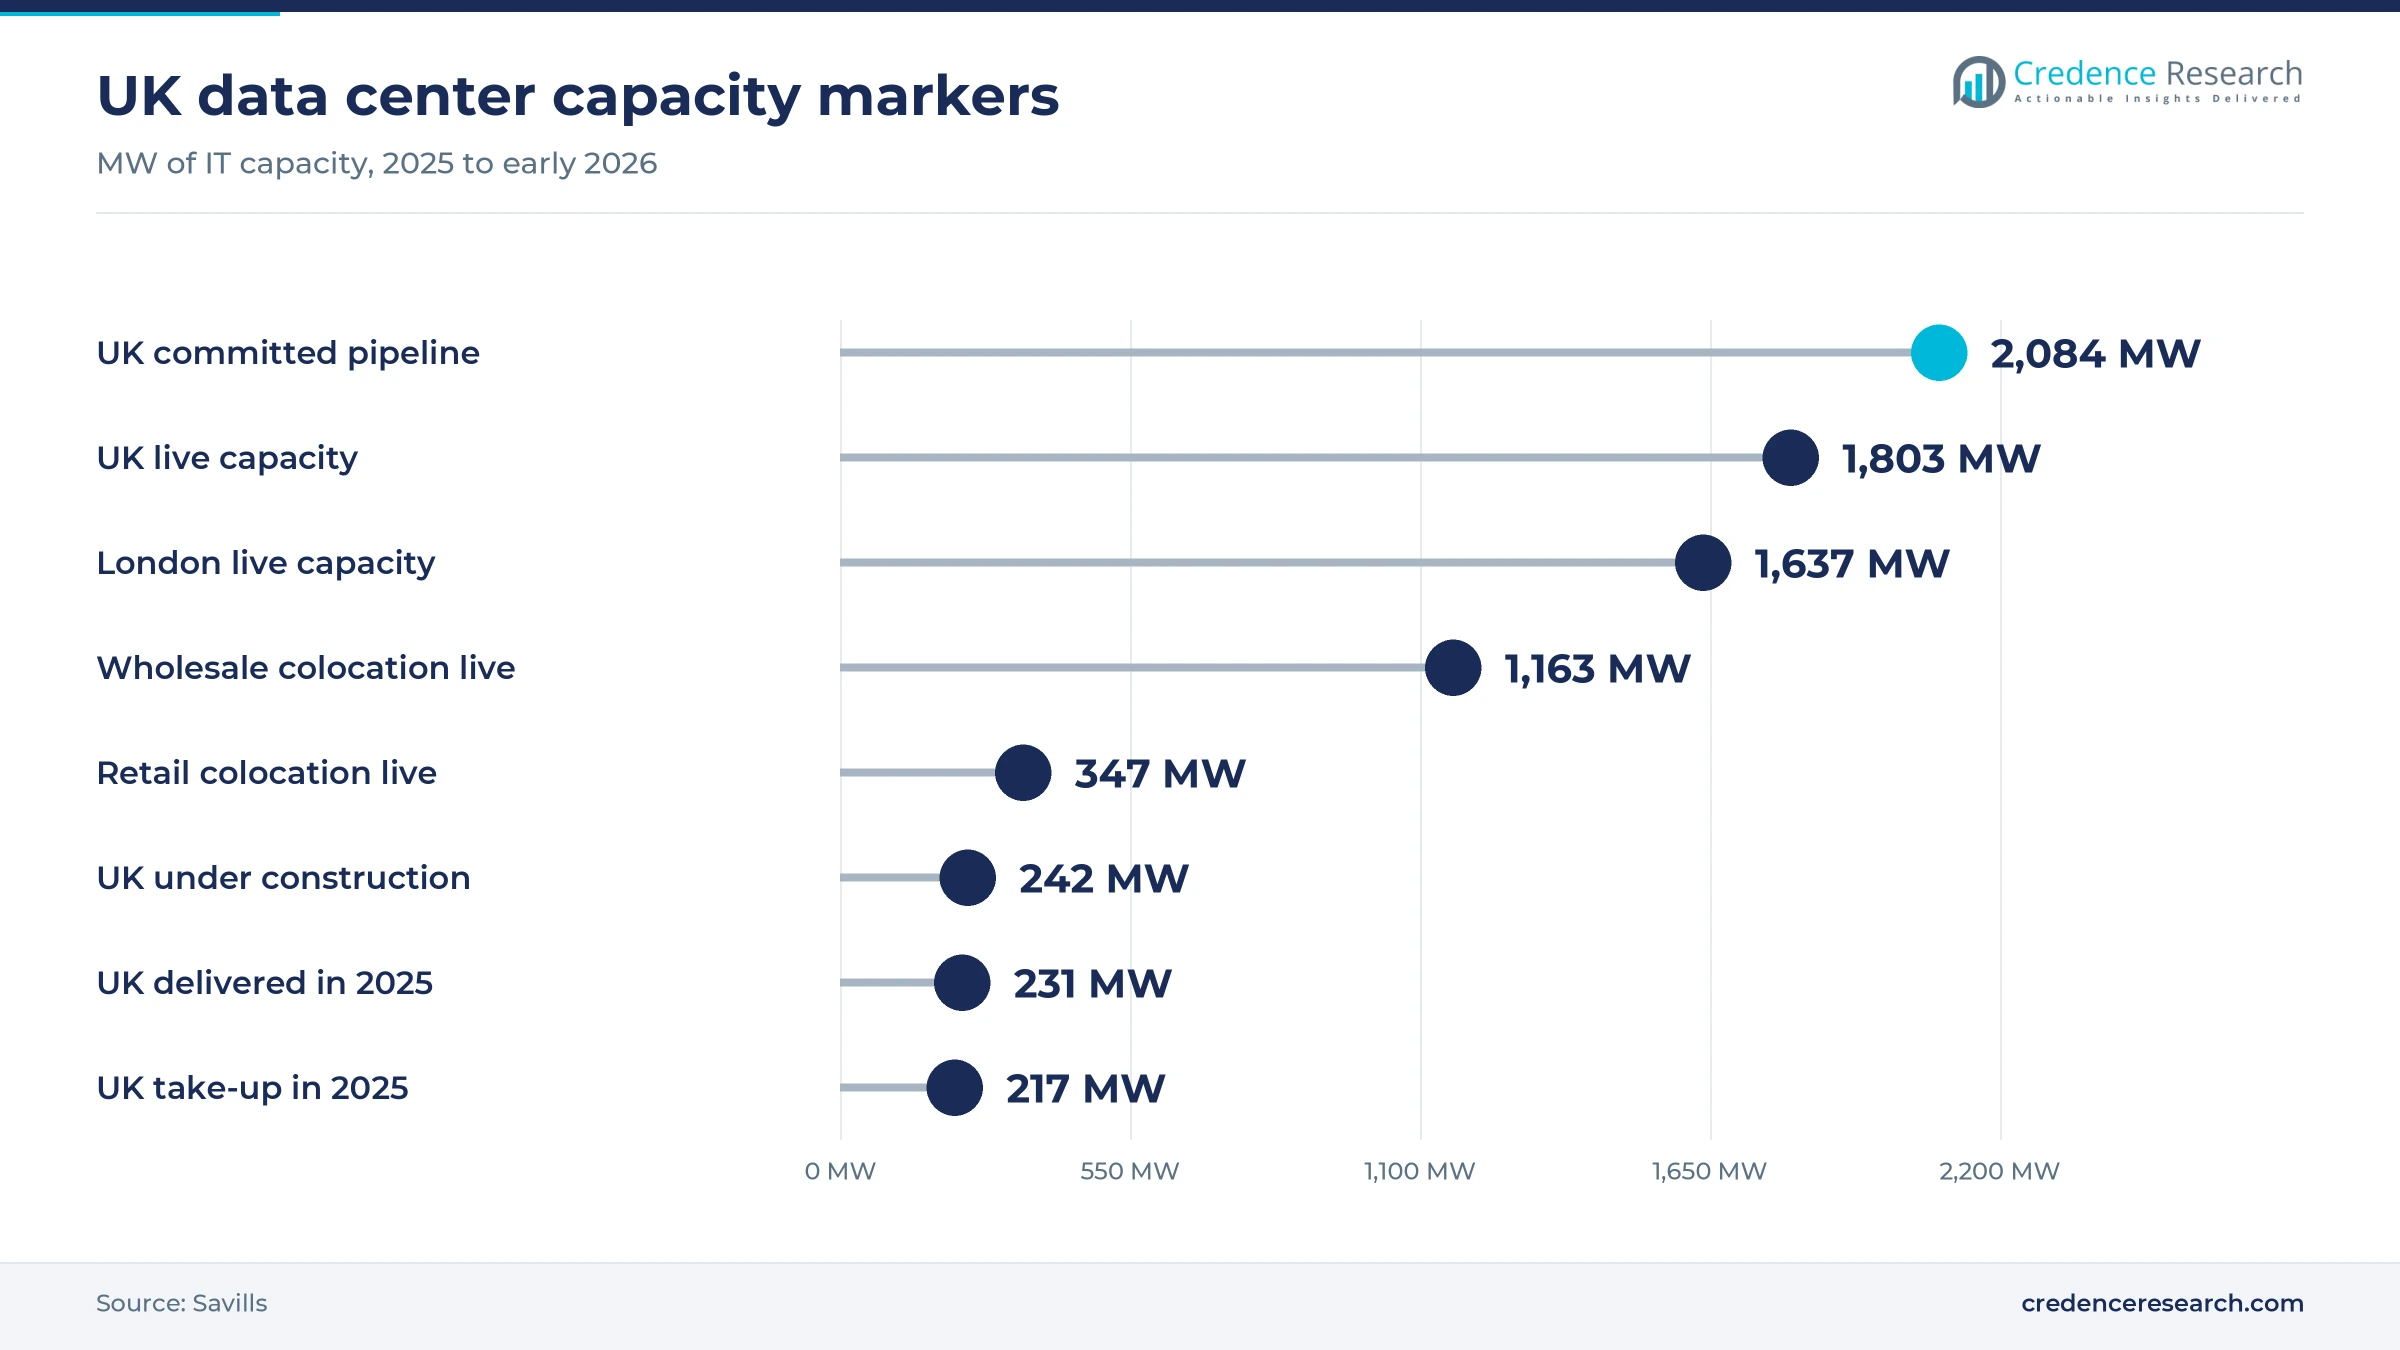
Based on data center type, the market is categorized into hyperscale, enterprise, cloud, colocation and other data centers. Colocation Data Center facilities led with 46.0% of 2025 spending because landlords fit out suites for many tenants with different rack loads, and Savills counted 1,163 MW of live wholesale colocation and 347 MW of retail colocation capacity in early 2026. Hyperscale Data Center facilities grow fastest at 12.6% a year as cloud providers build their own campuses, with Google opening its Waltham Cross site in September 2025 under a two-year £5 billion U.K. investment plan.
Why do modular kits lead and hybrid designs gain?
Based on arrangement, the market is categorized into hybrid, modular, rigid and other containment designs. Modular Containment kits led with 44.0% of 2025 spending, because they bolt onto existing racks and can be moved when tenants change, and Eziblank wall panels for 600 mm to 800 mm gaps sell through U.K. distributors at £289.80 before VAT. Hybrid Containment designs, which combine fixed frames with adjustable panels and liquid pipework, grow fastest at 12.5% a year as suites mix air and liquid cooling, as in the Telehouse West Two building where construction began in October 2025.
| Segment Group | Leading Sub-segment | Share, 2025 | Fastest-growing Sub-segment | CAGR, 2026–2035 |
|---|---|---|---|---|
| By Type | Hot Aisle Containment | 38.0% | In-row Cooling Containment | 12.3% |
| By Data Center Type | Colocation Data Center | 46.0% | Hyperscale Data Center | 12.6% |
| By Arrangement | Modular Containment | 44.0% | Hybrid Containment | 12.5% |
Low-cost panels sit beside larger installed projects
Containment is priced in two ways that give buyers very different bills. Small components such as blanking panels, brush strips and gap panels sell from catalogs at list prices of about £110 to £290, while full aisle enclosures are quoted per project and include doors, roof panels, cable seals and installation. Project prices rise with ceiling height, fire suppression interfaces and the number of rack widths in a row. Specialist installers earn better margins on surveys, fire integration and maintenance than on panels, which explains why rack makers bundle containment with racks and power distribution to protect their share of the order.
| Item or service | Typical price or fee | Basis |
|---|---|---|
| Wall gap panel, 46U, 600 mm to 800 mm | £289.80 ex VAT per unit | Comms Express list price, November 2026 |
| Blanking panels, 10 x 6U pack | £128.76 ex VAT per pack | Comms Express list price, November 2026 |
| Brush panel, 1U, 19 inch | £110.68 ex VAT per unit | Comms Express list price, November 2026 |
| Aisle containment maintenance, four days | £14,918.62 ex VAT per contract | U.K. Research and Innovation award notice, December 2025 |
| Full aisle enclosure, installed | About £1,000 to £2,500 per rack position | Credence Research estimate from component prices and project scopes |
Request a Free Sample
Fill in your details and we'll send you a free sample report.
- Sample data tables & charts
- Research methodology
New capacity, energy targets and AI density lift orders
Record new capacity creates a steady fit-out flow
Every new data hall needs its own enclosures, so the pace of capacity delivery sets the base of demand. Savills reported that the U.K. delivered a record 231 MW of new capacity in 2025, while take-up reached 217 MW and vacancy fell to 8%. About 242 MW was under construction in early 2026 and 2,084 MW was committed but not yet started, which gives suppliers several years of visible orders. Low vacancy also means tenants commit before suites are finished, so landlords order enclosures earlier in the build. Rack makers and installers on landlord frameworks gain most, because they are already on site when tenants choose their layouts.
Energy targets turn airflow control into a requirement
Operators must cut energy use per unit of computing to keep tax relief, and containment is one of the cheapest ways to do so. Under the Climate Change Agreement for data centres, DESNZ set a 14.5% energy improvement target against a 2022 baseline for the period 2026 to 2030, techUK said in October 2025. Manufacturing electricity averaged 17.4 pence per kWh in the second quarter of 2026, up 4% on a year earlier, according to the energy department. Higher power bills shorten the payback on sealing gaps and closing aisles, which favors retrofit kits in older colocation halls that cannot easily replace their cooling plant.
AI rack densities push air separation to its limits
Graphics processor racks produce far more heat than the cabinets that older halls were designed for, which makes tight air separation essential. Vertiv's EMEA design guidance puts air-cooled rows at 20 to 30 kW per rack and liquid or hybrid AI rows at 100 to 130 kW. Kao Data said its Harlow building, announced in March 2025, supports racks of up to 130 kW with hybrid-cooled hot aisle containment. Isambard-AI in Bristol, launched in July 2025, uses fan-less direct liquid cooling for its 5,400 superchips. Suppliers that design enclosures around liquid manifolds and residual air loads win these suites, a shift that favors In-row Cooling Containment growth.
Public and enterprise rooms are rebuilt for efficiency
Hospitals, universities and research bodies are replacing old server rooms with sealed modular rooms, which adds a demand stream outside the large colocation hubs. South Warwickshire University NHS Foundation Trust completed a £1.4 million program with Schneider Electric and DataCentre U.K. in November 2025, and said it uses 60% less electricity for the same IT load. The University of Portsmouth awarded Sudlows a £2.18 million contract in August 2025 for data center infrastructure at its Nuffield site. U.K. Research and Innovation also paid a specialist to maintain its aisle containment in December 2025. Installers with public framework access gain most from this steady replacement cycle.
Hybrid liquid and air halls reshape enclosure design
Hybrid liquid and air halls shift enclosure design
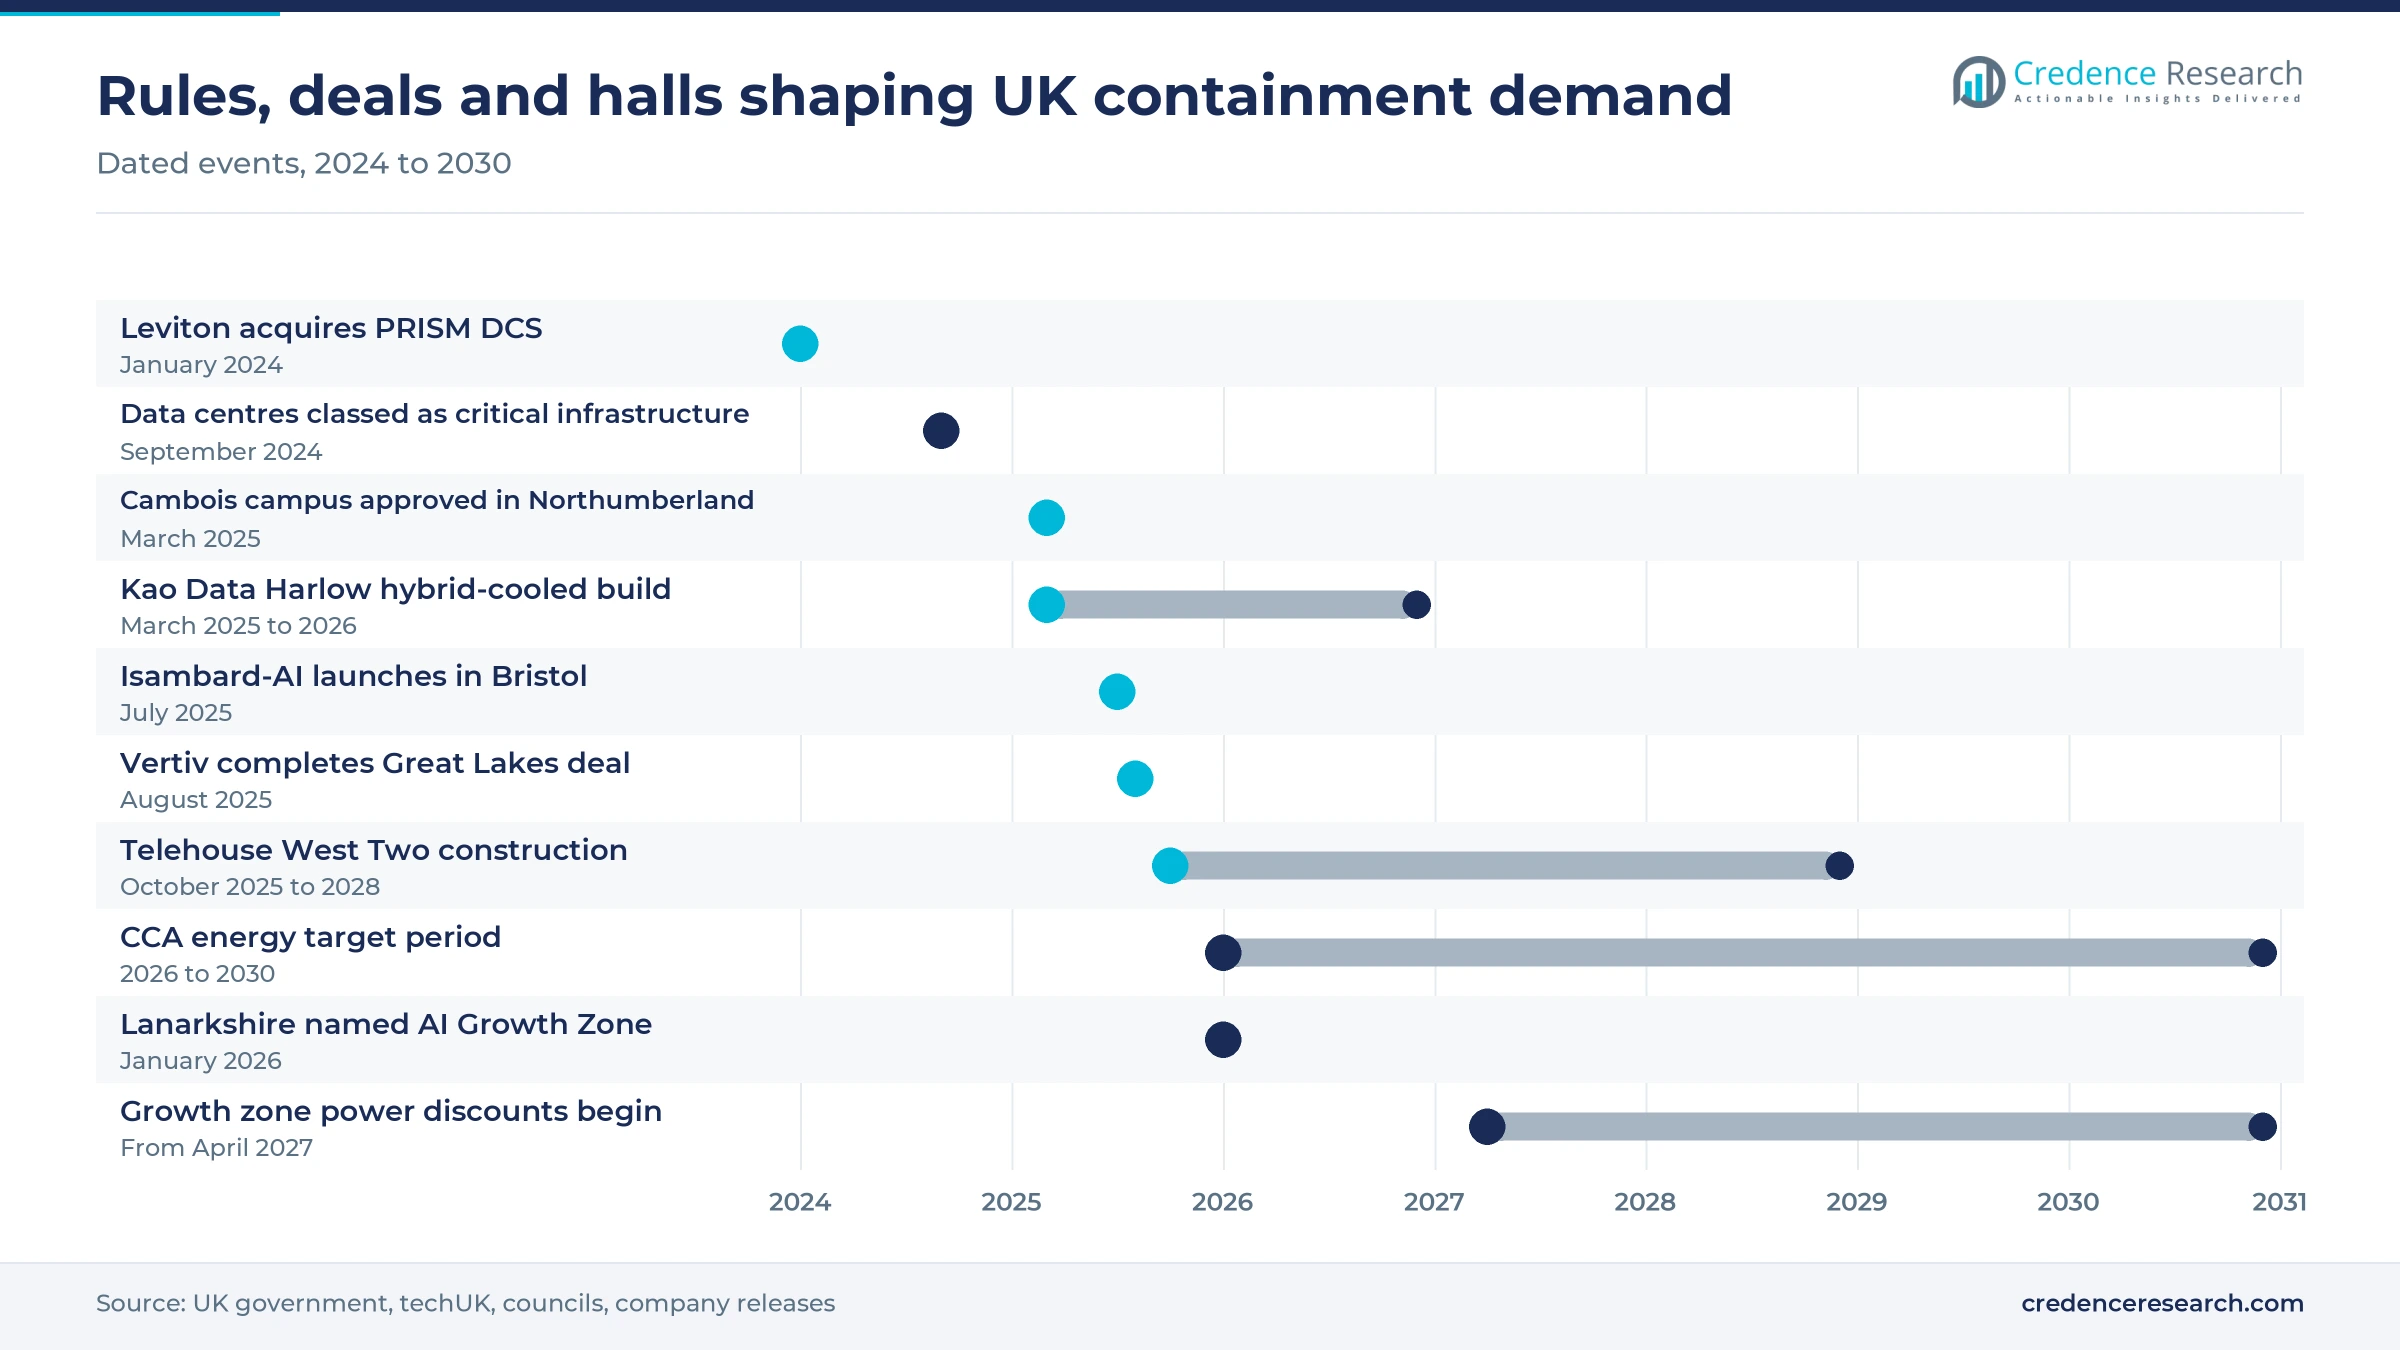
Operators are shifting from all-air rooms to hybrid suites that combine liquid-cooled AI racks with air-cooled servers, which changes what containment must do. Kao Data said its 17.6 MW Harlow building would combine direct-to-chip liquid cooling with hybrid-cooled hot aisle containment and be ready for service in 2026. Telehouse began building its £275 million West Two site in London in October 2025 with combined air and liquid cooling across nine floors of up to 4.4 MW each. Vertiv's guidance says containment still limits residual heat from liquid-cooled racks. Suppliers of direct-to-chip cooling loops and enclosure makers increasingly design these suites together, a pattern that favors Hybrid Containment.
Rack makers buy specialists to sell complete rows
Large electrical groups are shifting toward selling racks, containment and power as a single row package, which narrows the room for stand-alone panel suppliers. Leviton bought U.K.-based PRISM Data Centre Solutions, a maker of racks, cabinets and hot and cold aisle containment, in January 2024. Vertiv completed its acquisition of Great Lakes Data Racks and Cabinets, which has plants in the U.S. and Europe, for about $200 million in August 2025. Eaton lists hot and cold aisle containment beside GenAI-ready racks in 42U, 45U and 48U heights, rated for static loads of up to 2,268 kg, in its third-quarter 2026 EMEA range sold through U.K. resellers. Because the largest operators buy through global frameworks, as the challenges note, they favor these packages, while independent installers face more competition.
Lower power prices in growth zones open northern projects
Planned electricity discounts in AI Growth Zones create a new class of large northern and Scottish campuses that will need enclosures from the start. The government said in November 2025 that data centers in eligible AI Growth Zones could get discounts of up to £24 per MWh in Scotland, £16 in Cumbria and £14 in the North East from April 2027. It estimated that a 500 MW data center could save up to £80 million a year. Lanarkshire was named an AI Growth Zone in January 2026 with £8.2 billion of committed private investment led by DataVita. Installers that set up crews in the North can win these packages before London competitors arrive.
Waste heat reuse rewards hotter, tightly sealed aisles
Sites that sell or donate waste heat need hot return air at stable temperatures, which only well-sealed hot aisles deliver. Google said in September 2025 that its Waltham Cross site can supply waste heat free of charge to nearby homes, schools and businesses, while relying on advanced air cooling. The University of Bristol said Isambard-AI waste heat could warm nearby homes and businesses. ONS estimates that data centers used about 4.5 TWh of grid electricity in 2024, 41% more than in 2020, so recovered heat has growing value for councils. Enclosure suppliers that can work with heat network designers and precision air conditioning units gain a stronger case with operators.
Liquid cooling, fire rules and project delays limit spend
Direct liquid cooling lowers air-side content per MW
Halls that remove most heat through liquid loops need less air containment for each megawatt of IT load. Isambard-AI in Bristol uses 100% fan-less direct liquid cooling, and the University of Bristol says the design can cut cooling power by up to 90%. Suppliers that sell enclosures by rack count are most exposed in AI training halls, where fewer racks carry more load. Their best response is to sell residual air control and sealing with the liquid system rather than full-height aisles.
Fire suppression rules add cost and design time
Enclosed aisles must not block sprinkler or gas discharge, so every roof and door design has to be checked against the fire strategy and insurer rules. Legrand says contained aisles need drop-away ceiling panels, nozzles inside the aisle or doors that release when fire detection is triggered. Its Minkels drop-away roof panels, launched in June 2016, use frames that soften above 65 degrees. Such parts raise project prices, and smaller installers without fire engineering partners are most exposed when insurers ask for proof.
Grid delays push back hall fit-outs
Containment is installed near the end of a build, so delays to power connections delay enclosure orders as well. The 2,084 MW committed pipeline noted above was almost nine times the capacity under construction in early 2026, a sign of how many projects wait for power and consent. The government said AI Growth Zones aim to cut time to power by up to five years, but most benefits arrive after 2027. Installers that staff up for announced projects risk idle crews.
Concentrated buyers squeeze supplier margins
A small number of operators control most U.K. capacity, which gives them strong leverage over enclosure prices. Savills said the ten largest operators held 62% of live U.K. capacity in early 2026, and these groups buy through global frameworks that set rack and containment specifications across countries. Smaller U.K. makers are most exposed when a framework moves to a single global supplier. They protect margins through fast lead times, custom sizes for older halls and maintenance work.
London holds most demand while the North grows fastest
| Region | Value, 2025 (USD million) | Share, 2025 | CAGR, 2026–2035 |
|---|---|---|---|
| London and the M25 Corridor | 109.3 | 68.0% | 10.3% |
| North of England | 19.3 | 12.0% | 13.0% |
| Midlands, South West and Rest of England | 19.3 | 12.0% | 11.6% |
| Scotland, Wales and Northern Ireland | 12.9 | 8.0% | 12.6% |
London and the M25 corridor hold most fitted halls
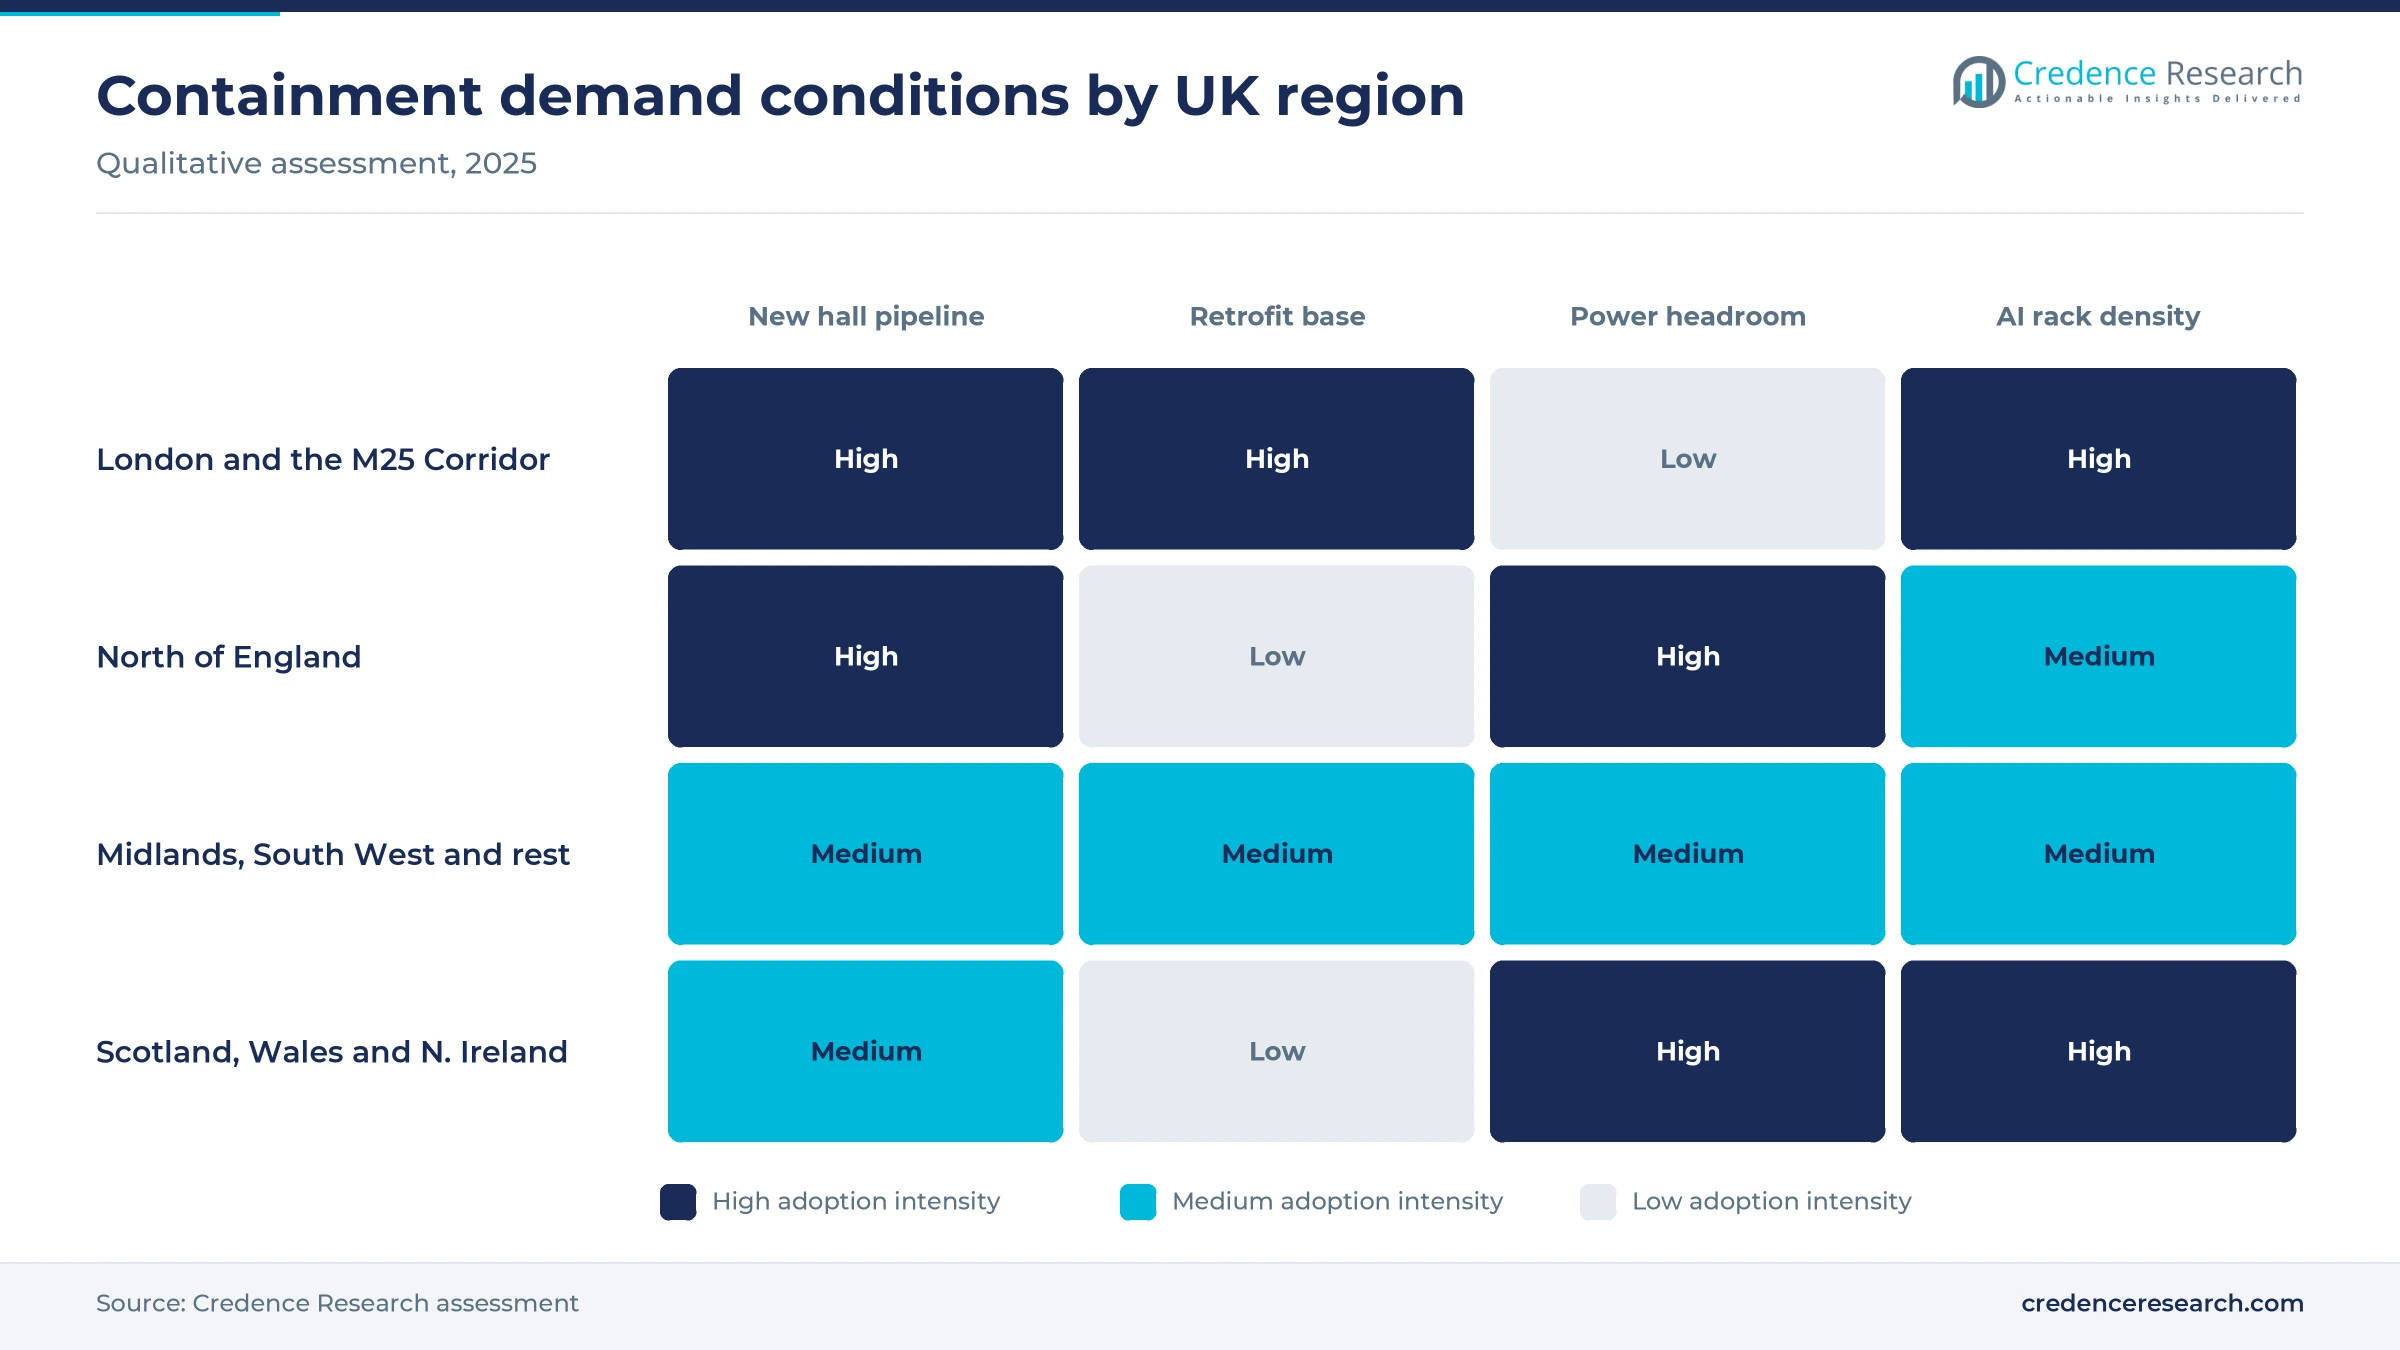
London and the M25 Corridor held 68.0% of 2025 spending and grows at 10.3% a year, the slowest of the four regions. Savills counted 1,637 MW of live capacity in the London market in early 2026, about 91% of the U.K. total, and nearly all capacity then under construction. New buildings such as Telehouse West Two in London and Kao Data in Harlow keep demand here high. Grid limits on new sites will shift more spending toward retrofits of existing halls. Every tenant change in these halls triggers resealing work, which keeps retrofit kits selling even where few new sites start.
The North of England draws the largest new campuses
The North of England held 12.0% of 2025 spending and is the fastest-growing region at 13.0% a year. Planners approved the QTS campus at Cambois in Northumberland in March 2025, with up to 10 data center buildings and investment of up to £10 billion. The North East discount of up to £14 per MWh noted above improves the operating case. Most demand here will come from new hyperscale halls, so suppliers will sell large ducted hot aisle systems rather than retrofit kits. Containment demand in the region could rise sharply once the first of the 10 planned Cambois buildings starts fit-out.
The Midlands and South West rebuild research rooms
The Midlands, South West and rest of England held 12.0% of 2025 spending and grow at 11.6% a year. Demand here comes from research computing, hospitals and regional colocation rather than hyperscale campuses. Isambard-AI in Bristol and the South Warwickshire NHS rooms show the mix, and STULZ supplied three CyberRow in-row units for the Paragon CC data center in Bristol. A buyer at Culham in Oxfordshire also awarded about £6.0 million in November 2025 for computing equipment inside a prefabricated modular data center. Containment demand in the region therefore arrives in smaller orders, as the two NHS rooms handed over in 2025 show, rather than campus-scale packages.
Scotland and Wales add renewable-powered AI halls
Scotland, Wales and Northern Ireland held 8.0% of 2025 spending and grow at 12.6% a year. The Lanarkshire growth zone around DataVita's Airdrie site, developed with CoreWeave, gives Scotland its first large AI campus, and the Scottish discount of up to £24 per MWh is the largest on offer. Renewable supply and land favor training halls, which tend to use liquid cooling, so air containment content per MW is lower here than in London colocation suites. Scottish containment demand will depend on how many of the £8.2 billion Lanarkshire halls keep air-cooled rows.
Acquisitions and new halls in 2024-25 reset the field
| Development | Status and market relevance |
|---|---|
| In January 2024, Leviton acquired U.K.-based PRISM Data Centre Solutions, a maker of racks, cabinets and hot and cold aisle containment. | Acquisition completed; PRISM products sit within the Leviton range for enterprise and data center buyers. |
| In March 2025, Kao Data announced construction of a 17.6 MW liquid-cooled building in Harlow with hybrid-cooled hot aisle containment in each suite. | Construction announced; the building is due to be ready for service in 2026. |
| In August 2025, Vertiv completed its acquisition of Great Lakes Data Racks and Cabinets for about $200 million. | Acquisition completed; it adds rack plants in the U.S. and Europe to the Vertiv white space range. |
| In October 2025, Telehouse Europe broke ground on its £275 million West Two building in London, with air and liquid cooling on nine floors. | Construction under way; completion is planned for 2028. |
| In November 2025, Schneider Electric and DataCentre U.K. handed over two modular data centers to South Warwickshire University NHS Foundation Trust. | Operational; the £1.4 million program replaced aging server rooms with a design PUE of 1.2. |
Panels, chimneys and in-row units trade cost and density
- Ducted hot aisle enclosures capture exhaust air at rack level and return it to cooling plant, which keeps the room at supply temperature and suits heat recovery.
- Cold aisle kits enclose the supply side with doors and roof panels, which suits retrofits of raised-floor rooms at the lowest installed cost.
- Rack chimneys duct hot air from single cabinets into a ceiling plenum, which suits mixed rooms where full aisles cannot be closed.
- In-row cooled pods place coolers between racks inside a sealed row, which supports higher loads without changing the room plant.
Need a Custom Version of This Report?
Tailor the scope, geography, or segments to your exact requirements.
- Custom geography or segment scope
- Direct access to our analyst team
Rack makers and cooling specialists compete on fit
Competition in the U.K. data center containment market turns on how well suppliers fit enclosures to existing racks, fire systems and cooling plant, more than on panel prices alone. Schneider Electric, Vertiv, Rittal, Legrand and Eaton compete by bundling containment with racks, uninterruptible power supply systems and monitoring on large frameworks, and Leviton gained a U.K. manufacturing base through PRISM DCS. STULZ and Airedale compete through in-row coolers built into enclosed pods. Cannon Technologies, EDP Europe and Nubis Solutions win retrofit and custom work through short lead times and site surveys, and Nubis won a U.K. Research and Innovation maintenance award in December 2025. Specialists also gain when enclosures must fit racks from several makers in older halls, where global kits need costly changes.
How is the supply side organized and where do margins sit?
Supply is organized in three layers that often overlap on large projects. Global power and rack groups such as Schneider Electric, Vertiv, Rittal, Legrand, Eaton and Leviton sell containment as part of complete rows with racks, power distribution and monitoring. Cooling makers such as STULZ and Airedale supply the in-row units around which enclosed pods are built. U.K. specialists such as Cannon Technologies, Eziblank maker EDP Europe and Nubis Solutions sell custom panels, retrofit kits and maintenance. Entry barriers are low for simple panels but higher for fire-rated roofs and hybrid suites, so margins sit with integrators and service work rather than with commodity panels.
Companies profiled and their roles in this market
| Company | Type | Role in the market |
|---|---|---|
| Schneider Electric SE | Full-line supplier | APC NetShelter containment, racks and modular rooms for U.K. colocation and NHS sites |
| Vertiv Holdings Co | Full-line supplier | Aisle containment, racks and cooling for colocation and hyperscale halls |
| Rittal GmbH & Co. KG | Rack and cooling manufacturer | Aisle containment and in-row liquid cooling packages from 10 kW to 60 kW |
| Legrand SA (Minkels) | Rack and containment manufacturer | Minkels customized containment, cabinets and airflow sealing parts |
| Leviton Manufacturing Co. (PRISM DCS) | Local manufacturer | U.K.-made racks, cabinets, hot and cold aisle containment and caging |
| Eaton Corporation plc | Full-line supplier | Hot and cold aisle containment sold with racks, UPS and monitoring |
| STULZ GmbH | Cooling equipment manufacturer | CyberRow in-row units for contained hot and cold aisles |
| Modine Manufacturing Company (Airedale) | Cooling equipment manufacturer | InRak in-row coolers from 10 kW to 67 kW and containment design support |
| Cannon Technologies Ltd | Local manufacturer | Modular aisle containment, racks and rear-door cooling made in the U.K. |
| EDP Europe Ltd (Eziblank) | Specialist | Eziblank blanking panels, brush strips and gap panels for retrofits |
| Nubis Solutions Ltd | Specialist | Cold and hot aisle containment installation and maintenance |
Air-side discipline stays essential in liquid-cooled halls
Credence Research's view is that containment remains essential in U.K. halls even as liquid cooling spreads, but its value is moving from panels to integrated row design. Hybrid suites still need tight control of residual air, and energy targets keep retrofit demand alive in older London halls. Suppliers that design enclosures together with liquid manifolds, fire systems and heat recovery will gain share. Buyers should specify containment early in the build and include maintenance, since gaps that open after tenant changes erode the efficiency gains that justified the spending.
Estimates rebuilt from capacity, rack and price data
The report uses 2025 as the base year and forecasts U.K. containment spending for 2026 to 2035. Market values come from the Credence Research model, which multiplies new and refitted rack positions by installed costs, adds in-row pods, sealing parts and maintenance, and checks the result against capacity and project data. This edition replaces an earlier estimate with a 2024 base year. Segment and regional splits are Credence Research estimates built from the same inputs. Sources include ONS, government releases, procurement notices, property adviser reports, list prices, company releases and news reports, and no interviews or surveys were conducted.
Spending nearly triples as hybrid halls become standard
U.K. containment spending should rise from USD 178.5 million in 2026 to USD 457.4 million by 2035, as colocation and cloud halls around London keep adding suites and new campuses open in the North and Scotland. Hot aisle systems will remain the largest type, but enclosed in-row pods and hybrid designs will gain as liquid and air cooling share rooms. Retrofits will matter more in London, where grid limits slow new sites, and suppliers linked to new build and fit-out programs will see the largest orders. A fast move to fully liquid-cooled AI halls is the main risk to the forecast.
How wide is the range of outcomes to 2035?
The outcome depends on how quickly committed capacity reaches construction and how much air-side content survives in liquid-cooled halls. Faster grid connections and growth zone discounts would bring northern campuses forward and push growth toward the upside. A rapid move to fully liquid-cooled AI halls, or long delays to London projects, would hold spending near the downside case. Retrofit demand from energy targets limits how far growth can fall.
| Scenario | CAGR, 2026–2035 | Value, 2035 | What has to hold |
|---|---|---|---|
| Downside | 8.5% | USD 372.6 million | Grid delays persist and AI halls move to almost fully liquid cooling |
| Base | 11.02% | USD 457.4 million | Committed London and northern halls reach fit-out close to announced dates |
| Upside | 12.8% | USD 528.6 million | Growth zone discounts and faster connections bring several large campuses forward |
Frequently Asked Questions
How big is the U.K. data center containment market?
What are data center containment solutions?
Which type of containment leads in the U.K.?
How does containment relate to U.K. data center cooling?
Which companies supply data center containment systems in the U.K.?
How much does containment cost in the U.K.?
Which U.K. region leads containment demand?
Does liquid cooling remove the need for containment?
Table of Content
Chapter 1 Market Segmentation
- 1.1 Segmentation Framework
- 1.1.1 Product and Service Classification
- 1.1.2 Application and End-Use Classification
- 1.1.3 Technology and Solution Classification
- 1.1.4 Customer and Distribution Channel Classification
- 1.1.5 Geographic Segmentation
- 1.1.6 Market Segment Definitions and Boundaries
- 1.2 By Type
- 1.2.1 Hot Aisle Containment
- 1.2.2 Cold Aisle Containment
- 1.2.3 Rack-based Chimney Containment
- 1.2.4 In-row Cooling Containment
- 1.3 By Data Center Type
- 1.3.1 Colocation Data Center
- 1.3.2 Hyperscale Data Center
- 1.3.3 Enterprise Data Center
- 1.3.4 Cloud Data Center
- 1.3.5 Others
- 1.4 By Arrangement
- 1.4.1 Modular Containment
- 1.4.2 Rigid Containment
- 1.4.3 Hybrid Containment
- 1.4.4 Others
Chapter 2 Introduction
- 2.1 Report Objectives and Scope
- 2.2 Product Definition and Industry Terminology
- 2.3 Market Inclusions and Exclusions
- 2.4 Research Process
- 2.4.1 Primary Research and Expert Interviews
- 2.4.2 Secondary Research and Source Review
- 2.4.3 Top-Down and Bottom-Up Estimation
- 2.4.4 Data Triangulation and Verification
- 2.5 Market Size Measurement Basis
- 2.5.1 2025: USD 160.8 million → 2035: USD 457.4 million
- 2.6 Historical and Forecast Reference Periods
- 2.6.1 Historical Period: 2018-2025
- 2.6.2 Base Year: 2025
- 2.6.3 Forecast Period: 2025-2035
- 2.7 Research Assumptions and Limitations
Chapter 3 Executive Summary
- 3.1 Market Snapshot and Key Findings
- 3.2 Base-Year Market Size, 2025
- 3.3 Forecast Market Size, 2035
- 3.4 Revenue and Volume Growth Outlook
- 3.5 Key Demand and Supply Indicators
- 3.6 Leading Market Segments
- 3.7 Fastest-Growing Market Opportunities
- 3.8 Regional Performance Highlights
- 3.9 Technology and Industry Transformation
- 3.10 Competitive Landscape Summary
- 3.11 Analyst View and Strategic Implications
Chapter 4 UK Data Center Containment Market Trends and Developments
- 4.1 Historical Industry Development, 2018-2025
- 4.2 Recent Market Trends and Developments
- 4.3 Demand and Customer Behavior Trends
- 4.4 Technology and Product Innovation
- 4.5 Artificial Intelligence, Automation and Digitalization
- 4.6 Local Manufacturing and Supply Chain Realignment
- 4.7 Industry Partnerships, Mergers and Acquisitions
- 4.8 Sustainability and Circular Economy Developments
- 4.9 Government and Private Sector Investment Trends
- 4.10 Emerging Business Models and Commercialization
- 4.11 Industry Developments and Announcements
Chapter 5 UK Data Center Containment Market Production, Supply and Demand Analysis
- 5.1 Demand Trend and Consumption Analysis, 2018-2025
- 5.2 Demand Forecast, 2025-2035
- 5.3 Production and Output Trend, 2018-2025
- 5.4 Production and Output Forecast, 2025-2035
- 5.5 Installed Capacity and Capacity Utilization
- 5.6 Company-Wise Production Plants and Statistics
- 5.6.1 Installed Production Capacity
- 5.6.2 Actual Production
- 5.6.3 Planned Capacity and Expansion Targets
- 5.7 Supply Chain Structure and Procurement Trends
- 5.8 Supply-Demand Gap and Bottlenecks
- 5.9 Import Dependence and Sourcing Structure
- 5.10 Contract Manufacturing and Outsourcing
- 5.11 Regional Supply and Demand Concentration
Chapter 6 UK Data Center Containment Market Pricing Analysis
- 6.1 Pricing Structure and Measurement
- 6.2 Historical Pricing Trends, 2018-2025
- 6.3 Pricing Outlook, 2025-2035
- 6.4 Average Selling Price and Unit Economics
- 6.5 Pricing by Product and Market Segment
- 6.6 Geographic Pricing Differences
- 6.7 Key Input, Energy, Labor and Logistics Costs
- 6.8 Contract Pricing and Purchasing Models
- 6.9 Pricing Sensitivity and Competitive Positioning
- 6.10 Price, Margin and Profitability Implications
Chapter 7 UK Data Center Containment Market Dynamics
- 7.1 Market Growth Drivers
- 7.1.1 Demand-Side Drivers
- 7.1.2 Technology and Innovation Drivers
- 7.1.3 Infrastructure and Investment Drivers
- 7.1.4 Regulatory and Policy Drivers
- 7.2 Market Restraints
- 7.2.1 Cost and Affordability Constraints
- 7.2.2 Technology and Adoption Barriers
- 7.2.3 Supply Chain and Operational Constraints
- 7.3 Market Challenges
- 7.3.1 Competitive Pressure and Margin Erosion
- 7.3.2 Skills, Infrastructure and Implementation Gaps
- 7.4 Emerging Market Opportunities
- 7.5 Market Dynamics Impact and Time-Horizon Assessment
Chapter 8 UK Data Center Containment Value Chain Analysis
- 8.1 Industry Value Chain Overview
- 8.2 Upstream Suppliers and Critical Inputs
- 8.3 Technology and Component Providers
- 8.4 Manufacturing or Service Delivery
- 8.5 Distribution, Channel Partners and Integrators
- 8.6 Downstream Applications and End Users
- 8.7 Value Addition and Profit Pools
- 8.8 Vertical Integration and Outsourcing
- 8.9 Supplier Concentration and Risk
- 8.10 Supply Chain Localization and Resilience
Chapter 9 UK Data Center Containment Market Regulations and Policies
- 9.1 Relevant Laws, Standards and Compliance Frameworks
- 9.2 Product, Service, Safety and Quality Requirements
- 9.3 Government Policies, Incentives and Subsidies
- 9.4 Imports, Exports and Trade Barriers
- 9.5 Public Procurement and Local Content Requirements
- 9.6 Environmental and Sustainability Compliance
- 9.7 Data Protection, AI and Cybersecurity Compliance
- 9.8 Upcoming Policy Changes and Market Implications
Chapter 10 UK Data Center Containment Market Hotspots and Opportunities
- 10.1 Market Opportunity Mapping and Growth Hotspots
- 10.2 High-Growth Applications and Customer Groups
- 10.3 Underserved Markets and White-Space Opportunities
- 10.4 Emerging Technology and Product Opportunities
- 10.5 New Capacity and Investment Hotspots
- 10.6 Market Entry and Expansion Opportunities
- 10.7 Distribution and Partnership Opportunities
- 10.8 Near-Term and Long-Term Commercial Potential
- 10.9 Opportunity Attractiveness and Execution Risks
Chapter 11 UK Data Center Containment Market Outlook, 2025-2035
- 11.1 Market Size and Analysis
- 11.1.1 Revenue (Market Measurement: 2025: USD 160.8 million → 2035: USD 457.4 million)
- 11.1.2 Market Volume and Quantity Sold
- 11.1.3 Historical Market Size, 2018-2025
- 11.1.4 Base-Year Market Size, 2025
- 11.2 Market Forecast, 2025-2035
- 11.2.1 Revenue Forecast to 2035
- 11.2.2 Volume Forecast to 2035
- 11.2.3 CAGR and Year-on-Year Growth
- 11.2.4 Incremental Revenue Opportunity
- 11.3 Forecast Assumptions and Scenario Analysis
- 11.3.1 Base-Case Forecast
- 11.3.2 Optimistic and Conservative Scenarios
- 11.3.3 Technology, Pricing and Policy Sensitivities
- 11.4 Market Attractiveness and Growth Outlook
Chapter 12 UK Data Center Containment Market Segmentation and Outlook
- 12.1 Segmentation Summary and Market Shares, 2025
- 12.2 Largest and Fastest-Growing Segments
- 12.3 By Type - Market Size and Forecast, 2025-2035
- 12.3.1 Segment Definition and Scope
- 12.3.2 Historical Market Size, 2018-2025
- 12.3.3 Revenue Forecast, 2025-2035
- 12.3.4 Volume Forecast, 2025-2035
- 12.3.5 Base-Year Market Share, 2025
- 12.3.6 Segment CAGR and Growth Drivers
- 12.3.7 Subsegment Market Size and Forecast
- 12.3.7.1 Hot Aisle Containment
- 12.3.7.2 Cold Aisle Containment
- 12.3.7.3 Rack-based Chimney Containment
- 12.3.7.4 In-row Cooling Containment
- 12.3.8 Subsegment Pricing and Adoption Trends
- 12.3.9 Leading Suppliers and Competition
- 12.3.10 Regional Demand and Opportunities
- 12.4 By Data Center Type - Market Size and Forecast, 2025-2035
- 12.4.1 Segment Definition and Scope
- 12.4.2 Historical Market Size, 2018-2025
- 12.4.3 Revenue Forecast, 2025-2035
- 12.4.4 Volume Forecast, 2025-2035
- 12.4.5 Base-Year Market Share, 2025
- 12.4.6 Segment CAGR and Growth Drivers
- 12.4.7 Subsegment Market Size and Forecast
- 12.4.7.1 Colocation Data Center
- 12.4.7.2 Hyperscale Data Center
- 12.4.7.3 Enterprise Data Center
- 12.4.7.4 Cloud Data Center
- 12.4.7.5 Others
- 12.4.8 Subsegment Pricing and Adoption Trends
- 12.4.9 Leading Suppliers and Competition
- 12.4.10 Regional Demand and Opportunities
- 12.5 By Arrangement - Market Size and Forecast, 2025-2035
- 12.5.1 Segment Definition and Scope
- 12.5.2 Historical Market Size, 2018-2025
- 12.5.3 Revenue Forecast, 2025-2035
- 12.5.4 Volume Forecast, 2025-2035
- 12.5.5 Base-Year Market Share, 2025
- 12.5.6 Segment CAGR and Growth Drivers
- 12.5.7 Subsegment Market Size and Forecast
- 12.5.7.1 Modular Containment
- 12.5.7.2 Rigid Containment
- 12.5.7.3 Hybrid Containment
- 12.5.7.4 Others
- 12.5.8 Subsegment Pricing and Adoption Trends
- 12.5.9 Leading Suppliers and Competition
- 12.5.10 Regional Demand and Opportunities
- 12.6 Segment Growth Comparison
- 12.7 Segment Attractiveness and Priority Matrix
Chapter 13 UK Data Center Containment Geographic Market Outlook, 2025-2035
- 13.1 Domestic Market Distribution and Demand Clusters
- 13.2 State- or Province-Wise Market Size and Forecast, 2025-2035
- 13.3 City and Metropolitan Market Outlook
- 13.4 Industrial, Manufacturing and Commercial Clusters
- 13.5 Geographic Concentration of Key End Users
- 13.6 Local Pricing and Purchasing Differences
- 13.7 Domestic Production Facilities and Capacity Map
- 13.8 Local Infrastructure and Project Pipeline
- 13.9 State-Level Policy and Incentive Differences
- 13.10 Subnational Investment Hotspots and Opportunities
- 13.11 Distribution and Logistics Networks
- 13.12 Domestic Competitive Footprint
Chapter 14 UK Data Center Containment Technology, Innovation and Sustainability Outlook
- 14.1 Technology Landscape and Maturity
- 14.2 Product, Process and Service Innovation
- 14.3 AI, Automation and Digital Tools in the Industry
- 14.4 Technology Adoption and Performance Benchmarking
- 14.5 Innovation Pipeline and R&D Investment
- 14.6 Patent and Intellectual Property Trends
- 14.7 Energy Efficiency and Resource Management
- 14.8 Sustainability, Recycling and Circularity
- 14.9 Technology Roadmap, 2025-2035
- 14.10 Risks of Obsolescence and Technology Substitution
Chapter 15 UK Data Center Containment Market Key Strategic Imperatives
- 15.1 Growth and Market Entry Priorities
- 15.2 High-Return Products and Segments
- 15.3 Pricing, Profitability and Cost Optimization
- 15.4 Technology Investment and Product Differentiation
- 15.5 Supply Chain Localization and Resilience
- 15.6 Distribution and Customer Acquisition
- 15.7 Partnership, Acquisition and Capacity Strategy
- 15.8 Regional Expansion Priorities
- 15.9 Short-, Medium- and Long-Term Actions
Chapter 16 Competition Outlook
- 16.1 Industry Competition Characteristics
- 16.2 Market Structure and Concentration
- 16.3 Market Share and Competitive Positioning, 2025
- 16.4 Company-Wise Revenue and Product Benchmarking
- 16.5 Production and Service Capacity Benchmarking
- 16.6 Technology, Pricing and Differentiation
- 16.7 Regional Footprint and Distribution Strength
- 16.8 Mergers, Acquisitions and Strategic Alliances
- 16.9 New Entrants and Competitive Threats
- 16.10 Porter's Five Forces and Industry Attractiveness
- 16.11 Competitive Outlook, 2025-2035
Chapter 17 Company Profiles
- 17.1 Company Coverage and Selection Criteria
- 17.2 Schneider Electric SE
- 17.2.1 Business Description
- 17.2.2 Company Ownership and Geographic Presence
- 17.2.3 Product and Service Portfolio
- 17.2.4 Manufacturing and Operating Footprint
- 17.2.5 Production Capacity and Expansion Plans
- 17.2.6 Financial Performance and Investment
- 17.2.7 Market Share and Competitive Position
- 17.2.8 Technology and Innovation Capabilities
- 17.2.9 Strategic Alliances or Partnerships
- 17.2.10 Recent Developments
- 17.2.11 Growth Strategy and Outlook
- 17.3 Vertiv Holdings Co
- 17.4 Rittal GmbH & Co. KG
- 17.5 Legrand SA (Minkels)
- 17.6 Leviton Manufacturing Co. (PRISM DCS)
- 17.7 Eaton Corporation plc
- 17.8 STULZ GmbH
- 17.9 Modine Manufacturing Company (Airedale)
- 17.10 Cannon Technologies Ltd
- 17.11 EDP Europe Ltd (Eziblank)
- 17.12 Nubis Solutions Ltd
- 17.13 Other Relevant Market Participants
Note: Every listed company is profiled on the structure shown under the first company. The company list is preliminary and may change based on research findings, market developments, data availability and client requirements.
Chapter 18 Disclaimer
- 18.1 Research and Forecast Disclaimer
- 18.2 Data Source and Estimation Limitations
Note: The depth of individual sections depends on data availability for this market. Volume, capacity, trade and other unit-based metrics are included where applicable.

