
Still spring water anchors British drinking habits
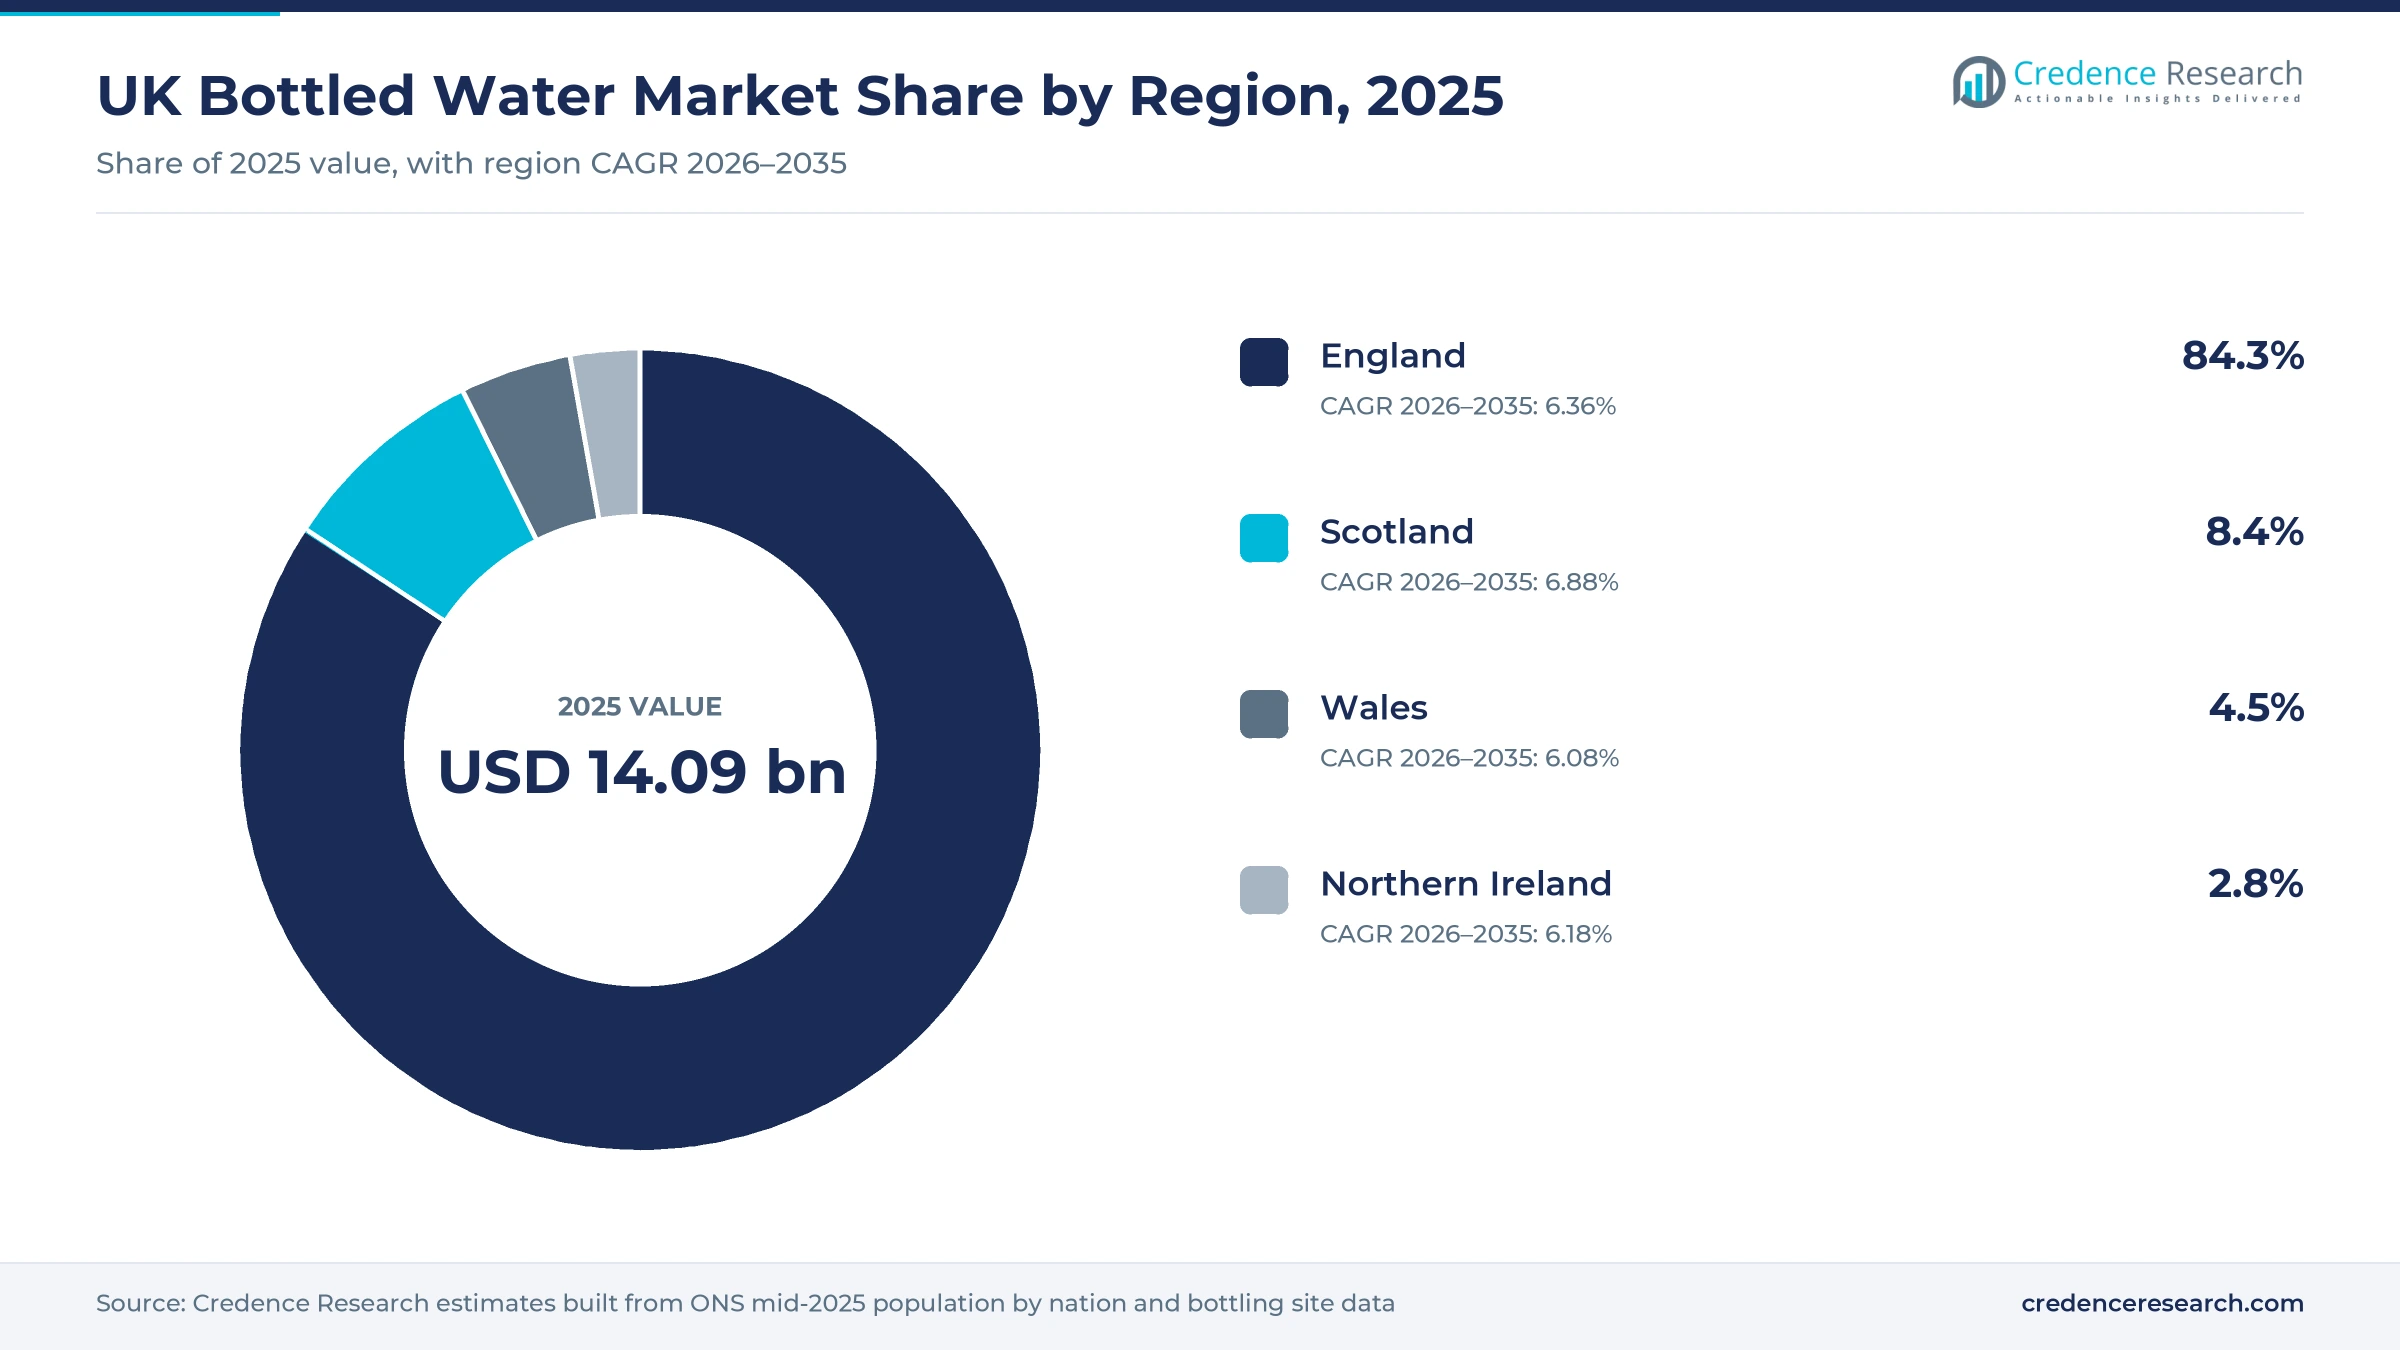
The U.K. bottled water market was valued at USD 6.10 billion in 2025 and is projected to increase from USD 6.49 billion in 2026 to USD 11.33 billion by 2035, registering a CAGR of 6.39% during 2026–2035. Demand comes from households that buy multipacks of still spring and mineral water, from commuters and shoppers who buy single bottles in meal deals, and from cafes, pubs, hotels and restaurants. England held the largest regional share, 84.3% in 2025, because it is home to most of the population and to large bottling sites in Derbyshire, North Yorkshire and Northumberland. Scotland is the fastest-growing region at 6.88% a year, as the main Perthshire bottler adds capacity and rail freight. The main regulatory change is a deposit return scheme for plastic bottles and cans that goes live in England and Northern Ireland in October 2027, while Scotland runs a similar scheme and Wales adds glass to its own. As a result, bottlers are redesigning labels, caps and recycled content while they add flavored and vitamin-enriched lines.
Which products and buyers does the U.K. estimate cover?
The estimate measures the value of bottled water sold in the United Kingdom, including still, sparkling, flavored and functional water from spring, natural mineral and purified sources. It counts PET bottles, glass bottles, cans, cartons and pouches sold through supermarkets, convenience stores, online grocers, vending machines and cafes, pubs, hotels and restaurants in England, Scotland, Wales and Northern Ireland.
The estimate excludes tap water, home filter jugs, plumbed-in office coolers, reusable bottles and exports. The value chain runs from protected springs and boreholes through bottling plants, rail and road hauliers and wholesalers to grocers, foodservice operators and the households, workers and travelers who drink the water.
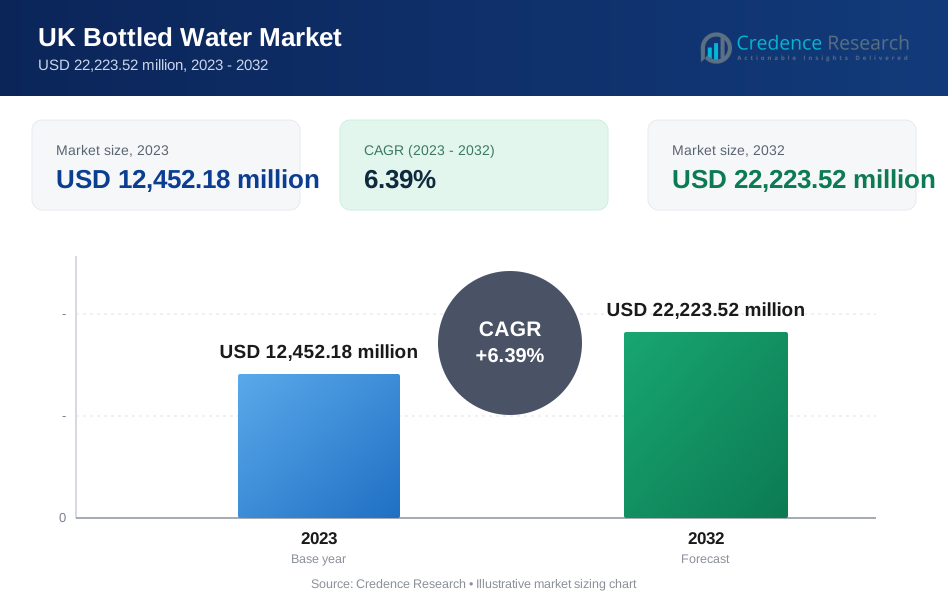
UK Bottled Water Market Insights
- The U.K. bottled water market was valued at USD 6.10 billion in 2025 and is projected to reach USD 11.33 billion by 2035, registering a CAGR of 6.39% during 2026–2035.
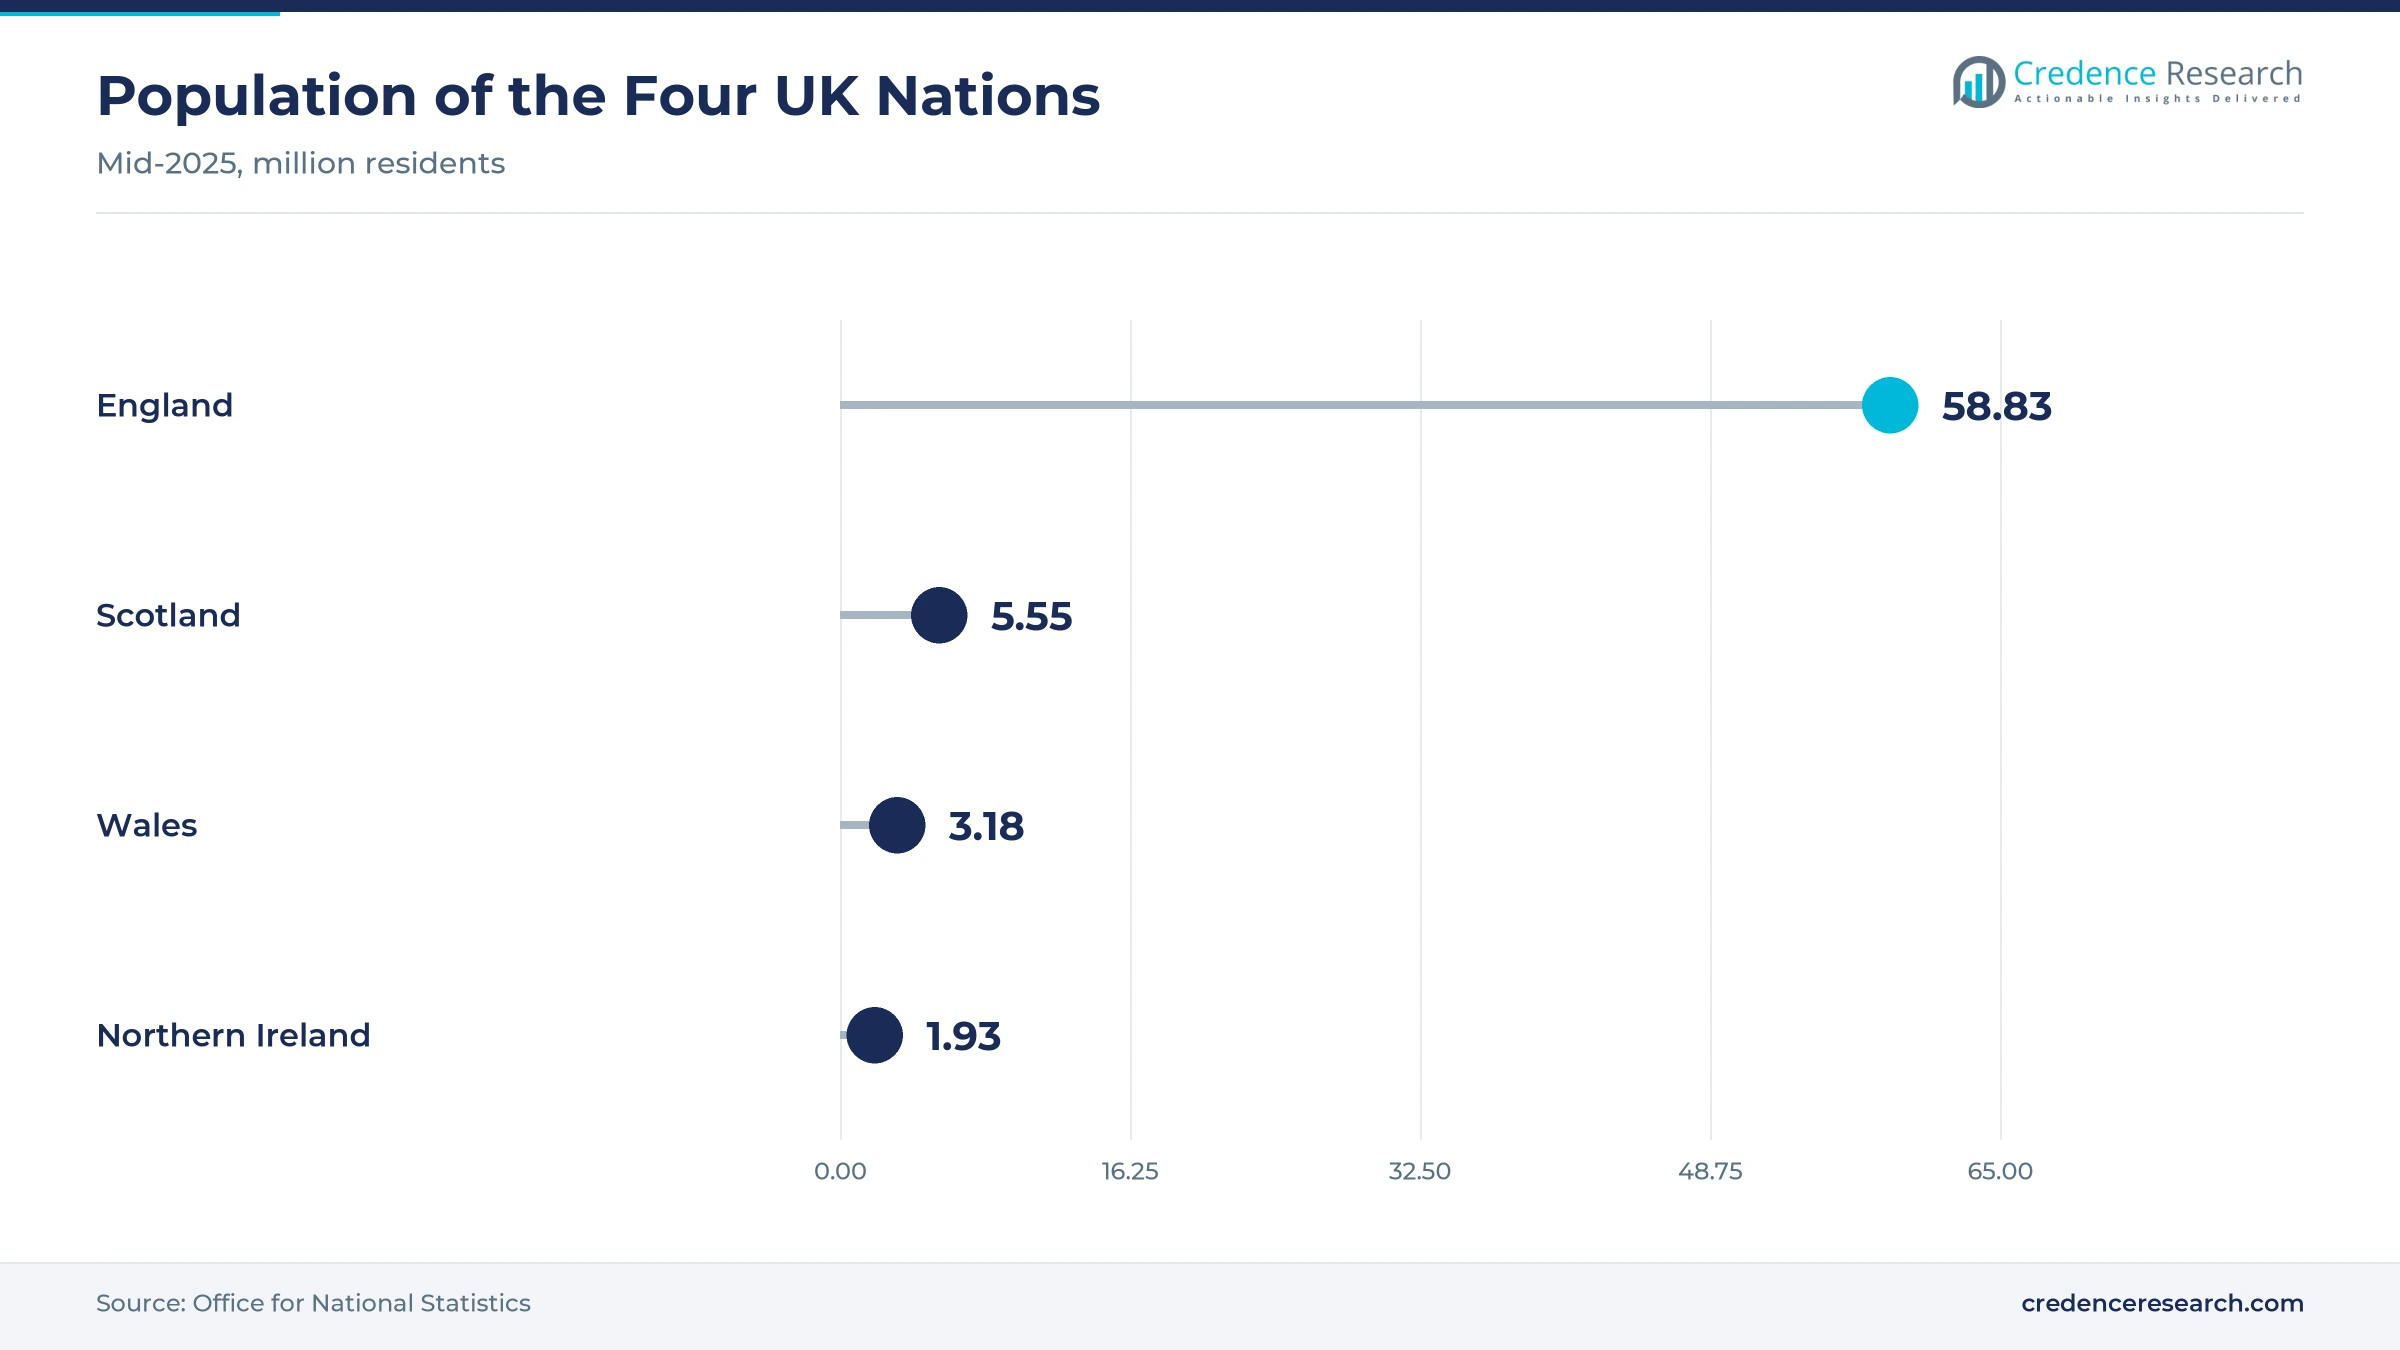
- England held 84.3% of 2025 value, because the Office for National Statistics counted 58.83 million of the 69.48 million U.K. residents there in mid-2025.
- Still water led product types with a 63.0% share of 2025 value, while functional water grows fastest at 8.57% a year to 2035.
- Take-home category volume rose by 390.4 million liters, or 12.8%, in the 2025 rankings of The Grocer, helped by the warmest U.K. summer on record.
- A flat 20 pence deposit on plastic bottles and cans from 150 ml to 3 liters starts in October 2027, with a 90% return target within three years.
Still water leads as functional waters grow fastest
Why does plain still water hold most of the value?
Based on product type, the market is categorized into still water, sparkling water, flavored water and functional water. Still Water led with 63.0% of 2025 value, because plain still water made up 65% of retail category sales in 2024, with value up 12.6% on 2023, according to Larder Magazine. Functional Water grows fastest at 8.57% a year, as brands add vitamins and minerals to familiar bottles. Danone launched Volvic Vitamin+ in 750 ml bottles at a GBP 2.20 suggested price on April 6, 2026, according to FoodBev Media. Nestle also rolled out a 400 ml Inspired by Buxton Peak range at GBP 1.75, The Grocer reported.
How does spring water keep the largest source share?
Based on water source, the market is categorized into spring water, natural mineral water and purified water. Spring Water led with 49.0% of 2025 value, because Highland Spring, now the largest brand, sold 306 million liters of Perthshire spring water and held 9.8% of retail volume, according to Larder Magazine. Radnor Hills also bought a Swansea site with a 40-acre spring source in Bannau Brycheiniog National Park in August 2023, according to Retail Times. Natural Mineral Water grows fastest at 6.67% a year, as Evian and Volvic together posted one of the largest brand value gains in the 2025 rankings of The Grocer.
Why do PET bottles carry most bottled sales?
Based on packaging, the market is categorized into PET bottles, glass bottles, cans and cartons and pouches. PET Bottles led with 86.0% of 2025 value, because light plastic bottles suit both multipacks and single-serve sales. Coca-Cola Europacific Partners spent GBP 7.5 million converting its Great Britain lines to attached caps, and its Morpeth site can fill 17.5 million unit cases of Glaceau Smartwater a year, according to The Manufacturer in June 2024. Cans grow fastest at 8.37% a year, as Evian launched its first sparkling water in a 330 ml aluminum can priced at 79 pence in Tesco stores, Better Retailing reported.
Where do British buyers purchase bottled water?
Based on distribution channel, the market is categorized into supermarkets and hypermarkets, convenience stores, foodservice and hospitality, online retail and vending machines and others. Supermarkets and Hypermarkets led with 46.0% of 2025 value, because large grocers sell most multipacks, and take-home category sales passed GBP 1.8 billion in 2024, up 10.8%, according to Larder Magazine. Online Retail grows fastest at 8.24% a year, as heavy cases suit home delivery. Online sales reached 28.0% of all Great Britain retail sales in October 2025, according to the Office for National Statistics retail series.
| Segment Group | Leading Sub-segment | Share, 2025 | Fastest-growing Sub-segment | CAGR, 2026–2035 |
|---|---|---|---|---|
| By Product Type | Still Water | 63.0% | Functional Water | 8.57% |
| By Water Source | Spring Water | 49.0% | Natural Mineral Water | 6.67% |
| By Packaging | PET Bottles | 86.0% | Cans | 8.37% |
| By Distribution Channel | Supermarkets and Hypermarkets | 46.0% | Online Retail | 8.24% |
Request a Free Sample
Fill in your details and we'll send you a free sample report.
- Sample data tables & charts
- Research methodology
Hot summers, low-sugar choices and new capacity
How did record summer heat lift bottled volumes?
Hot weather is the strongest short-term driver of bottled water demand, because people buy extra bottles for travel, sport and work when temperatures climb. The Met Office reported a mean U.K. temperature of 16.1 C from June 1 to Aug. 31, 2025, the warmest summer on record. Take-home category volume rose by 390.4 million liters, or 12.8%, in the 2025 rankings of The Grocer, which credited a longer hot spell than the year before. Highland Spring alone sold 37.8 million extra liters in the same rankings. In turn, still water led product types with 63.0% of 2025 value, and convenience stores gained impulse sales of chilled single bottles during the heat.
Why do low-sugar choices push shoppers toward water?
Shoppers are moving away from sugary drinks, and plain or lightly flavored water is the simplest replacement. More than seven in ten soft drinks sold in 2025 were low- or no-calorie, according to the British Soft Drinks Association report covered by Food Manufacture in July 2026. The same report put average soft drink consumption at 232 liters per person. Danone research cited by FoodBev Media found that 67% of U.K. soft drink consumers prefer a drink with health benefits over a supplement. Flavored water was already worth GBP 400 million at retail, according to Larder Magazine. As a result, demand for flavored and functional waters grows, and functional water grows fastest at 8.57% a year.
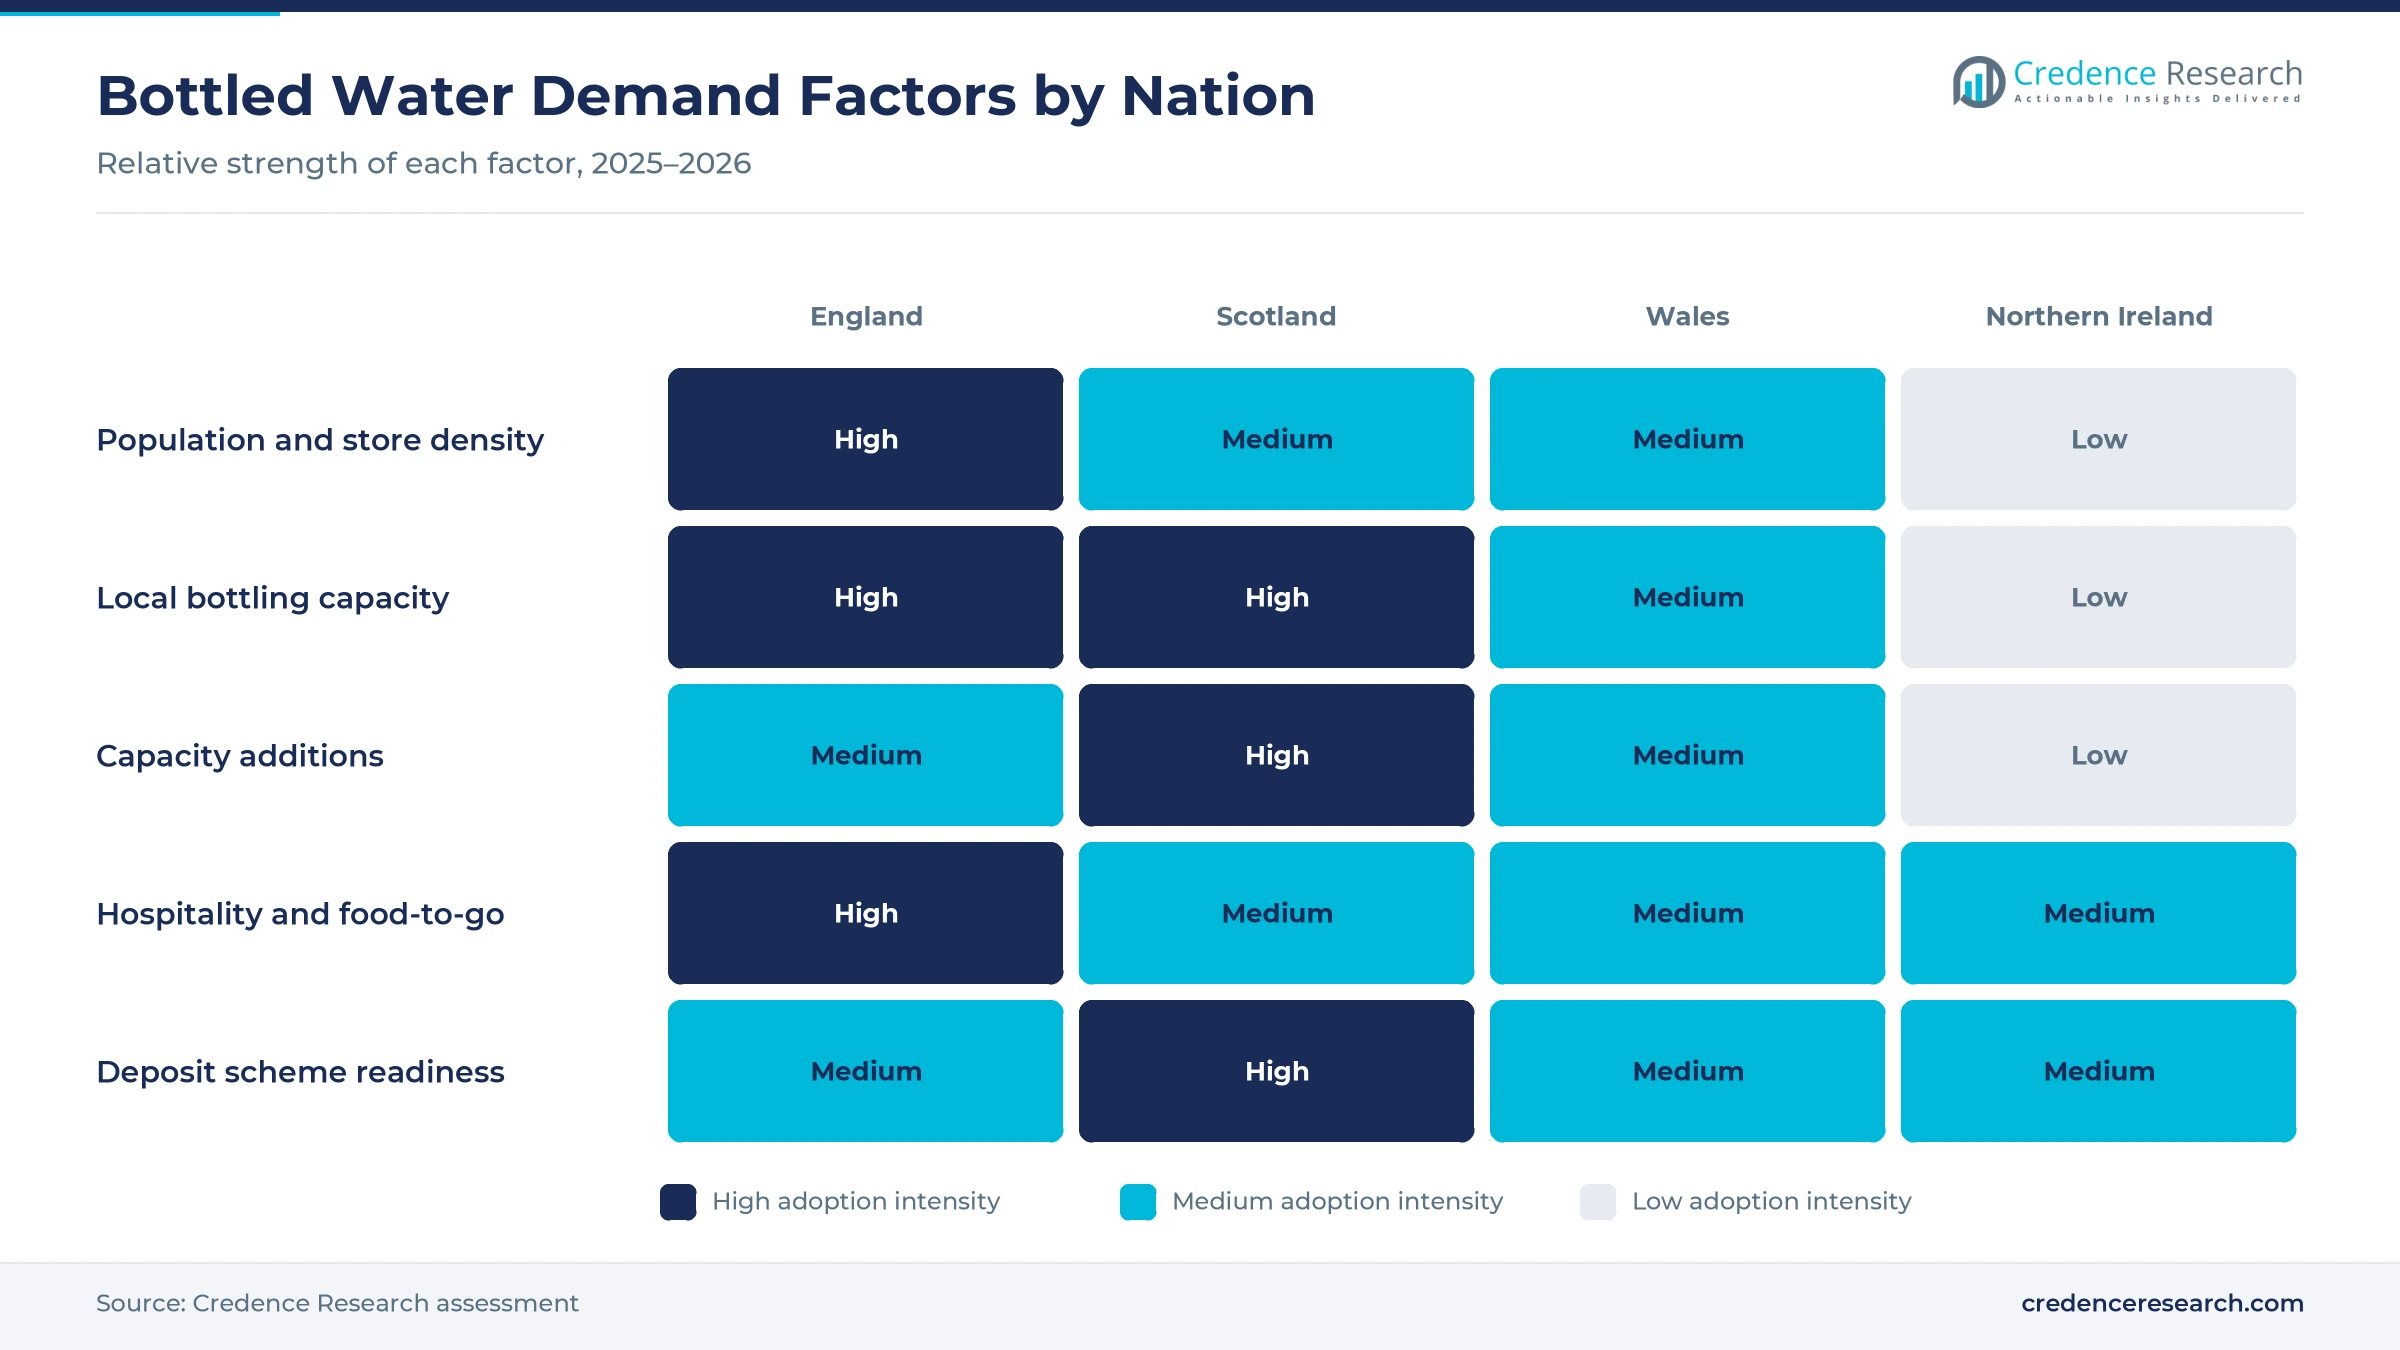
How does new domestic bottling capacity widen supply?
Leading bottlers are adding capacity near their own sources, which keeps shelves stocked in hot spells and cuts haulage. Highland Spring secured a GBP 50 million facility from Bank of Scotland and Barclays on March 10, 2025, according to Scottish Financial Review, to support new formats and a flavored still range. Its GBP 10 million investment at Blackford adds about 25% more capacity to meet demand, and a 7 MW solar farm should supply about 20% of the site's electricity, according to Larder Magazine. Radnor Hills, which makes more than 400 million drinks a year, added a Swansea plant in 2023. In turn, Scotland gains more new local supply than any other nation.
Why do a larger population and food-to-go sales add buyers?
A growing population and the habit of buying lunch on the go both add regular water drinkers. The U.K. population reached 69,483,900 in mid-2025, according to the Office for National Statistics, with England adding 227,600 residents in the year. Food-to-go consumption is projected to grow at 5% a year over five years, and 69% of consumers want healthier meal deals, according to FoodBev Media in April 2026. Across all channels, the British Soft Drinks Association put bottled water volume growth at 3.3% in 2025, supported by cafes, restaurants and other hospitality venues, according to Food Manufacture in July 2026. As a result, foodservice and hospitality demand holds a steady share of channel value through 2035.
Rail freight, vitamin waters and deposit-led recycling
How is the shift to rail freight changing bottled logistics?
Bottlers are shifting heavy loads from road to rail and on-site power, because water is bulky and freight is a large share of cost and emissions. Highland Spring now moves 48% of the water from its main bottling plant by rail, according to Larder Magazine. Its Blackford rail facility has removed more than 16,000 truck movements and carried more than 400 million liters in nearly three years, the same report said. Coca-Cola Europacific Partners also finished switching its Great Britain bottles to attached caps in spring 2024, according to The Manufacturer. In turn, low-carbon supply becomes a tender requirement for grocers and caterers, and PET bottles keep 86.0% of 2025 value.
Why is the rise of vitamin waters notable?
Functional waters are rising as brands add vitamins, minerals and caffeine to compete with soft drinks and supplements. Danone launched Volvic Vitamin+ in Recharge Raspberry and Active Peach flavors with magnesium and B vitamins on April 6, 2026, according to FoodBev Media. Nestle Waters & Premium Beverages U.K. rolled out Inspired by Buxton Peak in Focus, Immuno and Recharge variants through Ocado, Co-op and motorway forecourts, The Grocer reported. Highland Spring Apple & Blackcurrant also sold more than 7 million liters in the 2025 rankings of The Grocer. As a result, functional water grows fastest by product type, and these lines overlap with wider vitamin-enriched drinks sold across Europe.
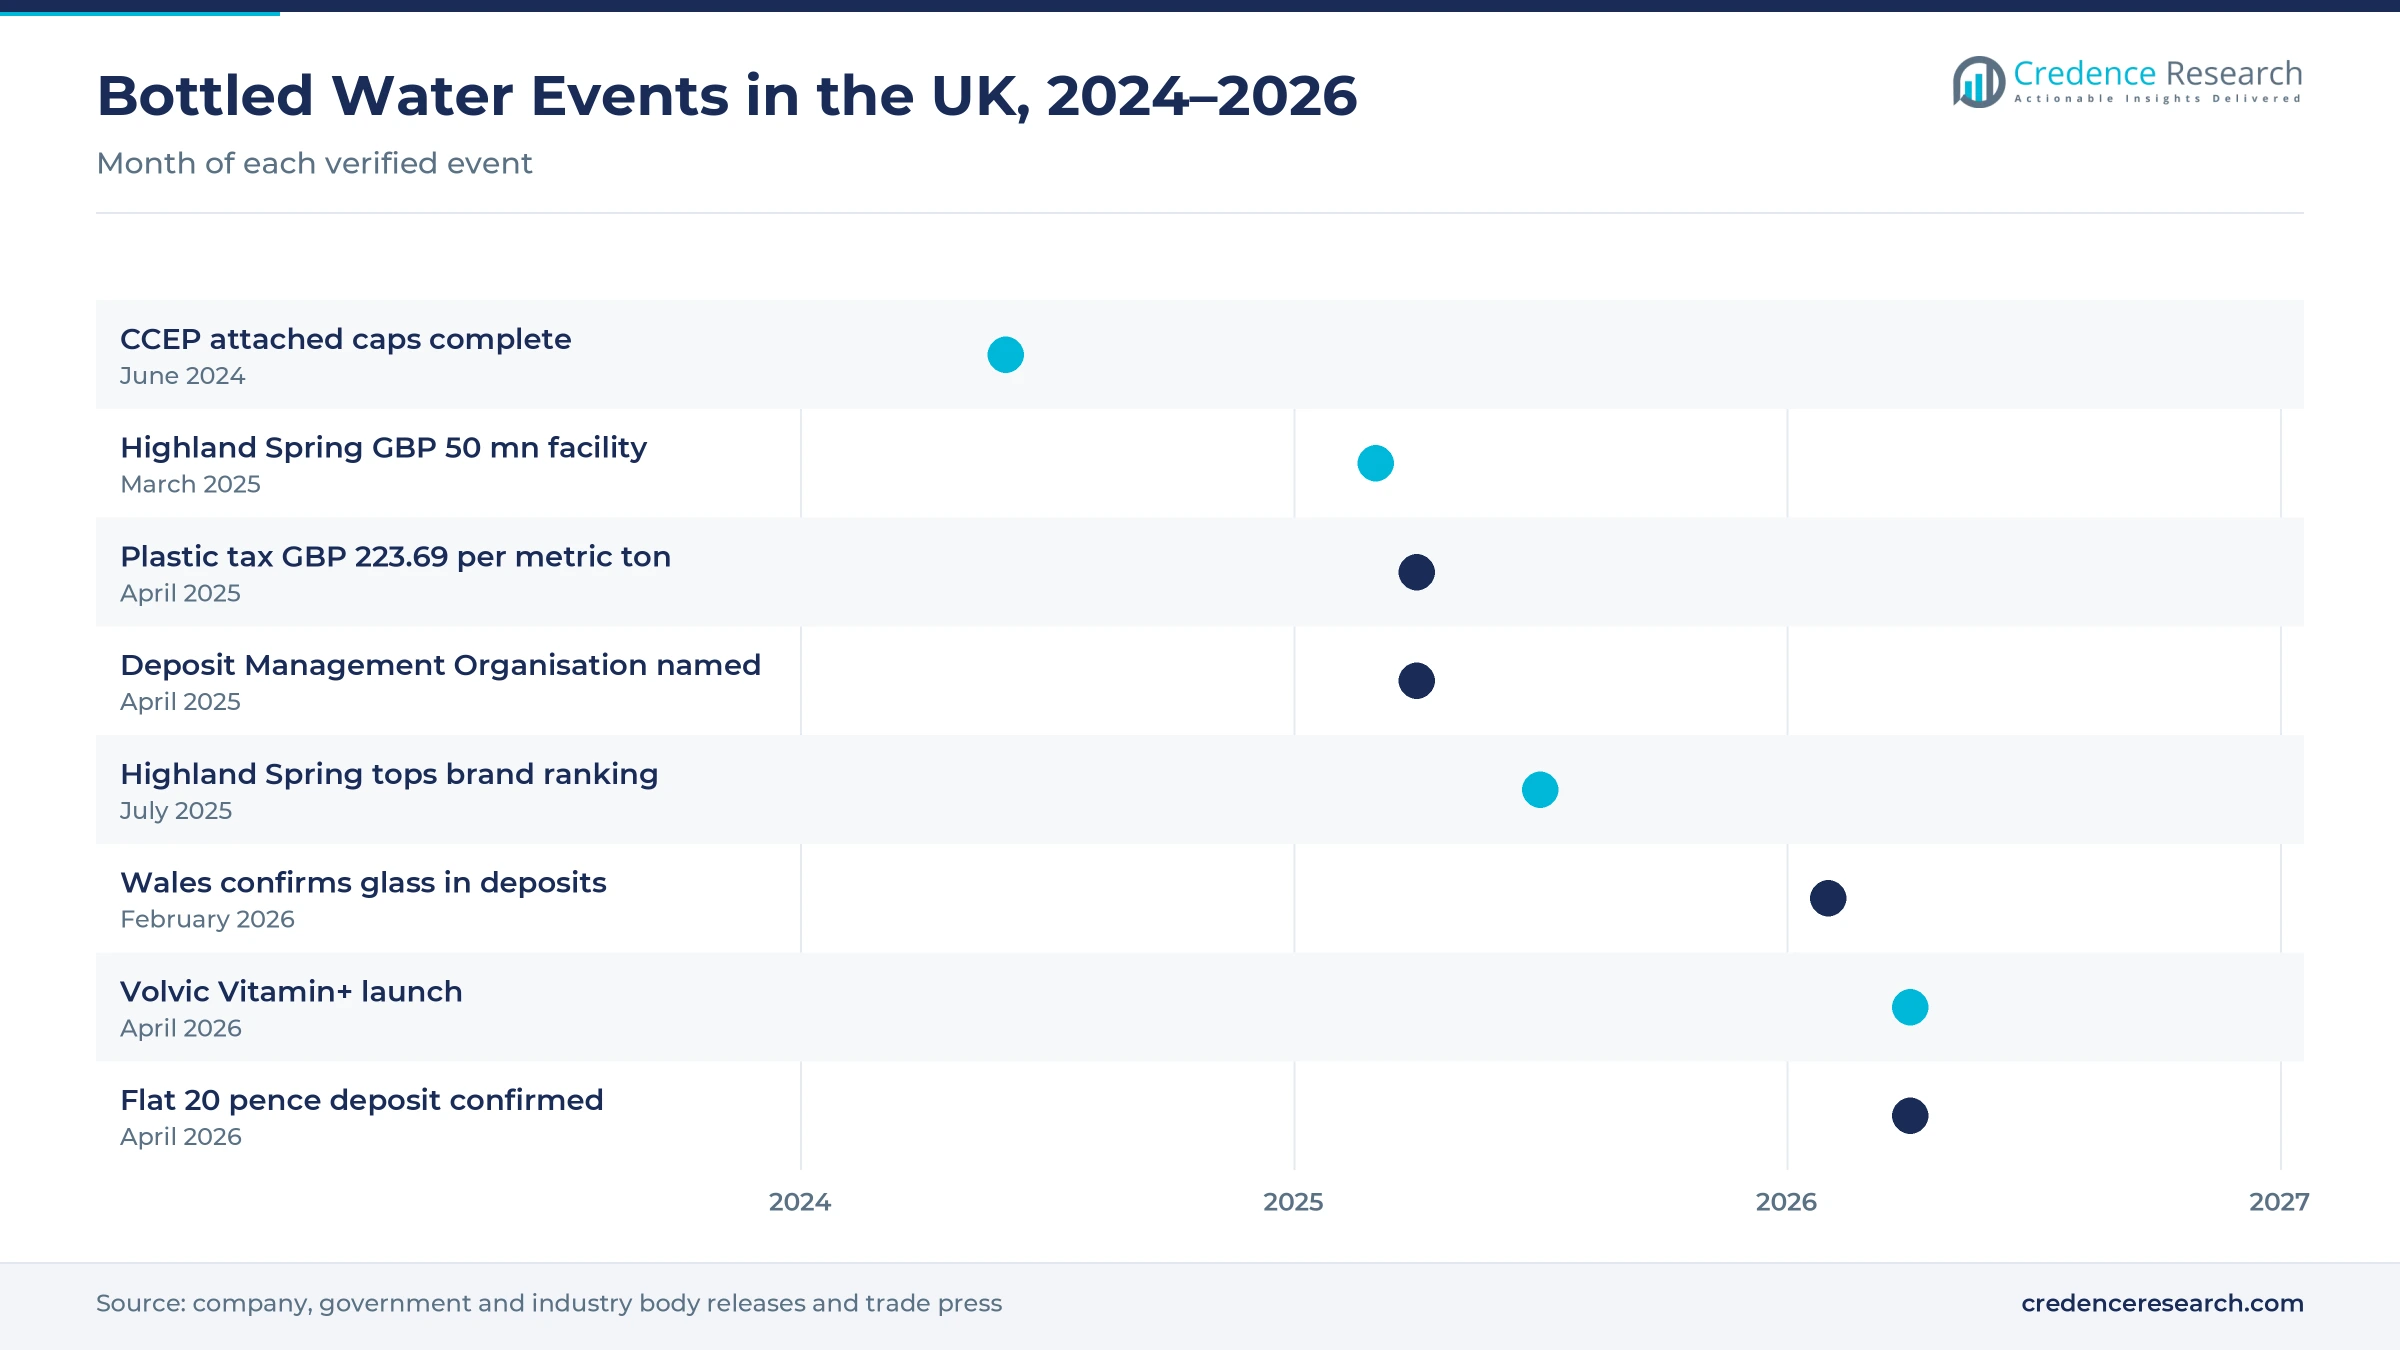
Can the deposit return scheme open a supply of food-grade rPET?
The deposit return scheme opens a reliable supply of clean bottles, which bottlers can turn into recycled PET for new water bottles. Exchange for Change confirmed a flat 20 pence deposit on PET, steel and aluminum containers from 150 ml to 3 liters, with a 90% return target within three years, according to Scottish Grocer on April 23, 2026. An estimated 6.5 billion bottles and cans are wasted each year in the U.K., according to Packaging Gateway. Plastic Packaging Tax also exempts packaging with at least 30% recycled plastic. As a result, bottlers that secure closed-loop rPET supply can cut tax and resin costs at the same time.
Is premium glass for hospitality an opening for growth?
Premium glass bottles give brands an opening in restaurants, hotels and pubs, where buyers pay more per liter than at the supermarket. Belu sells 330 ml and 750 ml U.K.-made glass bottles with at least 40% recycled glass from a mid-Wales source, and it has given more than GBP 6.5 million to WaterAid, according to its website. Wales will also include glass in its deposit scheme from October 2027 with a four-year period without a deposit on glass, according to Circular Online in February 2026. The British Soft Drinks Association said hospitality drove the 3.3% water volume gain in 2025. In turn, glass bottles grow faster than PET through 2035.
Packaging tax, deposit rules and planning limits
How does the plastic packaging tax raise bottle costs?
The Plastic Packaging Tax rose to GBP 223.69 per metric ton on April 1, 2025, and to GBP 228.82 per metric ton on April 1, 2026, on packaging with less than 30% recycled plastic. Because PET bottles carry most category value, every metric ton of virgin resin adds direct cost to small bottlers. As a result, firms without secure rPET supply face thinner margins on low-price multipacks. Many now raise recycled content above the threshold to protect margins.
Why do different deposit rules across the four nations add complexity?
Deposits start in October 2027, but Wales will include glass with a four-year period without a deposit on glass, according to Circular Online on Feb. 13, 2026, while the other nations cover only plastic bottles and cans. Because bottlers must register, label and report every container from 150 ml to 3 liters, smaller brands face new costs before the scheme begins. However, a flat 20 pence deposit on containers from 150 ml to 3 liters, confirmed by Exchange for Change in April 2026, limits pricing confusion at the shelf.
How do planning limits slow new source development?
Danone's plan to extend the Harrogate Spring Water plant into a 20-acre woodland, which would have felled between 500 and 1,000 trees, was rejected by the local council, The Grocer reported in late 2025. The company had promised more than 50 new jobs, according to Bdaily in October 2025. Because new sources need planning consent and local support, expansion near protected land is slow. As a result, bottlers tend to add capacity on existing sites instead.
Why does high tap water quality cap growth in take-home sales?
Public water supplies in England met standards in 99.97% of tests in 2024, according to The Water Report on July 13, 2025, citing the Drinking Water Inspectorate. Because tap water is safe and almost free, many households see bottled water as a convenience rather than a need. The Consumer Council for Water listed more than 12,000 Refill points in September 2018, and reusable flasks compete for daily drinking. As a result, bottlers focus on taste, sources and convenience.
England leads as Scotland adds bottling capacity
| Region | Value, 2025 (USD billion) | Share, 2025 | CAGR, 2026–2035 |
|---|---|---|---|
| England | 5.14 | 84.3% | 6.36% |
| Scotland | 0.51 | 8.4% | 6.88% |
| Wales | 0.27 | 4.5% | 6.08% |
| Northern Ireland | 0.17 | 2.8% | 6.18% |
How do population and large bottling sites keep England first?
England held 84.3% of 2025 value and grows at 6.36% a year, because it had 58,834,800 residents in mid-2025, according to the Office for National Statistics. Nestle bottles Buxton natural mineral water in Derbyshire, Danone bottles Harrogate Spring Water in North Yorkshire, and Coca-Cola Europacific Partners fills Glaceau Smartwater at Morpeth in Northumberland. As a result, England has the densest supply of stock for grocers, convenience chains and caterers, and it will move into the deposit scheme in October 2027.
Why does Scotland grow fastest among the four nations?
Scotland held 8.4% of 2025 value and grows fastest at 6.88% a year, because Highland Spring is adding about 25% more capacity at Blackford in Perthshire after a GBP 10 million investment, according to Larder Magazine. The company employs almost 500 people across the U.K., according to Scottish Financial Review in March 2025. Scotland had 5,545,500 residents in mid-2025, the Office for National Statistics reported. In turn, Scottish spring water supplies shelves across all four nations by rail and road.
How do Welsh sources and glass rules shape demand in Wales?
Wales held 4.5% of 2025 value and grows at 6.08% a year, the slowest of the four nations, because its population of 3,175,200 fell by 2,800 in the year to mid-2025, according to the Office for National Statistics. However, Radnor Hills bought a Swansea plant with a 40-acre source in 2023, and Belu draws its glass-bottled water from a mid-Wales source. Wales will also include glass in its deposit scheme, which suits premium glass suppliers to Welsh hotels and restaurants.
Why does Northern Ireland trail the national growth rate?
Northern Ireland held 2.8% of 2025 value and grows at 6.18% a year, because its population of 1,928,400 grew by only 600 people in the year to mid-2025, according to the Office for National Statistics. Northern Ireland will also join England in the deposit return scheme in October 2027, according to Packaging Gateway, which adds labeling work for suppliers that serve the province.
Brand rankings, launches and deposit rules, 2024 to 2026
| Development | Status and market relevance |
|---|---|
| In June 2024, Coca-Cola Europacific Partners completed the switch of its Great Britain bottles to attached caps at Morpeth. | GBP 7.5 million line conversion covering Glaceau Smartwater |
| In March 2025, Highland Spring Group secured a GBP 50 million facility from Bank of Scotland and Barclays. | Funds new formats and a flavored still range |
| In July 2025, Highland Spring became the number one bottled water brand in the U.K. by value and volume. | 306 million liters and 11% retail value share |
| In April 2026, Danone launched Volvic Vitamin+ in the U.K. and Ireland in 750 ml bottles. | Entry into functional water with meal deal listings |
| In April 2026, Exchange for Change confirmed a flat 20 pence deposit for bottles and cans. | Applies across all four nations from October 2027 |
Recycled PET, attached caps and low-carbon bottling
- Recycled PET preforms cut virgin resin use and keep bottles above the 30% recycled threshold of the Plastic Packaging Tax.
- Attached caps keep the closure tied to the bottle, so caps return with containers to recycling and deposit points.
- Source-side bottling lines fill spring and mineral water at protected sources such as Blackford, Buxton and Harrogate.
- Rail freight terminals move full pallets from plant to distribution centers, as Highland Spring does for 48% of its main-site volume.
- Lightweight glass and aluminum cans give premium and sparkling waters recyclable formats, which link bottlers to the wider packaging supply chain.
Need a Custom Version of This Report?
Tailor the scope, geography, or segments to your exact requirements.
- Custom geography or segment scope
- Direct access to our analyst team
Owned sources and bottling plants separate the leaders
Competition centers on owned sources, bottling capacity near buyers, grocery listings and brand strength in meal deals. Highland Spring Group became the number one brand by value and volume in July 2025, with an 11% retail value share, according to Larder Magazine. Danone competes with Evian, Volvic and Harrogate Spring Water, and it entered functional water with Volvic Vitamin+ in April 2026. Nestle Waters & Premium Beverages U.K. sells Buxton natural mineral water and the Inspired by Buxton Peak range. Coca-Cola Europacific Partners fills Glaceau Smartwater at Morpeth, while Radnor Hills and Belu serve grocers and hospitality buyers from Welsh sources. As a result, companies that own sources and run their own plants win the most shelf space.
Companies profiled and their roles in this market
| Company | Type | Role in the market |
|---|---|---|
| Highland Spring Group | Spring water bottler | Number one brand by value and volume since July 2025; Blackford rail facility |
| Danone | Mineral and spring water owner | Evian, Volvic and Harrogate Spring Water; Volvic Vitamin+ launched April 2026 |
| Nestle Waters & Premium Beverages U.K. | Mineral water bottler | Buxton natural mineral water; Inspired by Buxton Peak range |
| Coca-Cola Europacific Partners | Bottler | Glaceau Smartwater at Morpeth; attached caps since 2024 |
| Radnor Hills | Spring water and soft drinks bottler | Swansea site and 40-acre source acquired in 2023 |
| Belu Water | Glass-bottled water supplier | U.K.-made glass bottles for hospitality; net profits to WaterAid |
Credence Research view on British packaged water
Credence Research's view is that the U.K. bottled water market will keep adding value as hotter summers, low-sugar choices and food-to-go sales lift volume, while functional and premium formats raise value per liter. Still water keeps the largest product share, while functional water gains ground through 2035. England stays the largest region, while Scotland grows fastest as Highland Spring adds capacity. The deposit return scheme of October 2027 will test smaller U.K. bottled water suppliers, but it should also secure clean rPET supply for the companies that prepare early.
Official statistics and company data anchor the model
The report uses 2025 as the base year on a calendar basis, and market values come from the Credence Research model. The earlier 2023 estimate was taken to 2025 at its own growth rate, checked against take-home retail sales, out-of-home channel value and total soft drinks value, and replaced with a new Credence Research estimate. Segment splits and shares and growth rates by nation are Credence Research estimates. Sources used are Office for National Statistics data, government releases, industry association reports, company releases and trade press, and no interviews or surveys were used.
Functional formats and recycled packs carry value
The U.K. bottled water market is expected to reach USD 11.33 billion by 2035, a 6.39% CAGR during 2026–2035, as functional waters, premium glass and online delivery add value beyond the standard multipack. Demand growth should hold through 2027 as Highland Spring and other bottlers add capacity ahead of hot summers. After that, the deposit return scheme and recycled content rules will set the pace. A cool summer or higher resin costs would slow value growth, while steady supplies of clean rPET from returned bottles would lower packaging costs for bottlers.
Frequently Asked Questions
How big is the U.K. bottled water market?
Which product type leads bottled water in the U.K.?
Which region leads the U.K. market?
What are the bottled water sales statistics for the U.K.?
Which bottled water companies and brands lead in the U.K.?
What are the main bottled water market trends in the U.K.?
How is the U.K. bottled water market segmented?
What are the main challenges for the market?
Table of Content
Chapter 1 Market Segmentation
- 1.1 Segmentation Framework
- 1.1.1 Product and Service Classification
- 1.1.2 Application and End-Use Classification
- 1.1.3 Technology and Solution Classification
- 1.1.4 Customer and Distribution Channel Classification
- 1.1.5 Geographic Segmentation
- 1.1.6 Market Segment Definitions and Boundaries
- 1.2 By Product Type
- 1.2.1 Still Water
- 1.2.2 Sparkling Water
- 1.2.3 Flavored Water
- 1.2.4 Functional Water
- 1.3 By Water Source
- 1.3.1 Spring Water
- 1.3.2 Natural Mineral Water
- 1.3.3 Purified Water
- 1.4 By Packaging
- 1.4.1 PET Bottles
- 1.4.2 Glass Bottles
- 1.4.3 Cans
- 1.4.4 Cartons and Pouches
Chapter 2 Introduction
- 2.1 Report Objectives and Scope
- 2.2 Product Definition and Industry Terminology
- 2.3 Market Inclusions and Exclusions
- 2.4 Research Process
- 2.4.1 Primary Research and Expert Interviews
- 2.4.2 Secondary Research and Source Review
- 2.4.3 Top-Down and Bottom-Up Estimation
- 2.4.4 Data Triangulation and Verification
- 2.5 Market Size Measurement Basis
- 2.5.1 2025: USD 6.10 billion → 2035: USD 11.33 billion
- 2.6 Historical and Forecast Reference Periods
- 2.6.1 Historical Period: 2018-2025
- 2.6.2 Base Year: 2025
- 2.6.3 Forecast Period: 2025-2035
- 2.7 Research Assumptions and Limitations
Chapter 3 Executive Summary
- 3.1 Market Snapshot and Key Findings
- 3.2 Base-Year Market Size, 2025
- 3.3 Forecast Market Size, 2035
- 3.4 Revenue and Volume Growth Outlook
- 3.5 Key Demand and Supply Indicators
- 3.6 Leading Market Segments
- 3.7 Fastest-Growing Market Opportunities
- 3.8 Regional Performance Highlights
- 3.9 Technology and Industry Transformation
- 3.10 Competitive Landscape Summary
- 3.11 Analyst View and Strategic Implications
Chapter 4 UK Bottled Water Market Trends and Developments
- 4.1 Historical Industry Development, 2018-2025
- 4.2 Recent Market Trends and Developments
- 4.3 Demand and Customer Behavior Trends
- 4.4 Technology and Product Innovation
- 4.5 Artificial Intelligence, Automation and Digitalization
- 4.6 Local Manufacturing and Supply Chain Realignment
- 4.7 Industry Partnerships, Mergers and Acquisitions
- 4.8 Sustainability and Circular Economy Developments
- 4.9 Government and Private Sector Investment Trends
- 4.10 Emerging Business Models and Commercialization
- 4.11 Industry Developments and Announcements
Chapter 5 UK Bottled Water Market Production, Supply and Demand Analysis
- 5.1 Demand Trend and Consumption Analysis, 2018-2025
- 5.2 Demand Forecast, 2025-2035
- 5.3 Production and Output Trend, 2018-2025
- 5.4 Production and Output Forecast, 2025-2035
- 5.5 Installed Capacity and Capacity Utilization
- 5.6 Company-Wise Production Plants and Statistics
- 5.6.1 Installed Production Capacity
- 5.6.2 Actual Production
- 5.6.3 Planned Capacity and Expansion Targets
- 5.7 Supply Chain Structure and Procurement Trends
- 5.8 Supply-Demand Gap and Bottlenecks
- 5.9 Import Dependence and Sourcing Structure
- 5.10 Contract Manufacturing and Outsourcing
- 5.11 Regional Supply and Demand Concentration
Chapter 6 UK Bottled Water Market Pricing Analysis
- 6.1 Pricing Structure and Measurement
- 6.2 Historical Pricing Trends, 2018-2025
- 6.3 Pricing Outlook, 2025-2035
- 6.4 Average Selling Price and Unit Economics
- 6.5 Pricing by Product and Market Segment
- 6.6 Geographic Pricing Differences
- 6.7 Key Input, Energy, Labor and Logistics Costs
- 6.8 Contract Pricing and Purchasing Models
- 6.9 Pricing Sensitivity and Competitive Positioning
- 6.10 Price, Margin and Profitability Implications
Chapter 7 UK Bottled Water Market Dynamics
- 7.1 Market Growth Drivers
- 7.1.1 Demand-Side Drivers
- 7.1.2 Technology and Innovation Drivers
- 7.1.3 Infrastructure and Investment Drivers
- 7.1.4 Regulatory and Policy Drivers
- 7.2 Market Restraints
- 7.2.1 Cost and Affordability Constraints
- 7.2.2 Technology and Adoption Barriers
- 7.2.3 Supply Chain and Operational Constraints
- 7.3 Market Challenges
- 7.3.1 Competitive Pressure and Margin Erosion
- 7.3.2 Skills, Infrastructure and Implementation Gaps
- 7.4 Emerging Market Opportunities
- 7.5 Market Dynamics Impact and Time-Horizon Assessment
Chapter 8 UK Bottled Water Value Chain Analysis
- 8.1 Industry Value Chain Overview
- 8.2 Upstream Suppliers and Critical Inputs
- 8.3 Technology and Component Providers
- 8.4 Manufacturing or Service Delivery
- 8.5 Distribution, Channel Partners and Integrators
- 8.6 Downstream Applications and End Users
- 8.7 Value Addition and Profit Pools
- 8.8 Vertical Integration and Outsourcing
- 8.9 Supplier Concentration and Risk
- 8.10 Supply Chain Localization and Resilience
Chapter 9 UK Bottled Water Market Regulations and Policies
- 9.1 Relevant Laws, Standards and Compliance Frameworks
- 9.2 Product, Service, Safety and Quality Requirements
- 9.3 Government Policies, Incentives and Subsidies
- 9.4 Imports, Exports and Trade Barriers
- 9.5 Public Procurement and Local Content Requirements
- 9.6 Environmental and Sustainability Compliance
- 9.7 Upcoming Policy Changes and Market Implications
Chapter 10 UK Bottled Water Market Hotspots and Opportunities
- 10.1 Market Opportunity Mapping and Growth Hotspots
- 10.2 High-Growth Applications and Customer Groups
- 10.3 Underserved Markets and White-Space Opportunities
- 10.4 Emerging Technology and Product Opportunities
- 10.5 New Capacity and Investment Hotspots
- 10.6 Market Entry and Expansion Opportunities
- 10.7 Distribution and Partnership Opportunities
- 10.8 Near-Term and Long-Term Commercial Potential
- 10.9 Opportunity Attractiveness and Execution Risks
Chapter 11 UK Bottled Water Market Outlook, 2025-2035
- 11.1 Market Size and Analysis
- 11.1.1 Revenue (Market Measurement: 2025: USD 6.10 billion → 2035: USD 11.33 billion)
- 11.1.2 Market Volume and Quantity Sold
- 11.1.3 Historical Market Size, 2018-2025
- 11.1.4 Base-Year Market Size, 2025
- 11.2 Market Forecast, 2025-2035
- 11.2.1 Revenue Forecast to 2035
- 11.2.2 Volume Forecast to 2035
- 11.2.3 CAGR and Year-on-Year Growth
- 11.2.4 Incremental Revenue Opportunity
- 11.3 Forecast Assumptions and Scenario Analysis
- 11.3.1 Base-Case Forecast
- 11.3.2 Optimistic and Conservative Scenarios
- 11.3.3 Technology, Pricing and Policy Sensitivities
- 11.4 Market Attractiveness and Growth Outlook
Chapter 12 UK Bottled Water Market Segmentation and Outlook
- 12.1 Segmentation Summary and Market Shares, 2025
- 12.2 Largest and Fastest-Growing Segments
- 12.3 By Product Type - Market Size and Forecast, 2025-2035
- 12.3.1 Segment Definition and Scope
- 12.3.2 Historical Market Size, 2018-2025
- 12.3.3 Revenue Forecast, 2025-2035
- 12.3.4 Volume Forecast, 2025-2035
- 12.3.5 Base-Year Market Share, 2025
- 12.3.6 Segment CAGR and Growth Drivers
- 12.3.7 Subsegment Market Size and Forecast
- 12.3.7.1 Still Water
- 12.3.7.2 Sparkling Water
- 12.3.7.3 Flavored Water
- 12.3.7.4 Functional Water
- 12.3.8 Subsegment Pricing and Adoption Trends
- 12.3.9 Leading Suppliers and Competition
- 12.3.10 Regional Demand and Opportunities
- 12.4 By Water Source - Market Size and Forecast, 2025-2035
- 12.4.1 Segment Definition and Scope
- 12.4.2 Historical Market Size, 2018-2025
- 12.4.3 Revenue Forecast, 2025-2035
- 12.4.4 Volume Forecast, 2025-2035
- 12.4.5 Base-Year Market Share, 2025
- 12.4.6 Segment CAGR and Growth Drivers
- 12.4.7 Subsegment Market Size and Forecast
- 12.4.7.1 Spring Water
- 12.4.7.2 Natural Mineral Water
- 12.4.7.3 Purified Water
- 12.4.8 Subsegment Pricing and Adoption Trends
- 12.4.9 Leading Suppliers and Competition
- 12.4.10 Regional Demand and Opportunities
- 12.5 By Packaging - Market Size and Forecast, 2025-2035
- 12.5.1 Segment Definition and Scope
- 12.5.2 Historical Market Size, 2018-2025
- 12.5.3 Revenue Forecast, 2025-2035
- 12.5.4 Volume Forecast, 2025-2035
- 12.5.5 Base-Year Market Share, 2025
- 12.5.6 Segment CAGR and Growth Drivers
- 12.5.7 Subsegment Market Size and Forecast
- 12.5.7.1 PET Bottles
- 12.5.7.2 Glass Bottles
- 12.5.7.3 Cans
- 12.5.7.4 Cartons and Pouches
- 12.5.8 Subsegment Pricing and Adoption Trends
- 12.5.9 Leading Suppliers and Competition
- 12.5.10 Regional Demand and Opportunities
- 12.6 Segment Growth Comparison
- 12.7 Segment Attractiveness and Priority Matrix
Chapter 13 UK Bottled Water Geographic Market Outlook, 2025-2035
- 13.1 Domestic Market Distribution and Demand Clusters
- 13.2 State- or Province-Wise Market Size and Forecast, 2025-2035
- 13.3 City and Metropolitan Market Outlook
- 13.4 Industrial, Manufacturing and Commercial Clusters
- 13.5 Geographic Concentration of Key End Users
- 13.6 Local Pricing and Purchasing Differences
- 13.7 Domestic Production Facilities and Capacity Map
- 13.8 Local Infrastructure and Project Pipeline
- 13.9 State-Level Policy and Incentive Differences
- 13.10 Subnational Investment Hotspots and Opportunities
- 13.11 Distribution and Logistics Networks
- 13.12 Domestic Competitive Footprint
Chapter 14 UK Bottled Water Technology, Innovation and Sustainability Outlook
- 14.1 Technology Landscape and Maturity
- 14.2 Product, Process and Service Innovation
- 14.3 AI, Automation and Digital Tools in the Industry
- 14.4 Technology Adoption and Performance Benchmarking
- 14.5 Innovation Pipeline and R&D Investment
- 14.6 Patent and Intellectual Property Trends
- 14.7 Energy Efficiency and Resource Management
- 14.8 Sustainability, Recycling and Circularity
- 14.9 Technology Roadmap, 2025-2035
- 14.10 Risks of Obsolescence and Technology Substitution
Chapter 15 UK Bottled Water Market Key Strategic Imperatives
- 15.1 Growth and Market Entry Priorities
- 15.2 High-Return Products and Segments
- 15.3 Pricing, Profitability and Cost Optimization
- 15.4 Technology Investment and Product Differentiation
- 15.5 Supply Chain Localization and Resilience
- 15.6 Distribution and Customer Acquisition
- 15.7 Partnership, Acquisition and Capacity Strategy
- 15.8 Regional Expansion Priorities
- 15.9 Short-, Medium- and Long-Term Actions
Chapter 16 Competition Outlook
- 16.1 Industry Competition Characteristics
- 16.2 Market Structure and Concentration
- 16.3 Market Share and Competitive Positioning, 2025
- 16.4 Company-Wise Revenue and Product Benchmarking
- 16.5 Production and Service Capacity Benchmarking
- 16.6 Technology, Pricing and Differentiation
- 16.7 Regional Footprint and Distribution Strength
- 16.8 Mergers, Acquisitions and Strategic Alliances
- 16.9 New Entrants and Competitive Threats
- 16.10 Porter's Five Forces and Industry Attractiveness
- 16.11 Competitive Outlook, 2025-2035
Chapter 17 Company Profiles
- 17.1 Company Coverage and Selection Criteria
- 17.2 Highland Spring Group
- 17.2.1 Business Description
- 17.2.2 Company Ownership and Geographic Presence
- 17.2.3 Product and Service Portfolio
- 17.2.4 Manufacturing and Operating Footprint
- 17.2.5 Production Capacity and Expansion Plans
- 17.2.6 Financial Performance and Investment
- 17.2.7 Market Share and Competitive Position
- 17.2.8 Technology and Innovation Capabilities
- 17.2.9 Strategic Alliances or Partnerships
- 17.2.10 Recent Developments
- 17.2.11 Growth Strategy and Outlook
- 17.3 Danone (Evian, Volvic, Harrogate Spring Water)
- 17.4 Nestle Waters & Premium Beverages UK (Buxton)
- 17.5 Coca-Cola Europacific Partners (Glaceau Smartwater)
- 17.6 Radnor Hills
- 17.7 Belu Water
- 17.8 Other Relevant Market Participants
Note: Every listed company is profiled on the structure shown under the first company. The company list is preliminary and may change based on research findings, market developments, data availability and client requirements.
Chapter 18 Disclaimer
- 18.1 Research and Forecast Disclaimer
- 18.2 Data Source and Estimation Limitations
Note: The depth of individual sections depends on data availability for this market. Volume, capacity, trade and other unit-based metrics are included where applicable.

