Mowers lead as batteries and robots reshape American yards
The U.S. gardening tools market was valued at USD 12.38 billion in 2025 and is projected to increase from USD 12.91 billion in 2026 to USD 18.86 billion by 2035, registering a CAGR of 4.30% during 2026–2035. Demand comes from about one million new single-family homes a year, landscaping crews that maintain commercial grounds, and households replacing gas mowers and trimmers with battery models. The South held the largest regional share, 41.5% in 2025, and it is also the fastest-growing region at 4.7% a year, because it builds most new detached homes and adds residents faster than any other Census region. Battery platforms change the buying pattern, because one battery and charger run a family of mowers, trimmers and edgers, so the first kit sale steers later purchases toward the same brand. The product mix is also shifting, because California rules require most newly made small off-road engines to be zero emission from 2024, which pushes makers toward battery platforms across the country.
Mowers, hand tools and watering gear define the category
The estimate covers hand tools such as pruners, shovels and rakes, walk-behind, riding and robotic lawnmowers, string trimmers and edgers, and water management equipment such as hoses, sprinklers and irrigation timers. It counts purchases by households and by commercial buyers such as landscaping contractors, property managers and public grounds crews, valued at the prices those buyers pay.
The estimate excludes chainsaws, leaf blowers, snow throwers, compact tractors, fertilizers, seed and landscaping services. Most residential products move through home centers, while dealers sell and service riding mowers and commercial equipment that need setup, parts and repair over many seasons.
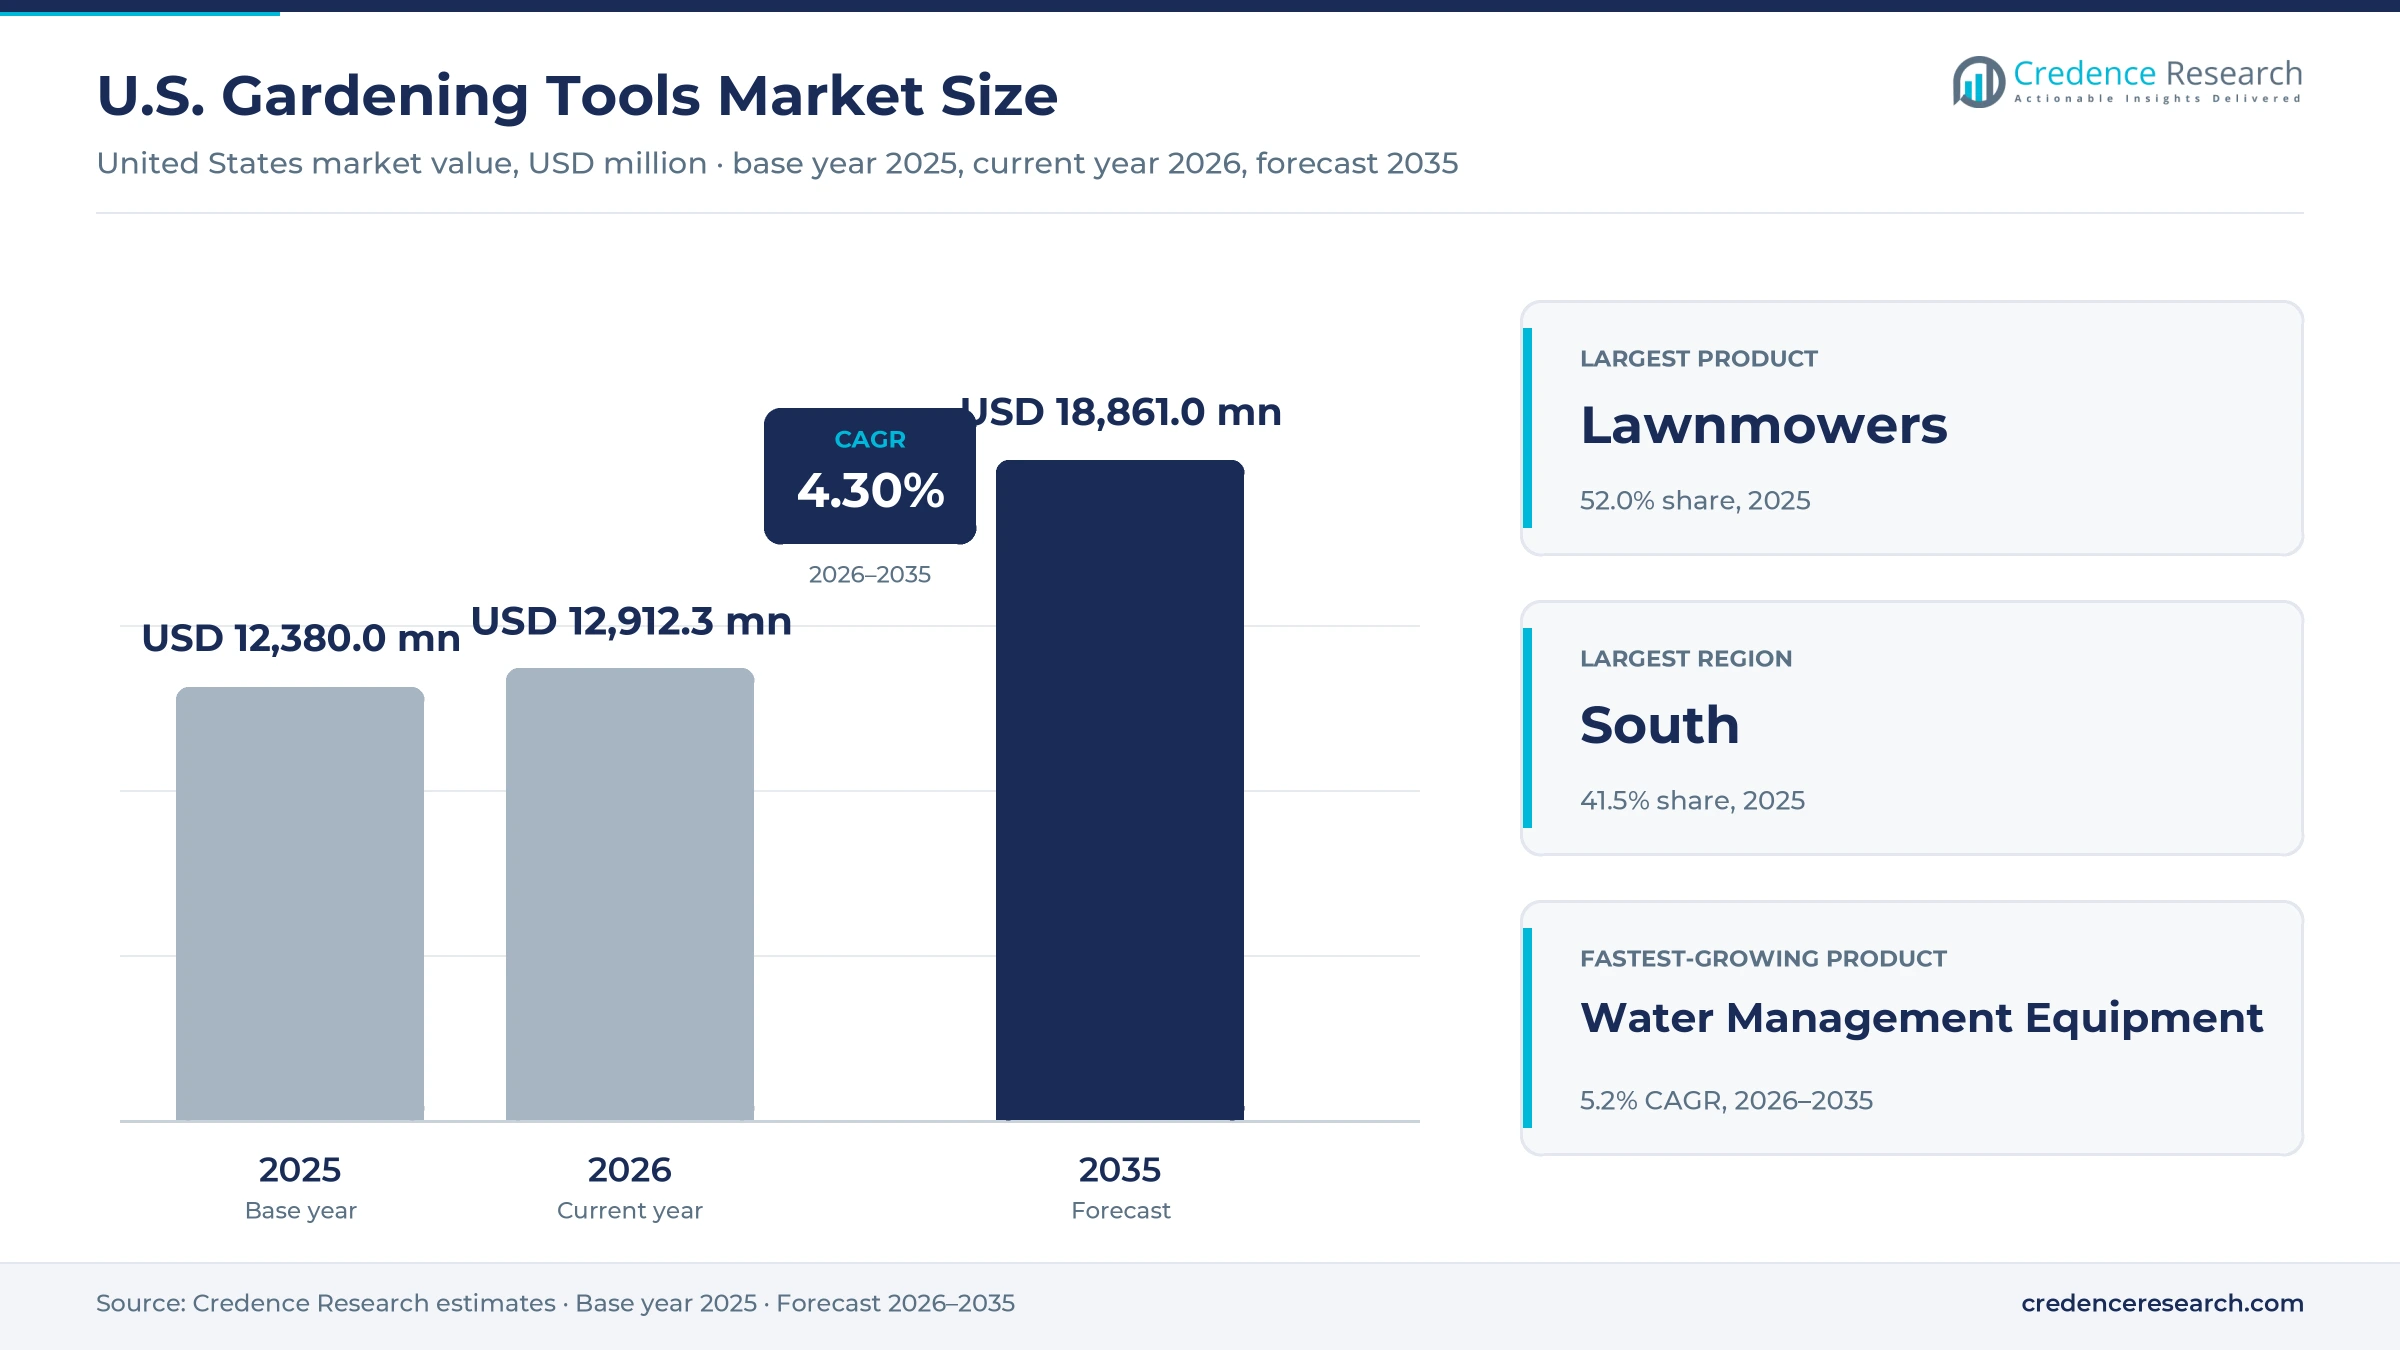
U.S. Gardening Tools Market Insights
- The U.S. gardening tools market was valued at USD 12.38 billion in 2025 and is projected to reach USD 18.86 billion by 2035, registering a CAGR of 4.30% during 2026–2035.
- The South held a 41.5% share of 2025 value, because it completed 588,600 single-family homes in 2025, more than the other three regions combined.
- Lawnmowers led with a 52.0% share of 2025 value, because riding and zero-turn mowers sell for several thousand dollars against tens of dollars for most hand tools.
- Husqvarna Group introduced 13 boundary wire-free robotic mowers on Feb. 6, 2025, its largest launch, bringing its wire-free range to 24 models.
- Water management equipment grows fastest among products at 5.2% a year during 2026–2035, because a WaterSense labeled controller can cut home irrigation water use by up to 30%.
Lawnmowers lead while watering equipment grows fastest
Mowers lead on price while watering gear grows fastest
Based on product, the market is categorized into hand tools, lawnmowers, trimmers and edgers, and water management equipment. Lawnmowers led with a 52.0% share of 2025 value, because mowers carry the highest unit prices in the category, from a $569 list price for the Toro 22-inch Recycler Max to dealer-sold riding and zero-turn mowers that cost several thousand dollars. Water Management Equipment grows fastest at 5.2% a year, as outdoor use makes up more than 30% of household water use, according to EPA WaterSense, and a labeled controller can save a home up to 15,000 gallons a year. Hand tools grow slowest, because pruners and shovels last many seasons before replacement.
Households lead while contractors buy for productivity
Based on end user, the market is categorized into residential and commercial buyers. Residential buyers led with a 70.0% share of 2025 value, because households spent a record $740 each on lawn and garden activities in 2025, up 18.3%, according to the National Gardening Survey 2026 edition. Commercial buyers grow fastest at 4.8% a year, as grounds maintenance employment is projected to grow 5% from 2025 to 2035, according to BLS. Contractors replace mowers and trimmers on hours of use rather than on seasons, which gives them steadier replacement cycles than homeowners.
Home centers lead as national retailers gain online
Based on distribution channel, the market is categorized into home centers, lawn and garden specialty stores, national retailers, discount stores and hardware stores. Home Centers led with a 42.0% share of 2025 value, because the two national chains carry the leading battery platforms, and Lowe’s has been the exclusive nationwide home center for EGO since December 2020. National Retailers grow fastest at 5.0% a year, as e-commerce reached 17.1% of retail sales in the second quarter of 2026, up from 16.3% a year earlier, according to Census Bureau data. Specialty dealers keep riding mowers, because buyers need setup and service.
| Segment Group | Leading Sub-segment | Share, 2025 | Fastest-growing Sub-segment | CAGR, 2026–2035 |
|---|---|---|---|---|
| By Product | Lawnmowers | 52.0% | Water Management Equipment | 5.2% |
| By End User | Residential | 70.0% | Commercial | 4.8% |
| By Distribution Channel | Home Centers | 42.0% | National Retailers | 5.0% |
Battery and robotic models push mower prices higher
Prices in this market follow the power source and the size of the cutting deck more than the brand. Hand tools sell for tens of dollars and turn over slowly, while walk-behind mowers sit in the hundreds and riding or zero-turn mowers in the thousands. Battery tools are sold both as kits and as bare tools, and the Ryobi 18V string trimmer and edger that lists at $69.97 without a battery costs $99 with one. Brands use kits to win the first sale and earn margin on later bare-tool purchases. The steel content tariffs in force since August 2025 add cost to imported mowers and narrow the room for spring promotions.
| Product | Typical price or fee | Basis |
|---|---|---|
| Fiskars Smooth Action bypass pruner | USD 16.97 | H-E-B retail listing, November 2026 |
| Ryobi 18V ONE+ 13-inch string trimmer and edger kit | USD 99 with battery and charger | SportsField Management, August 2026 |
| Toro 22-inch Recycler Max self-propelled gas mower | USD 569 list price | Toro product page, 2026 |
| Orbit B-hyve XR 8-zone smart controller | USD 142.65 sale, USD 230.99 list | Sprinkler Warehouse listing, 2026 |
| John Deere Z370RS electric zero-turn mower | USD 6,499 MSRP | Pro Tool Reviews, 2025 |
Request a Free Sample
Fill in your details and we'll send you a free sample report.
- Sample data tables & charts
- Research methodology
Record spending, new homes and crew shortages lift sales
Why does record lawn and garden spending lift tool sales?
Household spending sets the ceiling for tool purchases, and that ceiling rose in 2025 even as participation slipped. Total consumer spending on lawn and garden activities reached a record $79.0 billion in 2025, up 13.5% from 2024, according to the National Gardening Survey 2026 edition. Part of that gain reflects higher prices, which the survey now measures against BLS inflation thresholds. The gardeners who remain are buying more per household, which favors self-propelled and battery mowers over basic push models. Lawnmowers hold 52.0% of 2025 value, so upgrades by committed households carry more weight in the market than casual buyers who leave the hobby.
How does new single-family construction create first-time buyers?
Every newly built detached home adds a lawn, planting beds and often an irrigation zone that must be equipped from scratch. Builders completed 1,010,100 single-family homes in 2025 and started 943,000 more, according to the Census Bureau new residential construction report of Feb. 18, 2026. First-time owners must buy a mower, a trimmer, hoses and basic hand tools before they can maintain the yard. New subdivisions also install in-ground sprinklers that need timers and controllers. The South builds most of these homes, which is why the zone leads the regional split and keeps adding first-time buyers each year. Water management equipment also benefits, because each new irrigated lot needs a controller.
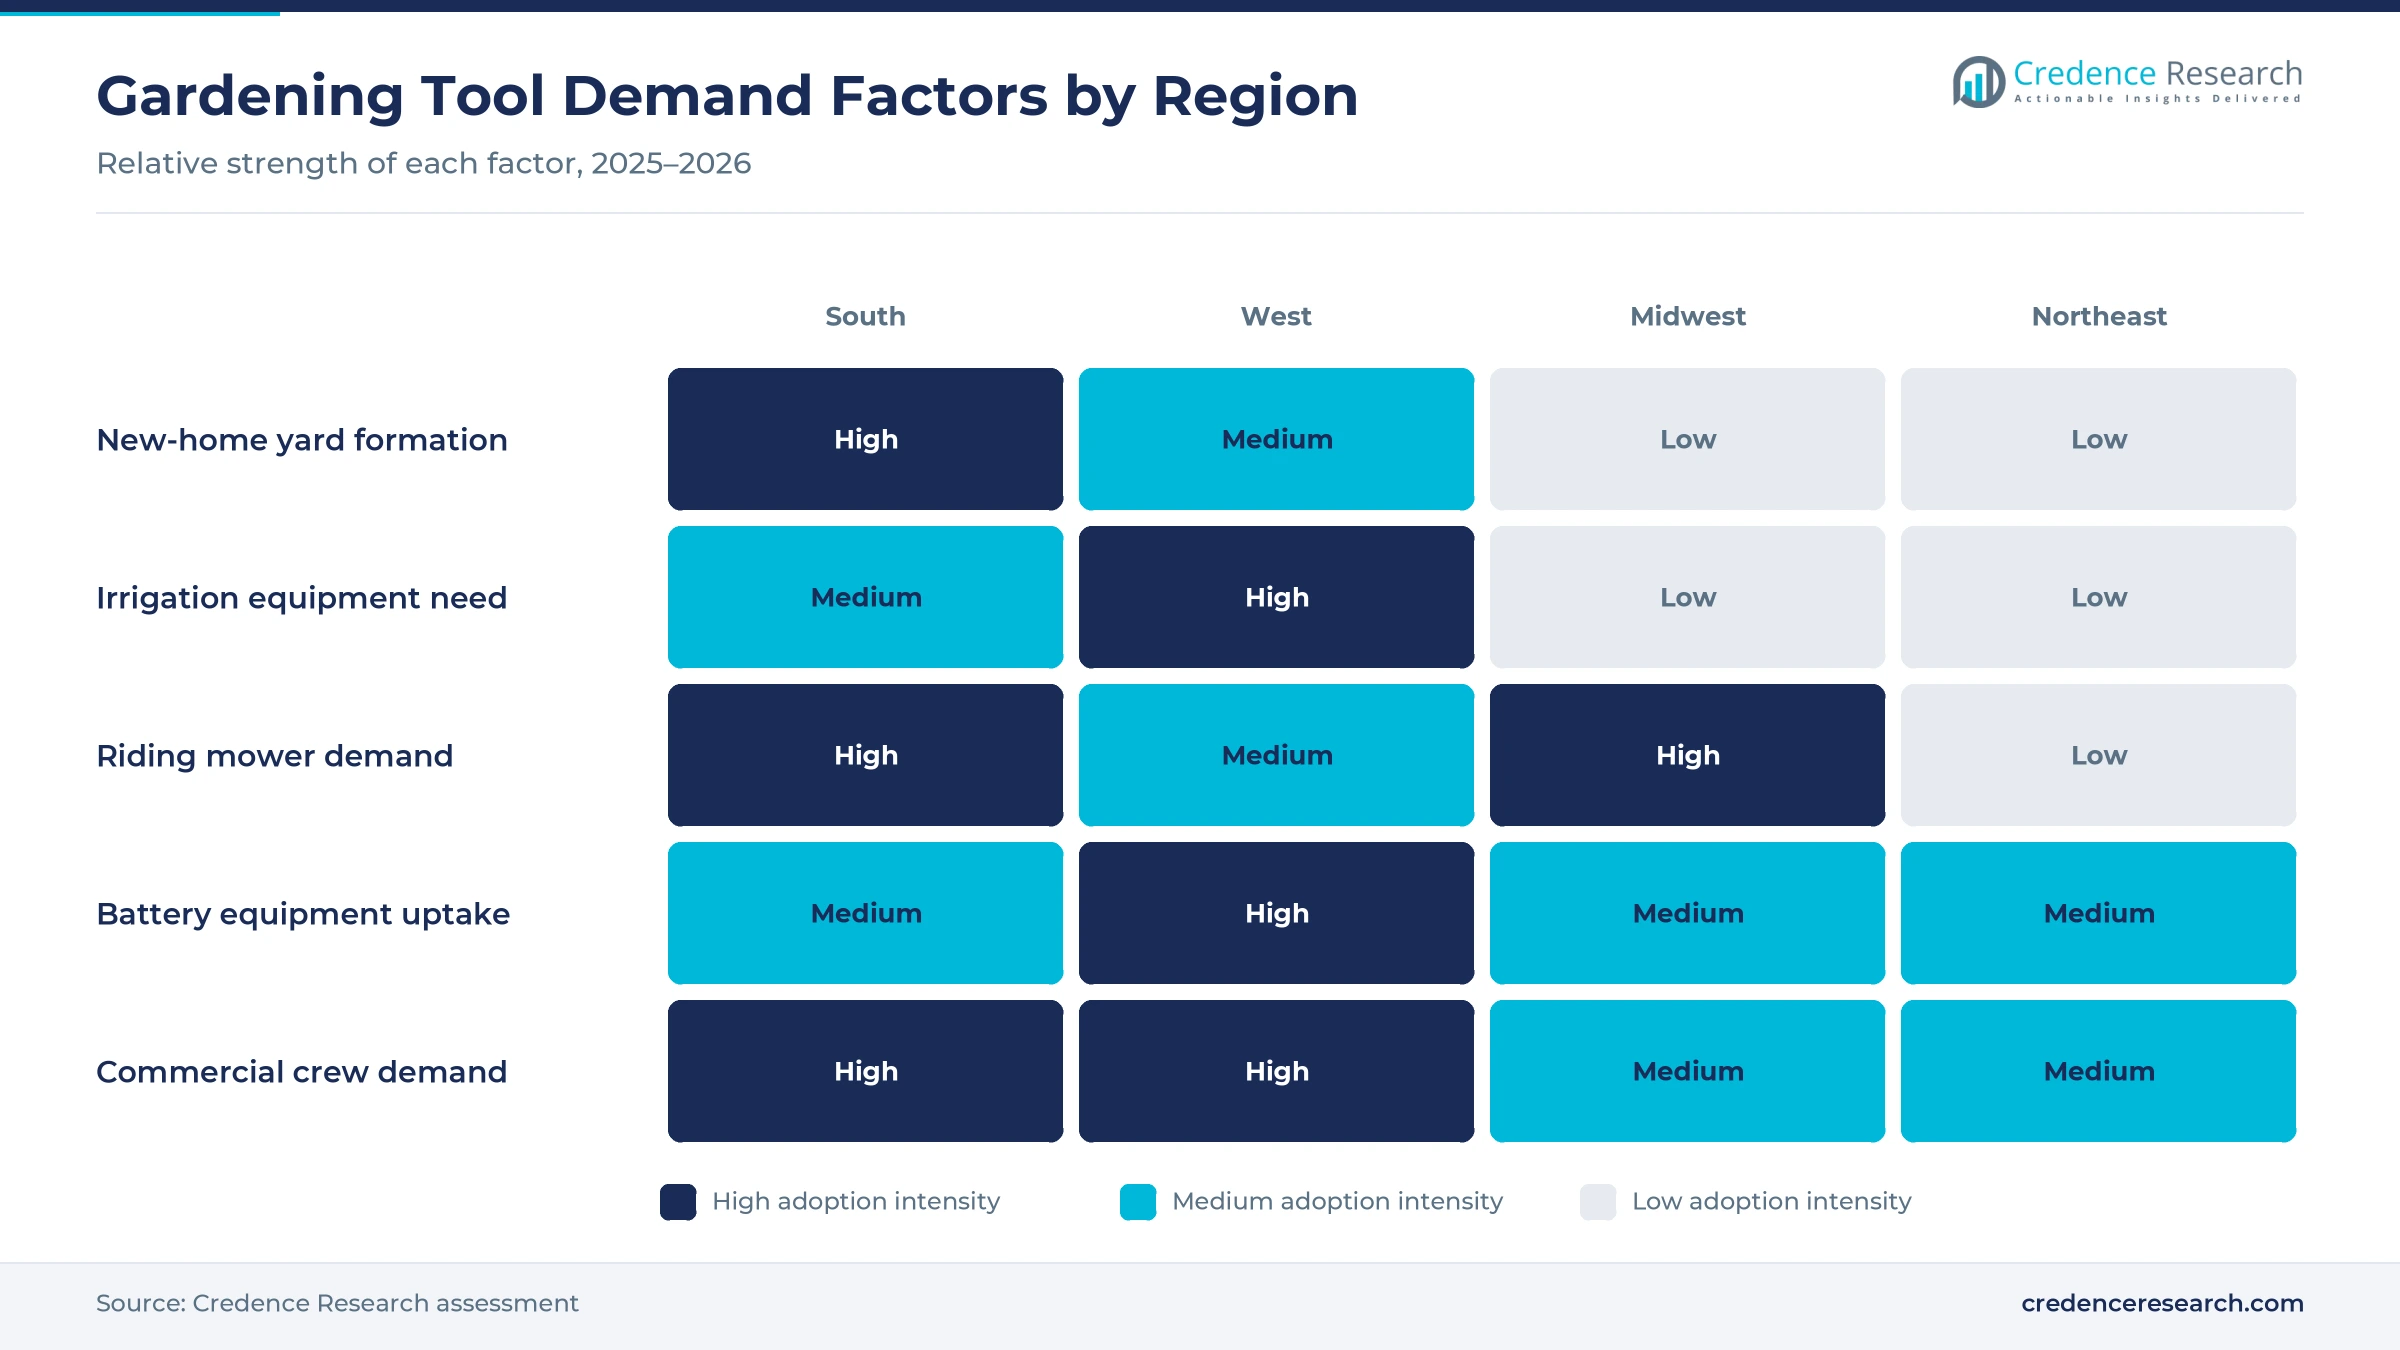
Why do landscaping labor gaps favor productive equipment?
Commercial crews buy equipment that lets fewer workers cover more ground, because labor is the scarcest input in grounds maintenance. Grounds maintenance workers held 1,299,200 jobs in 2025, and the Bureau of Labor Statistics projects about 162,500 openings a year through 2035. Employers also depend on seasonal visas, and DHS and DOL made 64,716 supplemental H-2B visas available for fiscal 2026 in a temporary rule published in the Federal Register on Feb. 3, 2026. Contractors respond with wider zero-turn decks, stand-on mowers and battery handhelds that cut refueling and maintenance time, which lets one operator finish more properties in a working day. These purchases explain why commercial buyers grow fastest at 4.8% a year.
How do shared battery platforms lock in repeat purchases?
Battery platforms turn one tool purchase into a series, because the same battery and charger run a whole family of mowers, trimmers and edgers. Ryobi added new 40V and 18V ONE+ models in August 2026, including a 13-inch string trimmer and edger, a pole hedge trimmer and an 8-inch edger, according to SportsField Management. Stanley Black & Decker presented a DEWALT 60V MAX commercial handheld line in October 2025 that runs on a single battery platform. Retail exclusives deepen this lock-in, since each home center stocks different platforms. Brands with the widest cordless power equipment range capture follow-on sales of trimmers and edgers, which grow faster than hand tools.
Battery mowing, wire-free robots and smart watering spread
How is the shift from gas to battery mowing taking hold?
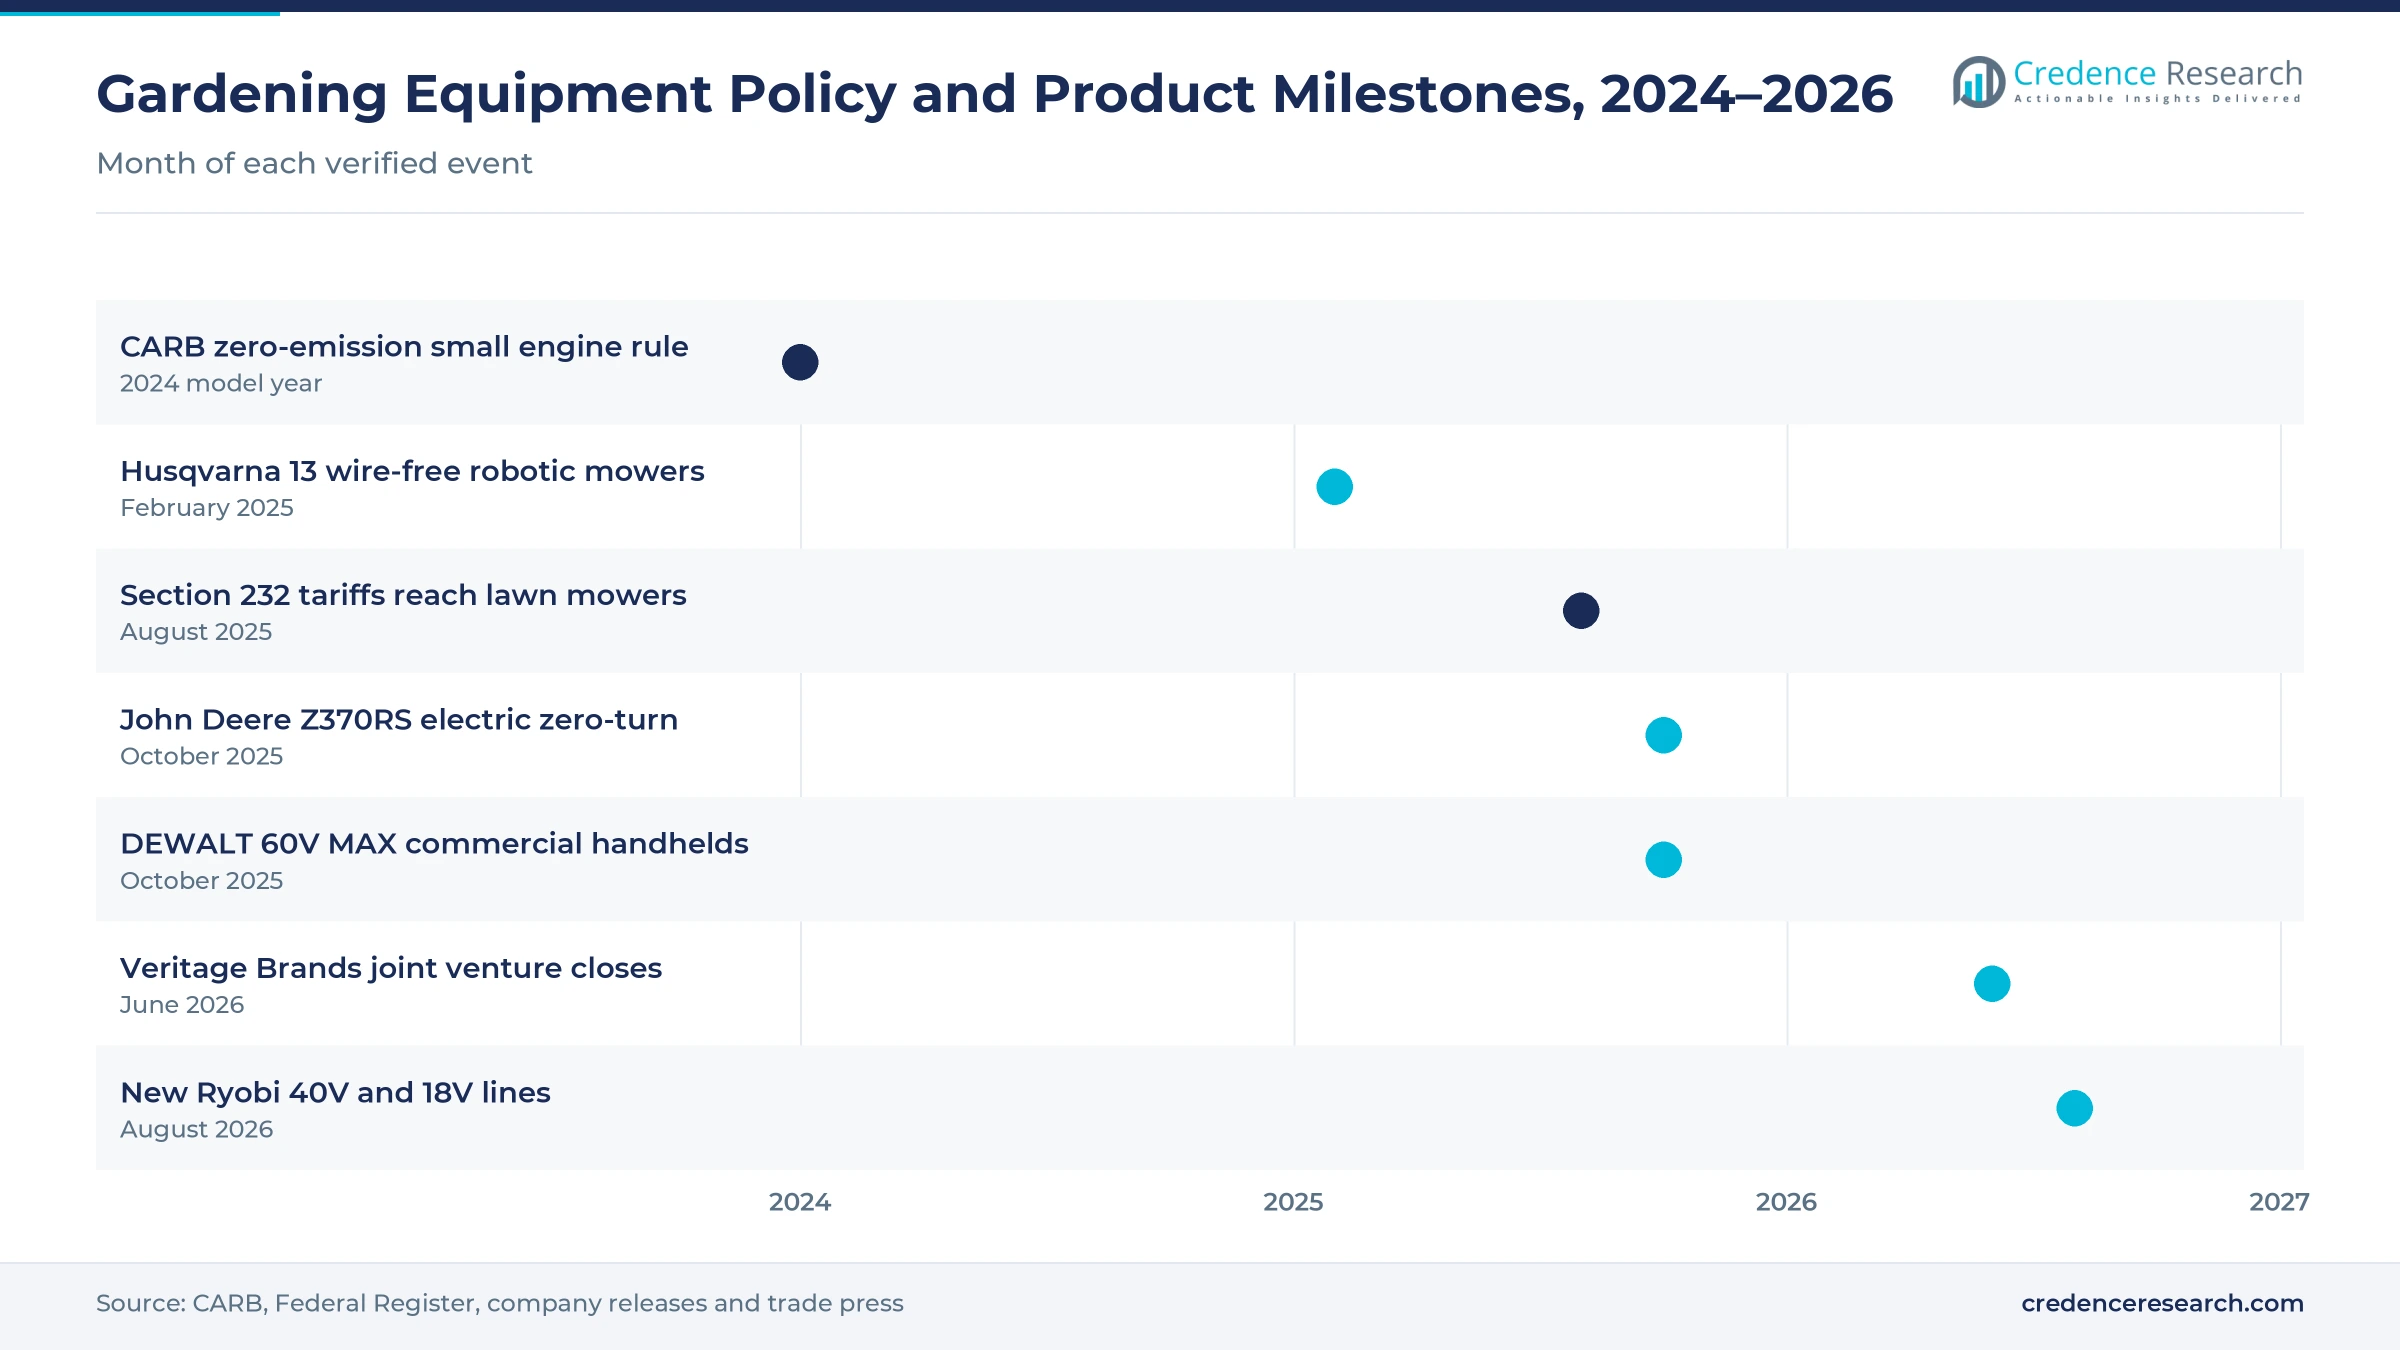
Makers are shifting residential mowing from gas engines to batteries to meet emissions rules, creating openings for higher-priced cordless mowers across suburban lots. The California Air Resources Board requires most newly manufactured small off-road engines, including those in lawn mowers and leaf blowers, to be zero emission from 2024. Husqvarna Group said in its interim report of July 2025 that sales of its petrol-powered wheeled products decreased in the second quarter. John Deere introduced the Z370RS electric zero-turn on Oct. 1, 2025, rated for up to 1.25 acres per charge on six EGO batteries. Dealers that stock only gas riding mowers now face the sharpest product gap, especially in California.
Why are wire-free robotic mowers gaining retail shelf space?
Robotic mowing is moving from dealer installation toward retail shelves, because new models navigate by satellite and no longer need a buried boundary wire. Husqvarna Group introduced 13 boundary wire-free models on Feb. 6, 2025, bringing its wire-free range to 24, and said its new Gardena models were the first it sold through DIY stores, garden centers and e-commerce. Its robotic mower category grew 15% in the second quarter of 2025, according to the Husqvarna Group interim report for January to June 2025. Wire-free setup removes the installation step that kept robotic mowers out of many American yards, although U.S. retail availability of the Gardena models is not disclosed.
Smart watering retrofits open a replacement opening
Smart watering offers a retrofit opening in homes that already own sprinklers and timers, because many existing systems waste a large share of the water they apply. As much as 50% of outdoor water is lost to wind, evaporation and runoff from inefficient irrigation, according to EPA WaterSense. A poorly maintained automatic system can waste up to 25,000 gallons a year in one household. Husqvarna Group plans to expand its watering portfolio in 2026, building on the Orbit Irrigation business it acquired in 2021. Smart irrigation controllers that sell for about $140 to $230 give homeowners a low-cost upgrade compared with replacing the whole system.
Can commercial robots and battery fleets win public grounds?
Public grounds and sports fields offer an opening for autonomous and battery fleets, because their mowing schedules are fixed and their labor costs are high. The four professional models in Husqvarna’s February 2025 launch, noted above, target sports fields, golf courses and parks, and are due to add night vision and obstacle avoidance in 2026. The launch’s largest models cover lawns of more than 50,000 square meters. In California, legislators set aside $30 million to help sole proprietors and small landscaping businesses buy zero-emission mowers, leaf blowers and string trimmers, according to CARB. Grounds workers earned a median $19.27 an hour in May 2025, according to BLS, so every crew hour saved on routine mowing moves labor to higher-value work. Suppliers with fleet service networks gain most from this shift.
Fewer gardeners, tariffs and brand exits weigh on sales
Why does falling participation weaken entry-level demand?
Fewer gardening households shrink the pool of first-time and entry-level buyers, even when committed gardeners spend more. About 4.5 million households left gardening in 2025, according to the National Gardening Survey 2026 edition. Husqvarna Group said in its 2025 year-end report that North American demand remained soft, particularly for handheld and wheeled products. Brands that depend on low-priced push mowers and basic hand-tool sets at discount stores are most exposed, while premium battery and robotic lines are less affected.
How do steel tariffs raise imported mower costs?
Import duties raise landed costs for mowers and power tools assembled abroad, because the duty applies to their steel and aluminum content. The Commerce Department added 407 tariff codes to its derivative list from Aug. 18, 2025, including powered rotary lawn mowers and handheld power tools, according to the Federal Register. The notice applies the Section 232 duties, raised to 50% from June 4, 2025, according to the White House, to the steel and aluminum content of those products. Importers that source finished mowers from Asia are most exposed, while domestic assemblers face higher costs for imported steel parts.
Brand exits leave dealers with gaps in their mower lines
Brand exits force dealers to replace product lines and service skills that took years to build. Honda ended U.S. gas mower production in September 2023 and sold remaining inventory through 2024, citing market forces in an Oct. 3, 2022, notice to its U.S. dealers, as reported by Rural Lifestyle Dealer. Dealers that relied on Honda walk-behind mowers had to adopt other brands while still servicing older units. A single manufacturer decision can remove a familiar product from a channel, which favors dealers that hold several supplier contracts.
How do weak homeowner markets strain field inventories?
Homeowner softness leaves inventory in the channel, which pushes suppliers into promotions and lowers shipments the following season. The Toro Company reported lower walk power mower shipments in its fourth quarter of fiscal 2025 and built its fiscal 2026 outlook on conservative assumptions for homeowner markets, according to its Dec. 17, 2025, results release. Suppliers with heavy exposure to home-center mower programs face the largest swings, while those with commercial and watering lines spread the risk.
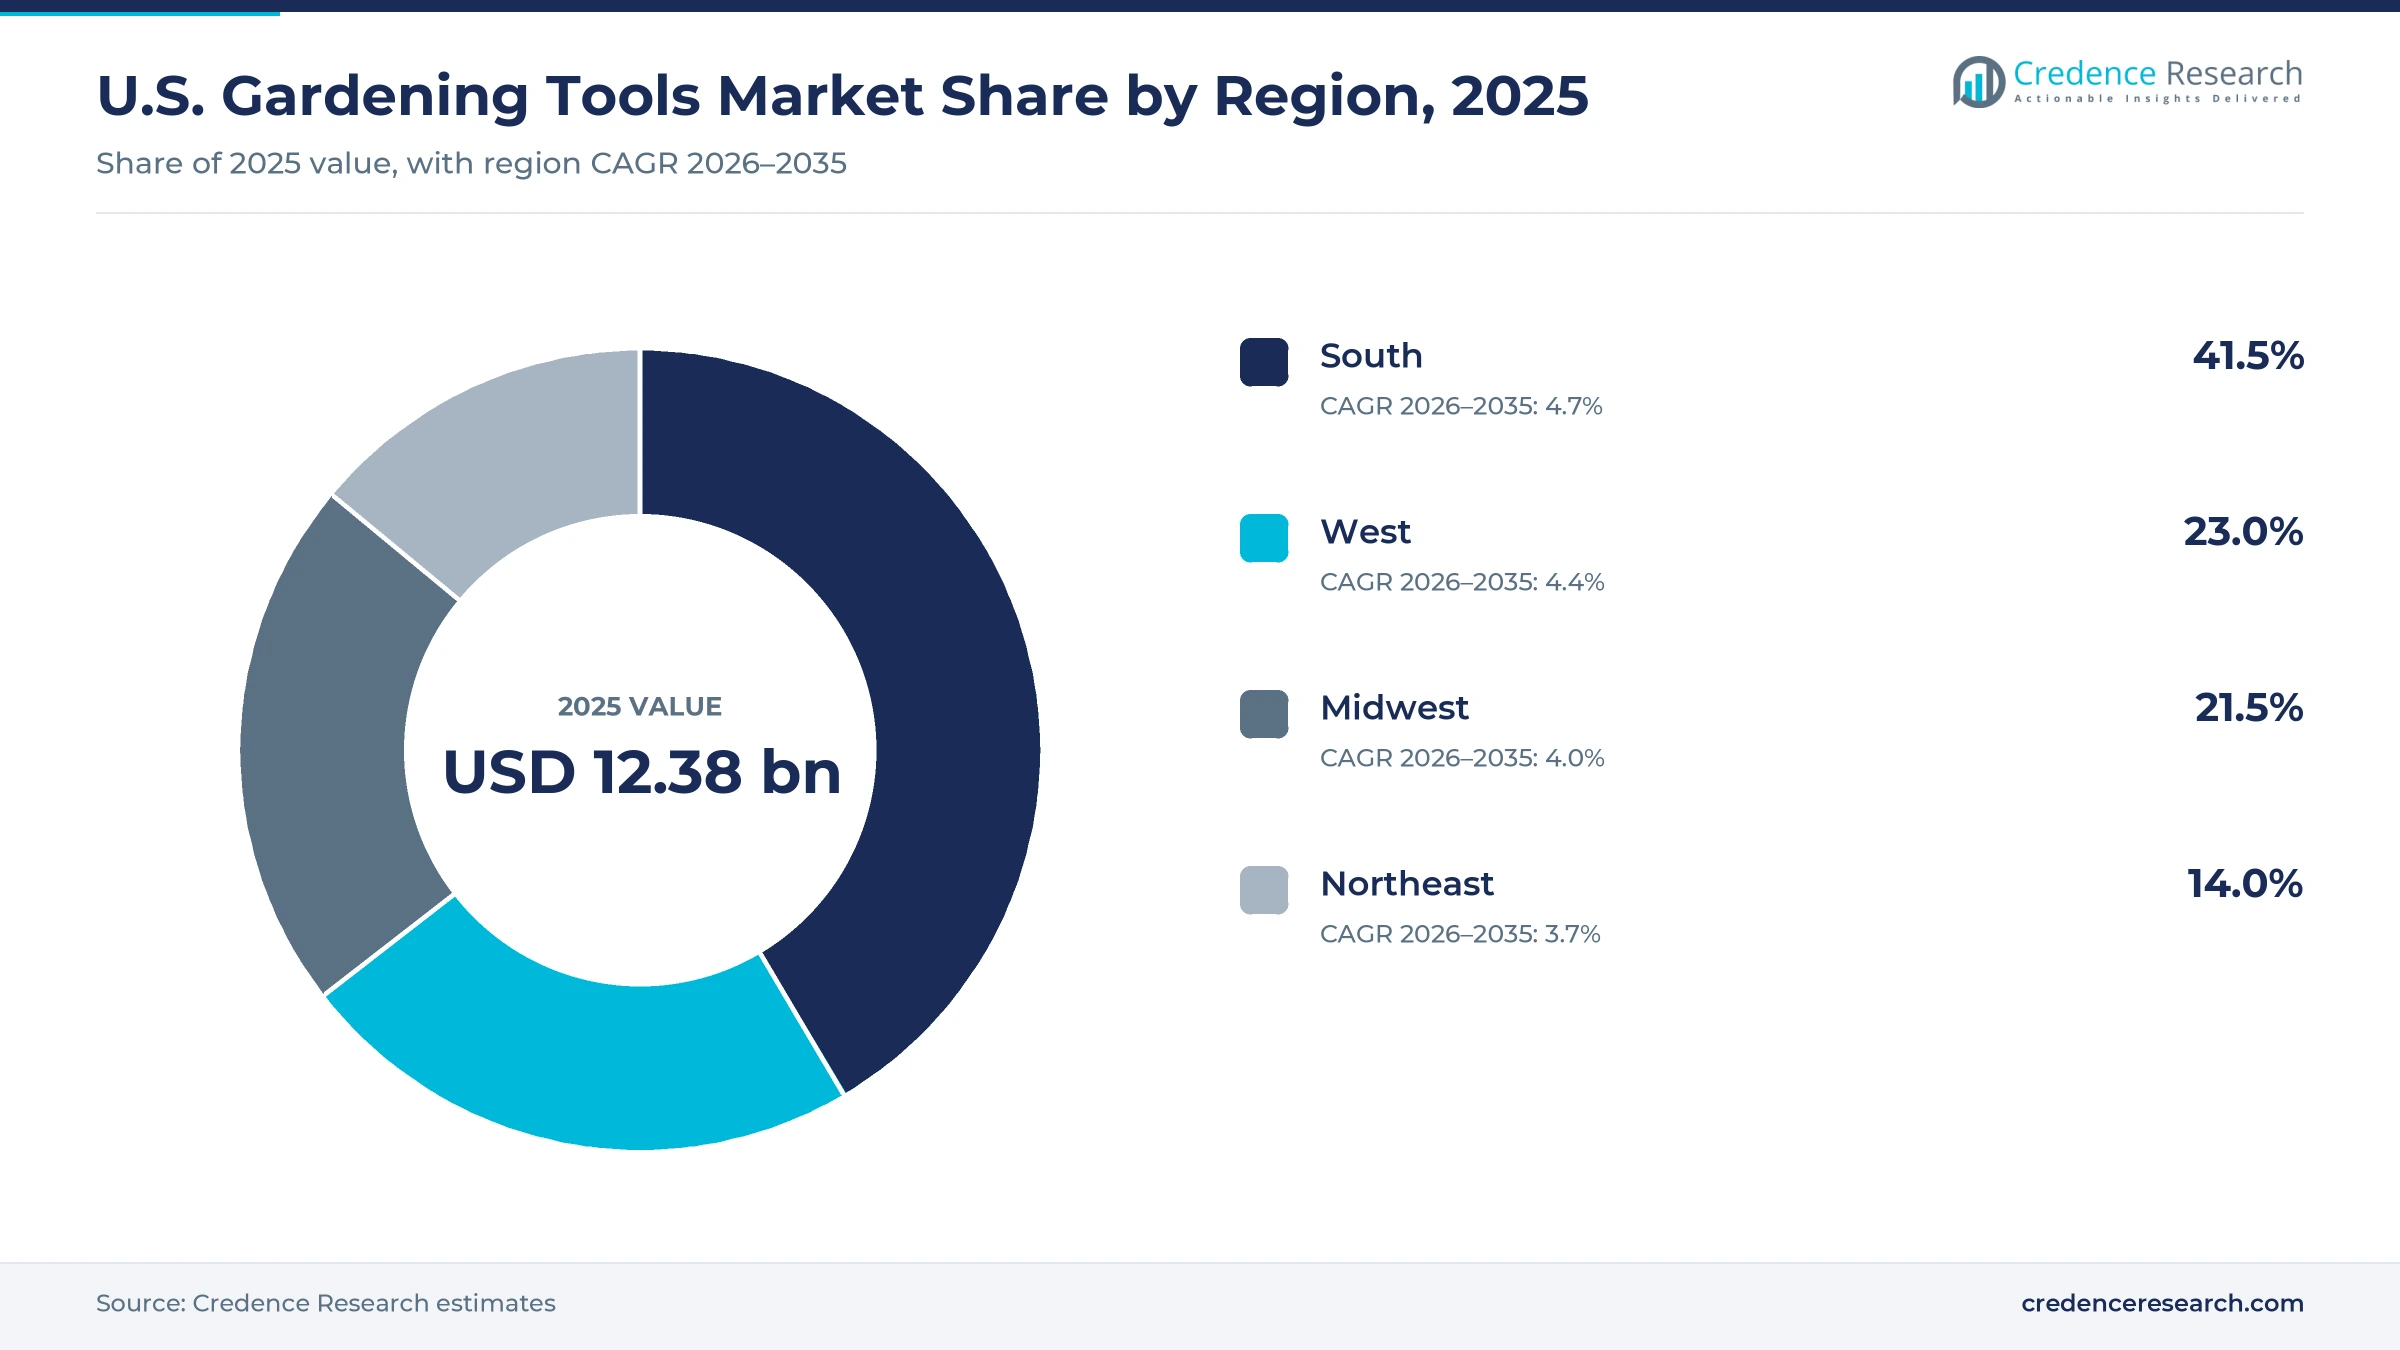
The South leads on new homes and the fastest growth
| Region | Value, 2025 (USD billion) | Share, 2025 | CAGR, 2026–2035 |
|---|---|---|---|
| South | 5.14 | 41.5% | 4.7% |
| West | 2.85 | 23.0% | 4.3% |
| Midwest | 2.66 | 21.5% | 4.0% |
| Northeast | 1.73 | 14.0% | 3.6% |
Why does the South lead and grow fastest?
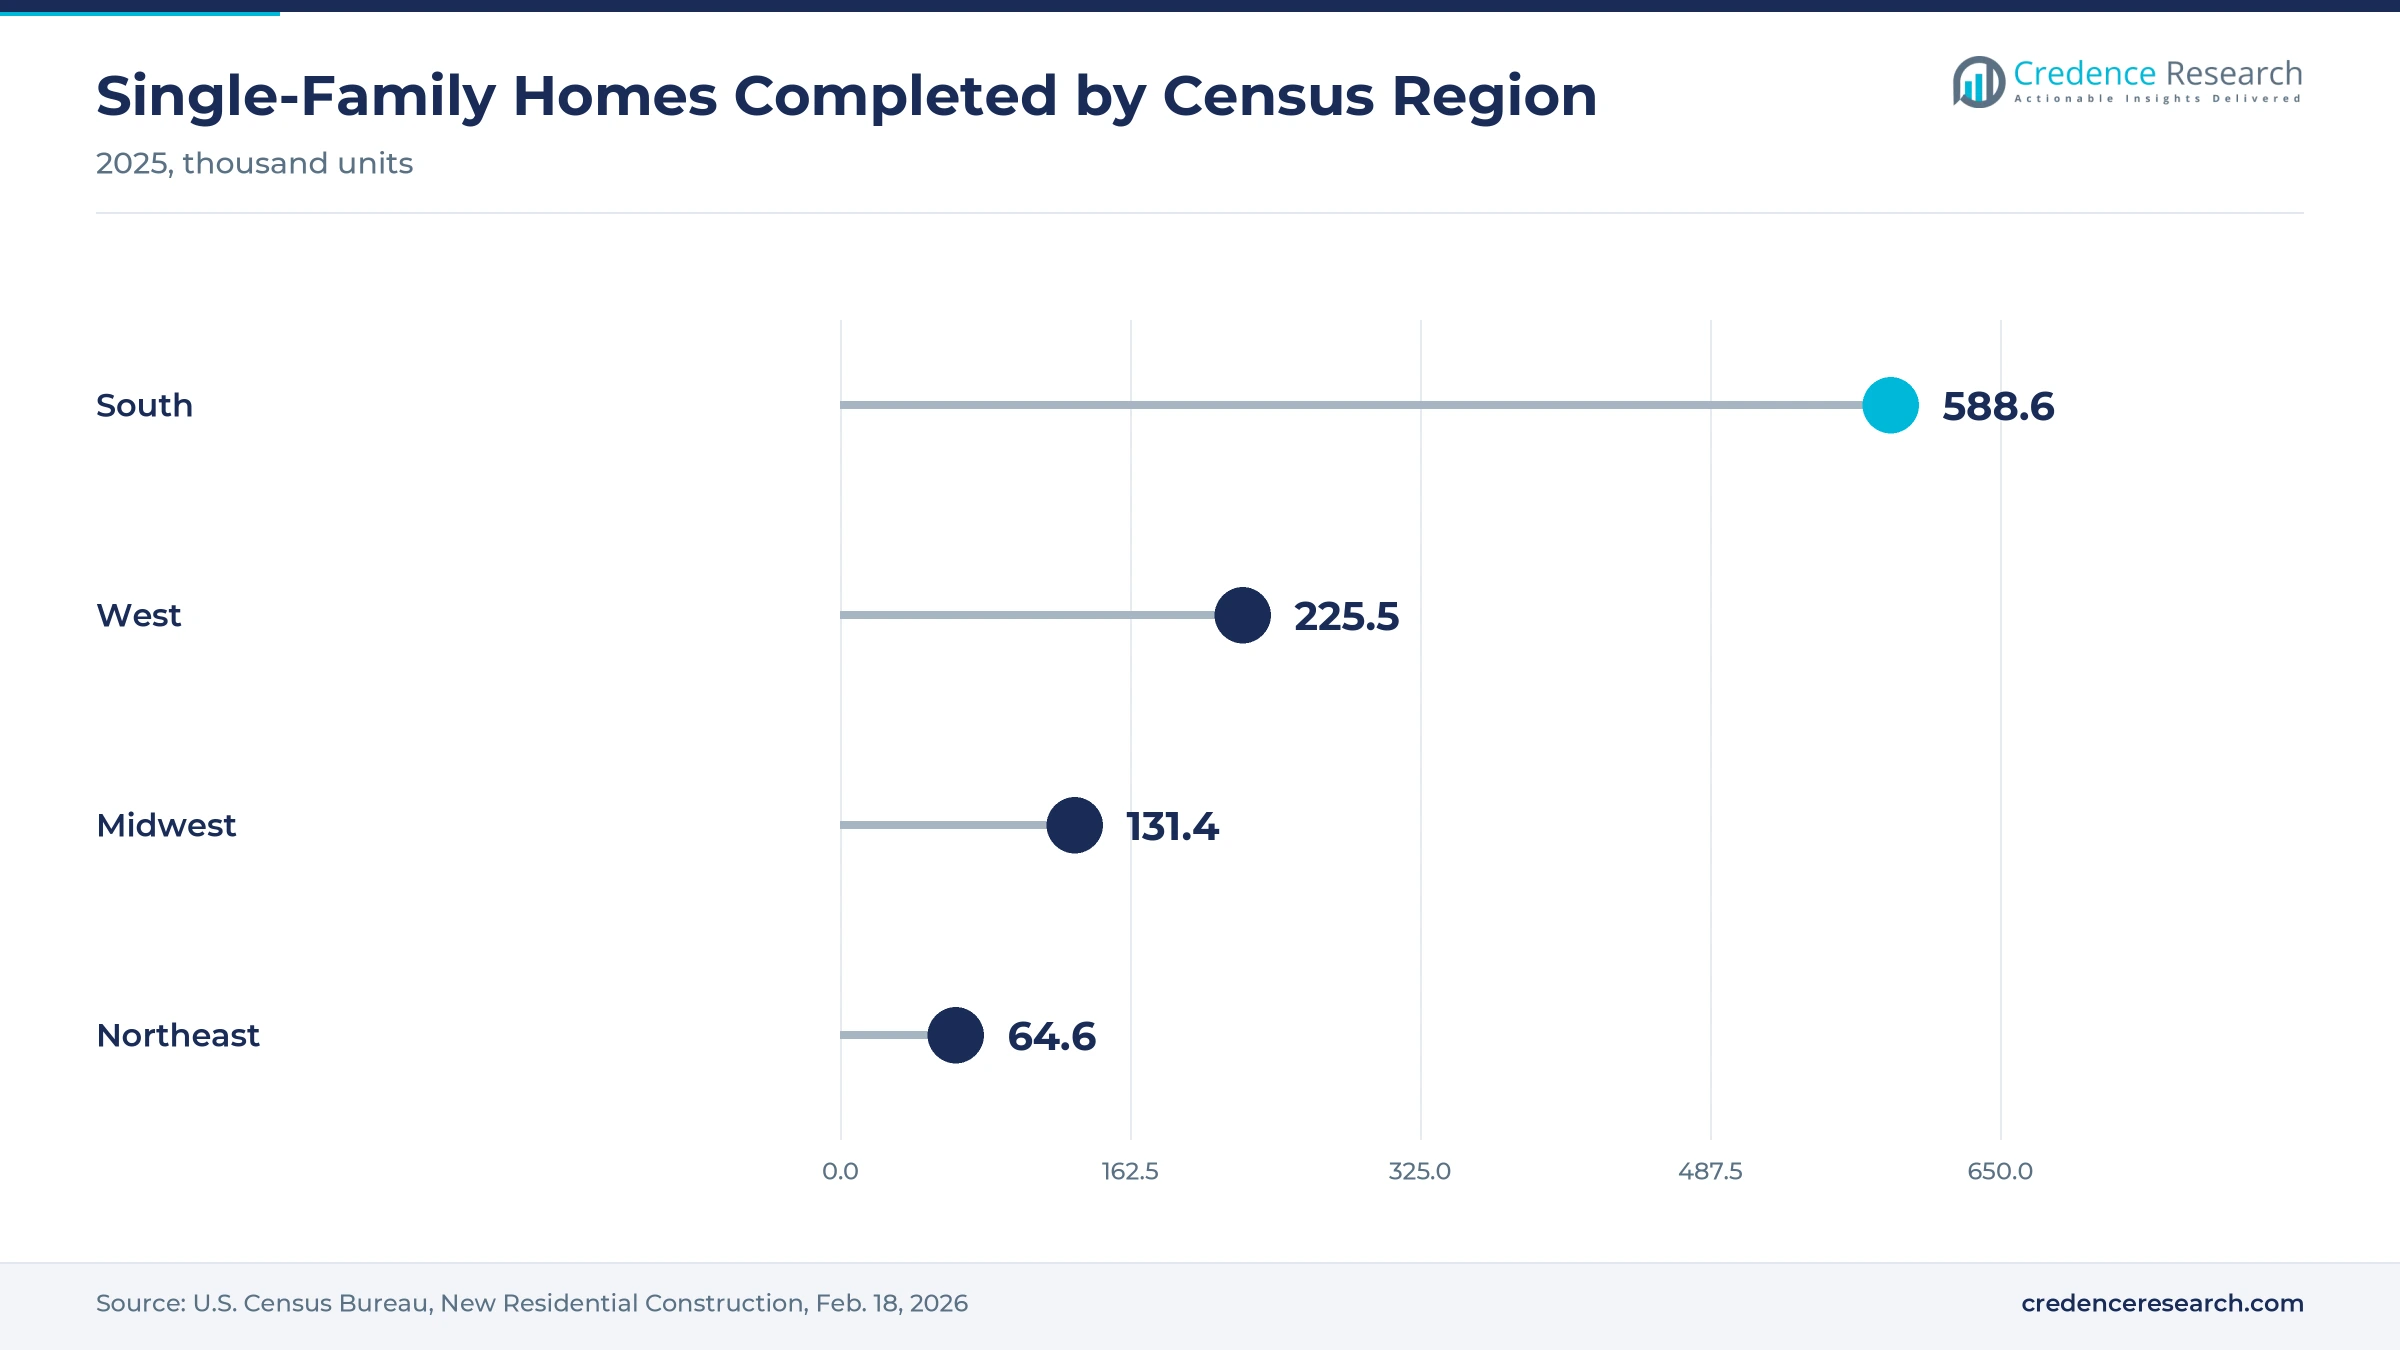
The South held a 41.5% share of 2025 value and grows fastest at 4.7% a year, because it completed 588,600 single-family homes in 2025, more than the other three regions combined, according to the Census Bureau. Its population grew 0.9% in the year to July 1, 2025, the fastest of the four Census regions, according to NAHB analysis of Census estimates. Lots are also large in parts of the zone, with a 0.3-acre median for spec homes started in the East South Central division in 2025, according to NAHB analysis of Census data, which favors riding mowers.
How does water scarcity shape demand in the West?
The West held 23.0% of 2025 value and grows at 4.3% a year, with 225,500 single-family completions in 2025, the second-highest regional total. Outdoor water use can reach 60% of household use in arid regions, according to EPA WaterSense, which keeps demand for drip lines, timers and smart controllers strong across the Southwest. New lots are small, with half of Pacific spec-home lots under 0.13 acres in 2025, according to NAHB, which favors walk-behind battery mowers and drip watering over riding equipment. Population growth of only 0.3% in 2025 limits the lift from new households.
Why is the Midwest mainly a replacement market?
The Midwest held 21.5% of 2025 value and grows at 4.0% a year. Builders completed 131,400 single-family homes in the region in 2025, and population grew 0.4%, faster than the West or the Northeast. That combination makes the Midwest a replacement market more than a new-yard market, so mower and trimmer upgrades drive most purchases. Published lot-size data for the region are not broken out, so this estimate leans on completions and population and is the least certain of the four zones.
Why does the Northeast grow slowest?
The Northeast held 14.0% of 2025 value and grows slowest at 3.6% a year, because builders completed only 64,600 single-family homes there in 2025 and population grew 0.2%. Lots are large where homes are built, since New England spec homes started in 2025 had a median lot about double the national figure, according to NAHB, so the few new yards there still need riding mowers. Demand rests mostly on replacement purchases, which makes the zone more sensitive to prices and promotions. Public data on tool spending by region are thin, so this split leans on housing and population data.
Robot launches, tariffs and a hand-tool merger since 2025
| Development | Status and market relevance |
|---|---|
| In February 2025, Husqvarna Group introduced 13 boundary wire-free robotic mowers, including four professional models for sports fields and parks. | Product launch for the 2025 season, with AI features planned for 2026 |
| In August 2025, the Commerce Department added powered rotary lawn mowers and handheld power tools to the Section 232 steel and aluminum derivative list. | Tariff in force from Aug. 18, 2025, on steel and aluminum content |
| In October 2025, John Deere introduced the Z370RS electric zero-turn mower, powered by removable EGO 56V batteries and sold through its dealers. | Product introduction through the John Deere dealer network |
| In October 2025, Stanley Black & Decker debuted a DEWALT 60V MAX commercial handheld line with string trimmers, edgers and hedge trimmers at Equip Expo. | Product debut aimed at landscaping crews |
| In June 2026, Griffon Corporation and ONCAP closed a joint venture that combined AMES North America with Venanpri tools as Veritage Brands. | Completed transaction, with Griffon holding a 43% stake |
Navigation, batteries and smart controllers change tools
- Satellite and vision navigation lets robotic mowers work without a buried boundary wire, which removes the installation step and opens retail sales.
- Removable lithium-ion battery packs move between mowers, trimmers and edgers on one platform, which spreads the battery cost across several tools.
- Brushless motors deliver more torque from the same battery, which lets cordless trimmers and hedge trimmers take on commercial work once reserved for gas units.
- Weather-based irrigation controllers adjust watering schedules to local conditions, which cuts wasted water and supports WaterSense labeling.
Need a Custom Version of This Report?
Tailor the scope, geography, or segments to your exact requirements.
- Custom geography or segment scope
- Direct access to our analyst team
Mower groups and battery platforms compete for shelf space
Competition centers on mower programs at home centers and dealers, where a few groups hold most shelf and showroom space. The Toro Company sells Toro and Lawn-Boy mowers and said it mitigated tariff headwinds in fiscal 2025. Deere & Company keeps residential riding and zero-turn sales inside its dealer network, now including the Z370RS electric model. Husqvarna Group combines mowers, Automower robots and Orbit watering products. Stanley Black & Decker competes through Cub Cadet, Craftsman, Troy-Bilt, Hustler and DEWALT. Techtronic Industries and Chervon lead battery equipment through Ryobi and EGO, each tied closely to one home-center chain. AriensCo and Briggs & Stratton serve dealer channels with zero-turn mowers, engines and parts, while Fiskars Group and Veritage Brands compete in hand tools. Groups that pair battery platforms with service networks hold the strongest positions.
How is the supplier base organized?
Supply splits into three tiers of companies that rarely compete head-on. Full-line mower groups such as The Toro Company, Deere & Company, Husqvarna Group and Stanley Black & Decker control dealer and home-center mower programs. Battery platform owners, Techtronic Industries with Ryobi and Chervon with EGO, win shelf space through home-center exclusives. Hand-tool and watering specialists such as Veritage Brands and Fiskars Group compete on brand, price and retail placement. Entry barriers are highest in riding mowers, where dealer service networks and engine or battery supply matter, and lowest in hand tools, where private labels compete. Margins sit with platform owners and premium mowers rather than with commodity tools.
Which suppliers do American buyers shortlist?
| Company | Type | Role in the market |
|---|---|---|
| The Toro Company | Full-line supplier | Toro and Lawn-Boy walk-behind mowers, zero-turns and commercial turf equipment |
| Deere & Company | Full-line supplier | John Deere riding, zero-turn and Z370RS electric mowers sold through dealers |
| Husqvarna Group | Full-line supplier | Husqvarna mowers, Automower robots and Orbit watering products |
| Stanley Black & Decker | Full-line supplier | Cub Cadet, Craftsman, Troy-Bilt and Hustler mowers plus DEWALT battery handhelds |
| Techtronic Industries (Ryobi) | Battery platform owner | Ryobi 18V ONE+ and 40V mowers, trimmers, edgers and hedge trimmers |
| Chervon (EGO) | Battery platform owner | EGO 56V mowers and trimmers, with Lowe’s as exclusive nationwide home center |
| AriensCo | Mower specialist | Ariens zero-turn mowers sold through dealers |
| Briggs & Stratton | Engine and equipment maker | Small engines, parts and outdoor power equipment for mowers |
| Fiskars Group | Hand-tool specialist | Fiskars pruners, stick tools and garden cutting tools |
| Veritage Brands (AMES) | Hand-tool specialist | AMES lawn and garden hand tools, combined with Venanpri tools in June 2026 |
Why trading up matters more than unit volume
Credence Research's view is that American demand for gardening tools will grow slowly in units but faster in value, because the households that remain committed are trading up to battery, robotic and smart watering products. New single-family homes in the South keep adding first-time buyers, while commercial crews buy for labor productivity rather than for price. Tariffs on steel content and soft homeowner markets are the main near-term risks. Suppliers that own a battery platform, hold a dealer service network or sell connected watering products should gain share by 2035, while makers of low-priced gas push mowers face the steepest pressure.
Product build-up and spending data anchor the estimate
The report uses 2025 as the base year on a calendar basis, and market values come from the Credence Research model. The earlier estimate was rebuilt from mower, hand-tool, trimmer and watering product values and cross-checked against reported national lawn and garden spending, which raised the 2025 value well above the earlier figure. Segment splits and zone shares are Credence Research estimates from public data. Sources used are official statistics, agency releases, company reports, retailer listings and trade press, and no interviews or surveys were used.
Battery, robotic and watering upgrades carry growth
The U.S. gardening tools market is expected to reach USD 18.86 billion by 2035, registering a 4.30% CAGR during 2026–2035, as new homes, commercial crews and battery upgrades lift spending. Growth should be strongest in water management equipment, commercial buyers and the South, because these areas gain most from water efficiency, labor shortages and new construction. Tariffs on steel content, falling participation and channel inventory swings could slow some years. Suppliers that pair battery platforms with service networks, and those that extend robotic mowing to mid-size lots, should hold the strongest positions.
What decides the range of outcomes to 2035?
The base case assumes steady single-family construction near 2025 levels, a gradual battery shift and tariffs that suppliers absorb through pricing and sourcing changes. The downside case follows continued household exits from gardening, tariff costs passed into shelf prices and weak home-center mower programs. The upside case needs faster adoption of wire-free robotic mowers and smart controllers, a rebound in housing starts and cheaper batteries that close the price gap with gas models.
| Scenario | CAGR, 2026–2035 | Value, 2035 | What has to hold |
|---|---|---|---|
| Downside | 3.1% | USD 17.00 billion | Household exits continue and tariff costs reach shelf prices through 2028 |
| Base | 4.30% | USD 18.86 billion | Construction holds near 2025 levels and battery adoption advances gradually |
| Upside | 5.3% | USD 20.55 billion | Robotic mowers, smart controllers and a housing rebound lift spending per home |
Frequently Asked Questions
How big is the U.S. gardening tools market?
How are consumer gardening habits changing in the United States?
Which gardening equipment brands lead in innovation?
What are the main outdoor tool trends for 2026?
Which region leads the U.S. gardening tools market?
How much do gardening tools cost in the United States?
Why do battery tool brands discount starter kits?
How do tariffs affect gardening equipment prices?
Table of Content
Chapter 1 Market Segmentation
- 1.1 Segmentation Framework
- 1.1.1 Product and Service Classification
- 1.1.2 Application and End-Use Classification
- 1.1.3 Technology and Solution Classification
- 1.1.4 Customer and Distribution Channel Classification
- 1.1.5 Geographic Segmentation
- 1.1.6 Market Segment Definitions and Boundaries
- 1.2 By Product
- 1.2.1 Lawnmowers
- 1.2.2 Hand Tools
- 1.2.3 Water Management Equipment
- 1.2.4 Trimmers and Edgers
- 1.3 By End User
- 1.3.1 Residential
- 1.3.2 Commercial
Chapter 2 Introduction
- 2.1 Report Objectives and Scope
- 2.2 Product Definition and Industry Terminology
- 2.3 Market Inclusions and Exclusions
- 2.4 Research Process
- 2.4.1 Primary Research and Expert Interviews
- 2.4.2 Secondary Research and Source Review
- 2.4.3 Top-Down and Bottom-Up Estimation
- 2.4.4 Data Triangulation and Verification
- 2.5 Market Size Measurement Basis
- 2.5.1 2025: USD 12.38 billion → 2035: USD 18.86 billion
- 2.6 Historical and Forecast Reference Periods
- 2.6.1 Historical Period: 2018-2025
- 2.6.2 Base Year: 2025
- 2.6.3 Forecast Period: 2025-2035
- 2.7 Research Assumptions and Limitations
Chapter 3 Executive Summary
- 3.1 Market Snapshot and Key Findings
- 3.2 Base-Year Market Size, 2025
- 3.3 Forecast Market Size, 2035
- 3.4 Revenue and Volume Growth Outlook
- 3.5 Key Demand and Supply Indicators
- 3.6 Leading Market Segments
- 3.7 Fastest-Growing Market Opportunities
- 3.8 Regional Performance Highlights
- 3.9 Technology and Industry Transformation
- 3.10 Competitive Landscape Summary
- 3.11 Analyst View and Strategic Implications
Chapter 4 U.S. Gardening Tools Market Trends and Developments
- 4.1 Historical Industry Development, 2018-2025
- 4.2 Recent Market Trends and Developments
- 4.3 Demand and Customer Behavior Trends
- 4.4 Technology and Product Innovation
- 4.5 Artificial Intelligence, Automation and Digitalization
- 4.6 Local Manufacturing and Supply Chain Realignment
- 4.7 Industry Partnerships, Mergers and Acquisitions
- 4.8 Sustainability and Circular Economy Developments
- 4.9 Government and Private Sector Investment Trends
- 4.10 Emerging Business Models and Commercialization
- 4.11 Industry Developments and Announcements
Chapter 5 U.S. Gardening Tools Market Production, Supply and Demand Analysis
- 5.1 Demand Trend and Consumption Analysis, 2018-2025
- 5.2 Demand Forecast, 2025-2035
- 5.3 Production and Output Trend, 2018-2025
- 5.4 Production and Output Forecast, 2025-2035
- 5.5 Installed Capacity and Capacity Utilization
- 5.6 Company-Wise Production Plants and Statistics
- 5.6.1 Installed Production Capacity
- 5.6.2 Actual Production
- 5.6.3 Planned Capacity and Expansion Targets
- 5.7 Supply Chain Structure and Procurement Trends
- 5.8 Supply-Demand Gap and Bottlenecks
- 5.9 Import Dependence and Sourcing Structure
- 5.10 Contract Manufacturing and Outsourcing
- 5.11 Regional Supply and Demand Concentration
Chapter 6 U.S. Gardening Tools Market Pricing Analysis
- 6.1 Pricing Structure and Measurement
- 6.2 Historical Pricing Trends, 2018-2025
- 6.3 Pricing Outlook, 2025-2035
- 6.4 Average Selling Price and Unit Economics
- 6.5 Pricing by Product and Market Segment
- 6.6 Geographic Pricing Differences
- 6.7 Key Input, Energy, Labor and Logistics Costs
- 6.8 Contract Pricing and Purchasing Models
- 6.9 Pricing Sensitivity and Competitive Positioning
- 6.10 Price, Margin and Profitability Implications
Chapter 7 U.S. Gardening Tools Market Dynamics
- 7.1 Market Growth Drivers
- 7.1.1 Demand-Side Drivers
- 7.1.2 Technology and Innovation Drivers
- 7.1.3 Infrastructure and Investment Drivers
- 7.1.4 Regulatory and Policy Drivers
- 7.2 Market Restraints
- 7.2.1 Cost and Affordability Constraints
- 7.2.2 Technology and Adoption Barriers
- 7.2.3 Supply Chain and Operational Constraints
- 7.3 Market Challenges
- 7.3.1 Competitive Pressure and Margin Erosion
- 7.3.2 Skills, Infrastructure and Implementation Gaps
- 7.4 Emerging Market Opportunities
- 7.5 Market Dynamics Impact and Time-Horizon Assessment
Chapter 8 U.S. Gardening Tools Value Chain Analysis
- 8.1 Industry Value Chain Overview
- 8.2 Upstream Suppliers and Critical Inputs
- 8.3 Technology and Component Providers
- 8.4 Manufacturing or Service Delivery
- 8.5 Distribution, Channel Partners and Integrators
- 8.6 Downstream Applications and End Users
- 8.7 Value Addition and Profit Pools
- 8.8 Vertical Integration and Outsourcing
- 8.9 Supplier Concentration and Risk
- 8.10 Supply Chain Localization and Resilience
Chapter 9 U.S. Gardening Tools Market Regulations and Policies
- 9.1 Relevant Laws, Standards and Compliance Frameworks
- 9.2 Product, Service, Safety and Quality Requirements
- 9.3 Government Policies, Incentives and Subsidies
- 9.4 Imports, Exports and Trade Barriers
- 9.5 Public Procurement and Local Content Requirements
- 9.6 Environmental and Sustainability Compliance
- 9.7 Upcoming Policy Changes and Market Implications
Chapter 10 U.S. Gardening Tools Market Hotspots and Opportunities
- 10.1 Market Opportunity Mapping and Growth Hotspots
- 10.2 High-Growth Applications and Customer Groups
- 10.3 Underserved Markets and White-Space Opportunities
- 10.4 Emerging Technology and Product Opportunities
- 10.5 New Capacity and Investment Hotspots
- 10.6 Market Entry and Expansion Opportunities
- 10.7 Distribution and Partnership Opportunities
- 10.8 Near-Term and Long-Term Commercial Potential
- 10.9 Opportunity Attractiveness and Execution Risks
Chapter 11 U.S. Gardening Tools Market Outlook, 2025-2035
- 11.1 Market Size and Analysis
- 11.1.1 Revenue (Market Measurement: 2025: USD 12.38 billion → 2035: USD 18.86 billion)
- 11.1.2 Market Volume and Quantity Sold
- 11.1.3 Historical Market Size, 2018-2025
- 11.1.4 Base-Year Market Size, 2025
- 11.2 Market Forecast, 2025-2035
- 11.2.1 Revenue Forecast to 2035
- 11.2.2 Volume Forecast to 2035
- 11.2.3 CAGR and Year-on-Year Growth
- 11.2.4 Incremental Revenue Opportunity
- 11.3 Forecast Assumptions and Scenario Analysis
- 11.3.1 Base-Case Forecast
- 11.3.2 Optimistic and Conservative Scenarios
- 11.3.3 Technology, Pricing and Policy Sensitivities
- 11.4 Market Attractiveness and Growth Outlook
Chapter 12 U.S. Gardening Tools Market Segmentation and Outlook
- 12.1 Segmentation Summary and Market Shares, 2025
- 12.2 Largest and Fastest-Growing Segments
- 12.3 By Product - Market Size and Forecast, 2025-2035
- 12.3.1 Segment Definition and Scope
- 12.3.2 Historical Market Size, 2018-2025
- 12.3.3 Revenue Forecast, 2025-2035
- 12.3.4 Volume Forecast, 2025-2035
- 12.3.5 Base-Year Market Share, 2025
- 12.3.6 Segment CAGR and Growth Drivers
- 12.3.7 Subsegment Market Size and Forecast
- 12.3.7.1 Lawnmowers
- 12.3.7.2 Hand Tools
- 12.3.7.3 Water Management Equipment
- 12.3.7.4 Trimmers and Edgers
- 12.3.8 Subsegment Pricing and Adoption Trends
- 12.3.9 Leading Suppliers and Competition
- 12.3.10 Regional Demand and Opportunities
- 12.4 By End User - Market Size and Forecast, 2025-2035
- 12.4.1 Segment Definition and Scope
- 12.4.2 Historical Market Size, 2018-2025
- 12.4.3 Revenue Forecast, 2025-2035
- 12.4.4 Volume Forecast, 2025-2035
- 12.4.5 Base-Year Market Share, 2025
- 12.4.6 Segment CAGR and Growth Drivers
- 12.4.7 Subsegment Market Size and Forecast
- 12.4.7.1 Residential
- 12.4.7.2 Commercial
- 12.4.8 Subsegment Pricing and Adoption Trends
- 12.4.9 Leading Suppliers and Competition
- 12.4.10 Regional Demand and Opportunities
- 12.5 Segment Growth Comparison
- 12.6 Segment Attractiveness and Priority Matrix
Chapter 13 U.S. Gardening Tools End-Use and Application Market Outlook
- 13.1 End-Use Industry and Customer Demand Structure
- 13.2 Leading Applications and Customer Groups
- 13.3 End-Use Market Size, Share and Forecast
- 13.4 Major End-Use Industry Deep Dives
- 13.4.1 Customer Requirements and Use Cases
- 13.4.2 Demand and Replacement Cycles
- 13.4.3 Technical and Regulatory Considerations
- 13.4.4 Purchasing and Procurement Models
- 13.4.5 Leading Vendors and Distribution Channels
- 13.4.6 Forecast and Commercial Opportunities
- 13.5 Emerging Applications and Cross-Segment Demand
- 13.6 End-Use Industry Investment Priorities
Chapter 14 U.S. Gardening Tools Geographic Market Outlook, 2025-2035
- 14.1 Domestic Market Distribution and Demand Clusters
- 14.2 State- or Province-Wise Market Size and Forecast, 2025-2035
- 14.3 City and Metropolitan Market Outlook
- 14.4 Industrial, Manufacturing and Commercial Clusters
- 14.5 Geographic Concentration of Key End Users
- 14.6 Local Pricing and Purchasing Differences
- 14.7 Domestic Production Facilities and Capacity Map
- 14.8 Local Infrastructure and Project Pipeline
- 14.9 State-Level Policy and Incentive Differences
- 14.10 Subnational Investment Hotspots and Opportunities
- 14.11 Distribution and Logistics Networks
- 14.12 Domestic Competitive Footprint
Chapter 15 U.S. Gardening Tools Technology, Innovation and Sustainability Outlook
- 15.1 Technology Landscape and Maturity
- 15.2 Product, Process and Service Innovation
- 15.3 AI, Automation and Digital Tools in the Industry
- 15.4 Technology Adoption and Performance Benchmarking
- 15.5 Innovation Pipeline and R&D Investment
- 15.6 Patent and Intellectual Property Trends
- 15.7 Energy Efficiency and Resource Management
- 15.8 Sustainability, Recycling and Circularity
- 15.9 Technology Roadmap, 2025-2035
- 15.10 Risks of Obsolescence and Technology Substitution
Chapter 16 U.S. Gardening Tools Market Key Strategic Imperatives
- 16.1 Growth and Market Entry Priorities
- 16.2 High-Return Products and Segments
- 16.3 Pricing, Profitability and Cost Optimization
- 16.4 Technology Investment and Product Differentiation
- 16.5 Supply Chain Localization and Resilience
- 16.6 Distribution and Customer Acquisition
- 16.7 Partnership, Acquisition and Capacity Strategy
- 16.8 Regional Expansion Priorities
- 16.9 Short-, Medium- and Long-Term Actions
Chapter 17 Competition Outlook
- 17.1 Industry Competition Characteristics
- 17.2 Market Structure and Concentration
- 17.3 Market Share and Competitive Positioning, 2025
- 17.4 Company-Wise Revenue and Product Benchmarking
- 17.5 Production and Service Capacity Benchmarking
- 17.6 Technology, Pricing and Differentiation
- 17.7 Regional Footprint and Distribution Strength
- 17.8 Mergers, Acquisitions and Strategic Alliances
- 17.9 New Entrants and Competitive Threats
- 17.10 Porter's Five Forces and Industry Attractiveness
- 17.11 Competitive Outlook, 2025-2035
Chapter 18 Company Profiles
- 18.1 Company Coverage and Selection Criteria
- 18.2 The Toro Company
- 18.2.1 Business Description
- 18.2.2 Company Ownership and Geographic Presence
- 18.2.3 Product and Service Portfolio
- 18.2.4 Manufacturing and Operating Footprint
- 18.2.5 Production Capacity and Expansion Plans
- 18.2.6 Financial Performance and Investment
- 18.2.7 Market Share and Competitive Position
- 18.2.8 Technology and Innovation Capabilities
- 18.2.9 Strategic Alliances or Partnerships
- 18.2.10 Recent Developments
- 18.2.11 Growth Strategy and Outlook
- 18.3 Deere & Company
- 18.4 Husqvarna Group
- 18.5 Stanley Black & Decker
- 18.6 Techtronic Industries (Ryobi)
- 18.7 Chervon (EGO)
- 18.8 AriensCo
- 18.9 Briggs & Stratton
- 18.10 Fiskars Group
- 18.11 Veritage Brands (AMES)
- 18.12 Other Relevant Market Participants
Note: Every listed company is profiled on the structure shown under the first company. The company list is preliminary and may change based on research findings, market developments, data availability and client requirements.
Chapter 19 Disclaimer
- 19.1 Research and Forecast Disclaimer
- 19.2 Data Source and Estimation Limitations
Note: The depth of individual sections depends on data availability for this market. Volume, capacity, trade and other unit-based metrics are included where applicable.