
| REPORT ATTRIBUTE | DETAILS |
|---|---|
| Historical Period | 2019-2022 |
| Base Year | 2023 |
| Forecast Period | 2024-2032 |
| U.S. consumer electronics extended warranty market Size 2023 | USD 46,972.58 million |
| U.S. consumer electronics extended warranty market, CAGR | 8.45% |
| U.S. consumer electronics extended warranty market Size 2032 | USD 97,478.86 million |
Market Overview
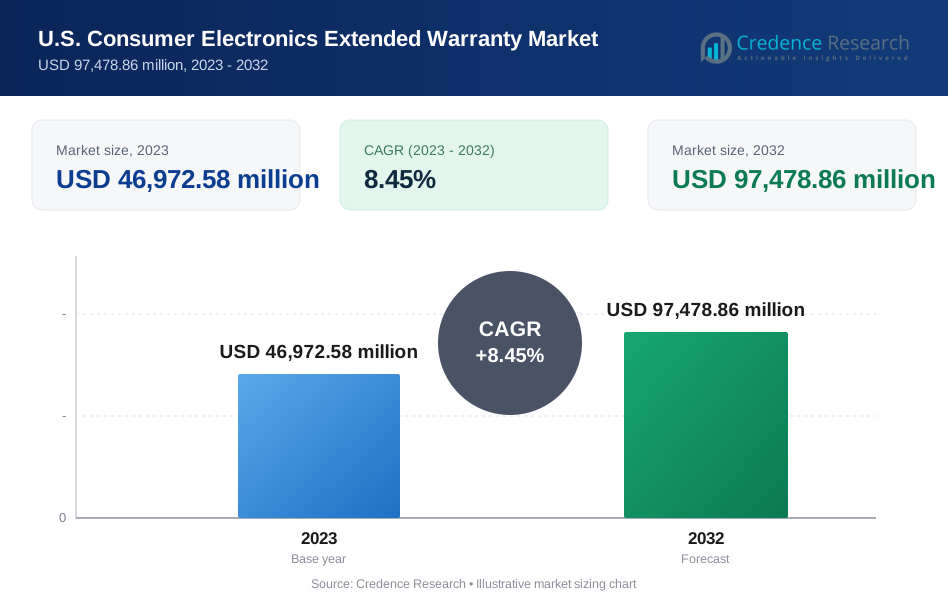
The U.S. consumer electronics extended warranty market is projected to grow from USD 46,972.58 million in 2023 to USD 97,478.86 million by 2032, at a compound annual growth rate (CAGR) of 8.45%.
The U.S. consumer electronics extended warranty market is driven by increasing consumer reliance on advanced electronics, rising incidences of device malfunctions, and a growing awareness of the benefits of extended warranties. Trends include the integration of comprehensive coverage plans, enhanced customer service offerings, and the adoption of digital platforms for efficient claims processing. The market is further bolstered by manufacturers' and retailers' strategies to differentiate their offerings through extended warranty options, catering to the demand for extended protection amidst rapid technological advancements and shorter product life cycles.
The U.S. consumer electronics extended warranty market is primarily concentrated in urban and suburban regions, where the penetration of high-end electronics is higher. Key players in this market include SquareTrade Inc., Best Buy Geek Squad, Asurion, Warranty Life, Upsie, Assurant Solutions, Amazon.com Inc., and Protect Your Bubble. These companies leverage strong distribution networks, strategic partnerships, and advanced digital platforms to offer diverse warranty plans. Their focus on customer service and innovative solutions helps them maintain a competitive edge in a rapidly evolving market driven by technological advancements and consumer demand for comprehensive protection.
Market Drivers
Rising Demand for Protection
Consumers are increasingly seeking to safeguard their electronics beyond the standard manufacturer’s warranty. This trend is particularly pronounced for expensive devices like smartphones, laptops, and high-end appliances, where repair costs can be significant. For instance, a survey found that about 28% of consumers purchase extended warranties on electronics. Extended warranties provide peace of mind and financial security in case of unexpected breakdowns, offering consumers an additional layer of protection that ensures their investments are secure. This demand for extended coverage is fueled by a growing awareness of the potential costs associated with repairing or replacing sophisticated electronic devices.
Increasing Complexity of Electronics
Modern consumer electronics are packed with sophisticated features and intricate components, making them more susceptible to malfunctions. As technology advances, the risk of technical issues due to these complexities also rises. For instance, one-quarter of people who had a phone that broke set out to repair it but ended up replacing it. Extended warranties offer crucial coverage for these potential problems, ensuring that consumers are not left with hefty repair bills. By providing protection against a wide range of issues that may not be covered under the standard warranty, extended warranties help consumers manage the risks associated with owning advanced electronics.
Prevalence of High-Value Electronics
The market is flooded with high-end electronics that carry premium price tags, prompting consumers who invest heavily in these devices to seek additional protection. For instance, the retail revenue from consumer electronics sales is expected to reach close to 510 billion U.S. dollars by 2024. Extended warranties serve as a shield against the financial burden of repairs or replacements for these high-value items. Consumers are more inclined to purchase extended warranties for their costly gadgets, recognizing the long-term benefits and security they offer. This trend underscores the importance of extended warranties in ensuring that consumers can confidently invest in high-end technology without fearing unexpected expenses.
Promotional Strategies by Retailers and Manufacturers
Retailers and manufacturers actively promote extended warranties as a value-added service, often bundling them with electronics purchases to entice consumers. These promotional strategies highlight the benefits of comprehensive protection and enhance the overall value proposition of the products. By offering extended warranties, businesses not only increase their revenue streams but also build stronger relationships with their customers. This approach ensures that consumers receive complete protection for their devices, fostering customer satisfaction and loyalty in a competitive market landscape.
Market Trends
Customization and Flexibility
Gone are the days of one-size-fits-all warranties. Today’s consumer electronics extended warranty market is characterized by a diverse array of options that offer varying coverage lengths and service plans. This customization allows consumers to tailor warranties to their specific needs and budgets. For instance, providers are now offering customizable plans tailored to customers’ needs. Consumers can choose plans that provide coverage for just a few years or extend the warranty period significantly longer, depending on how long they expect to use the device. Additionally, service plans can be adjusted to include different levels of support, from basic mechanical repair to comprehensive coverage that includes accidental damage and theft. This flexibility ensures that consumers can find a warranty that aligns perfectly with their expectations and financial considerations. By offering tailored solutions, companies can better meet the diverse demands of their customers, enhancing overall satisfaction and loyalty.
Digitalization and Convenience
The rise of e-commerce has significantly impacted the consumer electronics extended warranty market, leading to a surge in online warranty purchases. User-friendly interfaces and the seamless integration of warranties during the online checkout process have made it easier than ever for consumers to add extended protection to their purchases. For instance, more than 40 percent of online shoppers in the United States purchased online once or twice a week. This digital shift not only simplifies the buying process but also provides greater transparency and accessibility to warranty information. Consumers can now easily compare different warranty plans, read customer reviews, and make informed decisions without leaving the comfort of their homes. Additionally, digital platforms enable streamlined claims processing and management, reducing the hassle and time traditionally associated with warranty services. The convenience of online transactions, coupled with the ability to quickly resolve issues, enhances the appeal of extended warranties in the digital age.
Market Challenges Analysis
Consumer Skepticism and Lack of Transparency
Many consumers view extended warranties with suspicion, often believing these services are riddled with complex terms and exclusions. This skepticism is fueled by a perceived lack of transparency in warranty details, making it difficult for consumers to assess the true value of the service. Often, consumers are wary of the fine print and potential loopholes that could invalidate their claims. This mistrust is exacerbated by experiences of high claim denial rates, where consumers feel their legitimate issues are not covered due to technicalities. This can severely damage the reputation of warranty providers and erode consumer trust in the industry. To address these challenges, companies need to prioritize clear communication and transparency, ensuring that consumers fully understand the terms and conditions of their warranties. Simplifying the claims process and providing comprehensive, easy-to-understand documentation can help rebuild consumer confidence and demonstrate the real value of extended warranties.
Price Sensitivity and Competition from Short Product Lifecycles
Extended warranties often come with additional costs that some consumers might find unappealing, especially for less expensive electronics. Balancing affordability with comprehensive coverage remains a significant challenge for warranty providers. Consumers are increasingly price-sensitive and may opt out of purchasing extended warranties if they perceive the cost to outweigh the benefits. This price sensitivity is compounded by the rapid pace of technological advancements, which can render electronics obsolete within a short period. Consumers who frequently upgrade their devices may see little value in investing in long-term warranties. Furthermore, the increasing regulatory scrutiny aimed at ensuring fairness and transparency in warranty practices adds another layer of complexity for providers. They must navigate an evolving regulatory landscape to avoid penalties or non-compliance issues, all while striving to offer cost-effective and attractive warranty options. Providers need to develop innovative solutions, such as flexible pricing models and shorter-term warranties, to appeal to a broader range of consumers and remain competitive in a market characterized by rapid technological change.
Market Segmentation Analysis:
By Product Types:
The U.S. consumer electronics extended warranty market is segmented by product types, including laptops & PCs, mobiles & tablets, home entertainment devices, heating & cooling equipment, and others. Laptops & PCs and mobiles & tablets dominate the market due to their high usage rates and susceptibility to damage, driving significant demand for extended warranties. The increasing complexity and cost of repairs for these devices make extended warranties an attractive option for consumers. Home entertainment devices, such as smart TVs and sound systems, also contribute substantially to the market, as consumers seek to protect their investments in high-end electronics. Heating & cooling equipment, while a smaller segment, benefits from extended warranties due to the high cost of repairs and replacements. The "others" category includes various electronic gadgets and appliances, reflecting the broadening scope of the extended warranty market as consumer reliance on electronic devices continues to grow.
By Coverage Types:
The market is further segmented based on coverage types into standard protection plans and accidental protection plans. Standard protection plans typically cover mechanical and electrical failures after the manufacturer’s warranty expires, providing consumers with extended peace of mind. These plans are popular for all types of electronics, particularly those with higher initial costs or complex functionalities. Accidental protection plans, on the other hand, offer coverage for unexpected incidents such as drops, spills, and other forms of accidental damage. This type of plan is increasingly in demand, especially for portable devices like smartphones, tablets, and laptops, which are more prone to such incidents. The rising prevalence of high-value electronics and the desire for comprehensive protection are driving the growth of accidental protection plans. Both coverage types cater to the varying needs and concerns of consumers, ensuring that they can find appropriate and effective solutions for protecting their electronic investments.
Segments:
Based on Product Types
- Laptops & PCs
- Mobiles & Tablets
- Home Entertainment Devices
- Heating & Cooling Equipment
- Others
Based on Coverage Types
- Standard Protection Plan
- Accidental Protection Plan
Based on Distribution Channel
- Manufacturers
- Retailers
- Others
Based on the Geography:
- Northeast
- Western
- Southern
- Midwest
- Other regions
Regional Analysis
In the Northeast region, comprising states like New York, Massachusetts, and Pennsylvania, the extended warranty market holds a significant share of approximately 22%. Consumers in this region tend to be tech-savvy and value the added protection for their high-end electronics. The presence of major metropolitan areas and a concentration of affluent consumers contribute to the strong demand for extended warranty plans.
The Western region, encompassing states such as California, Washington, and Colorado, accounts for approximately 27% of the extended warranty market share. This region is home to several tech hubs and early adopters of consumer electronics. Consumers in the West are generally receptive to extended warranty offerings, particularly for premium devices and innovative products.
Key Player Analysis
- SquareTrade Inc.
- Best Buy Geek Squad
- Asurion
- Warranty Life
- Upsie
- Assurant Solutions
- com Inc.
- Protect Your Bubble
Competitive Analysis
In the U.S. consumer electronics extended warranty market, leading players like SquareTrade Inc., Best Buy Geek Squad, Asurion, Warranty Life, Upsie, Assurant Solutions, Amazon.com Inc., and Protect Your Bubble dominate through a combination of extensive service offerings and robust customer support. SquareTrade Inc. is renowned for its user-friendly digital platforms and quick claims processing, giving it a competitive edge. Best Buy Geek Squad leverages its in-store presence and brand reputation to attract customers. Asurion excels with comprehensive mobile protection plans and partnerships with major carriers. Warranty Life and Upsie offer competitive pricing and flexible plans, appealing to cost-sensitive consumers. Assurant Solutions focuses on diverse product coverage and strong corporate relationships, while Amazon.com Inc. integrates extended warranties seamlessly into its vast online retail ecosystem. Protect Your Bubble distinguishes itself with unique coverage options for gadgets and lifestyle products. These players continuously innovate and adapt to consumer needs, maintaining their market leadership.
Recent Developments
In April 2024, Asurion had forged a partnership with electric scooter manufacturer Okinawa Autotech to introduce an extended warranty initiative in India, covering essential powertrain components. This collaboration aims to provide Okinawa Autotech customers with added peace of mind and confidence in their electric scooter ownership experience.
In March 2024, ASSURANT Inc. unveiled an innovative AI-powered claims chatbot designed to facilitate swift and hassle-free claims processing for customers, enhancing overall service efficiency and customer experience.
In February 2024, AmTrust disclosed adjustments in automotive warranty program claim severity amidst shifting industry dynamics. Concurrently, the company intensified its focus on engaging with past customers, aiming to bolster customer satisfaction and retention.
In January 2023, Voltas and OneDios joined forces to roll out a nationwide extended warranty program, empowering customers to purchase extended warranties for Voltas and Voltas Beko products via the OneDios app. This collaboration ensures access to brand-authorized services, original spare parts, and competitive pricing, while the app simplifies warranty claims and enables users to lodge complaints in under 60 seconds.
Market Concentration & Characteristics
Market concentration in the U.S. consumer electronics extended warranty market reflects a landscape dominated by a select group of key players who wield significant influence due to their extensive service offerings and strong brand presence. These leading companies leverage various strategies such as user-friendly digital platforms, quick claims processing, competitive pricing, and strategic partnerships to maintain their market share. Characteristics of this market include a high level of competition driven by technological advancements, consumer demand for comprehensive protection, and evolving regulatory landscapes. Moreover, the market exhibits a trend towards customization and flexibility, with consumers seeking tailored warranty plans that suit their specific needs and budgets. As technology continues to evolve and consumer preferences shift, market players must remain agile and innovative to adapt to changing dynamics and sustain their competitive positions in this dynamic industry.
Report Coverage
The research report offers an in-depth analysis based on Product Types, Coverage Types, , Distribution Channel and Geography. It details leading market players, providing an overview of their business, product offerings, investments, revenue streams, and key applications. Additionally, the report includes insights into the competitive environment, SWOT analysis, current market trends, as well as the primary drivers and constraints. Furthermore, it discusses various factors that have driven market expansion in recent years. The report also explores market dynamics, regulatory scenarios, and technological advancements that are shaping the industry. It assesses the impact of external factors and global economic changes on market growth. Lastly, it provides strategic recommendations for new entrants and established companies to navigate the complexities of the market.
Future Outlook
- Continued Growth: The U.S. consumer electronics extended warranty market is expected to experience sustained growth driven by increasing consumer reliance on advanced electronics.
- Technological Advancements: Future outlook includes integration of smart technologies for proactive maintenance and issue detection, enhancing the value proposition of extended warranties.
- Enhanced Coverage Options: Consumers can expect more comprehensive coverage options, including protection against accidental damage, theft, and emerging risks associated with evolving technologies.
- Digital Transformation: The market will witness further digitalization, with online platforms facilitating seamless warranty purchases, claims processing, and customer service interactions.
- Regulatory Compliance: Warranty providers will need to navigate evolving regulatory landscapes to ensure compliance with consumer protection laws and maintain trust among consumers.
- Personalized Solutions: Companies will increasingly offer personalized warranty plans tailored to individual consumer needs and preferences.
- Partnerships and Alliances: Strategic partnerships between warranty providers and electronics manufacturers or retailers will expand, offering consumers bundled warranty options and enhancing market competitiveness.
- Focus on Customer Experience: There will be a heightened focus on improving customer experience through streamlined claims processes, responsive customer support, and transparent communication.
- Sustainability Initiatives: Expect to see a growing emphasis on sustainability, with warranty providers offering eco-friendly options and promoting responsible disposal and recycling of electronic devices.
- Market Consolidation: The market may witness consolidation as larger players acquire smaller competitors to expand their market share and diversify their service offerings.
Request a Free Sample
Fill in your details and we'll send you a free sample report.
- Sample data tables & charts
- Research methodology
Need a Custom Version of This Report?
Tailor the scope, geography, or segments to your exact requirements.
- Custom geography or segment scope
- Direct access to our analyst team
Frequently Asked Questions
What is the current size of the U.S. Consumer Electronics Extended Warranty Market?
What factors are driving the growth of the U.S. Consumer Electronics Extended Warranty Market?
What are the key segments within the U.S. Consumer Electronics Extended Warranty Market?
What are some challenges faced by the U.S. Consumer Electronics Extended Warranty Market?
Who are the major players in the U.S. Consumer Electronics Extended Warranty Market?
Which segment is leading the market share?
Table of Content
Chapter 1. Report Introduction
- 1.1 Report Description & Purpose
- 1.1.1 Report Title & Market Definition
- 1.1.2 Unique Selling Propositions (USP) & Key Differentiators
- 1.1.3 Value Proposition for Stakeholders
- 1.2 Research Objectives
- 1.2.1 Market Sizing Objectives (Volume & Revenue)
- 1.2.2 Segmentation Objectives
- 1.2.3 Competitive Intelligence Objectives
- 1.2.4 Forecast & Scenario Objectives
- 1.3 Report Scope
- 1.3.1 U.S. Consumer Electronics Extended Warranty Scope – Types & Subtypes Covered
- 1.3.2 Geographic Scope – Regions & Countries Covered
- 1.3.3 Historical Period, Base Year & Forecast Period (2023; forecast to 2032)
- 1.3.4 Inclusions & Exclusions
- 1.4 HS Code & Classification Framework
- 1.5 Currency, Units & Pricing Basis
- 1.6 Target Stakeholders
- 1.7 Limitations & Assumptions
Chapter 2. Executive Summary
- 2.1 Global U.S. Consumer Electronics Extended Warranty Market Snapshot
- 2.1.1 Market Size – Historical (2023) & Forecast (2023-2032) (2023: USD 46,972.58 million → 2032: USD 97,478.86 million)
- 2.1.2 Volume & Revenue – Global Totals
- 2.1.3 Key Market Highlights – Top Five Facts
- 2.2 U.S. Consumer Electronics Extended Warranty Market Segmentation Snapshot
- 2.2.1 Market Split by Region – 2023 vs. 2032
- 2.3 Competitive Snapshot
- 2.3.1 Top 10 Players by Revenue Share – 2023
- 2.3.2 Top 10 Players by Volume Share – 2023
- 2.3.3 Recent Strategic Developments (18-Month Summary)
- 2.4 Key Investment Highlights & Strategic Conclusions
Chapter 3. U.S. Consumer Electronics Extended Warranty Market Dynamics & Industry Analysis
- 3.1 Market Overview & Context
- 3.1.1 U.S. Consumer Electronics Extended Warranty Market Position in the Broader Automotive Value Chain
- 3.1.2 OEM vs. Replacement Market Dynamics
- 3.1.3 Market Maturity & Development Stage by Region
- 3.2 U.S. Consumer Electronics Extended Warranty Market Drivers
- 3.3 U.S. Consumer Electronics Extended Warranty Market Restraints & Challenges
- 3.4 U.S. Consumer Electronics Extended Warranty Market Opportunities
- 3.5 Porter's Five Forces Analysis
- 3.5.1 Threat of New Entrants
- 3.5.2 Bargaining Power of Suppliers
- 3.5.3 Bargaining Power of Buyers
- 3.5.4 Threat of Substitutes
- 3.5.5 Competitive Rivalry – Intensity Assessment
- 3.6 U.S. Consumer Electronics Extended Warranty Value Chain Analysis
- 3.6.1 Upstream – Raw Material/Input Suppliers
- 3.6.1.1 Raw Material/Input 1
- 3.6.1.2 Raw Material/Input 2
- 3.6.1.3 Raw Material/Input 3
- 3.6.2 Midstream – Production/Manufacturing/Service Delivery
- 3.6.2.1 Production/Process Overview
- 3.6.2.2 Key Facility Locations & Capacity by Manufacturer
- 3.6.3 Downstream – Distribution & End Consumer
- 3.6.3.1 Primary Channel – B2B/OEM
- 3.6.3.2 Secondary Channels – Dealer, Retail, Online, Direct
- 3.6.4 Value Chain Profitability Analysis
- 3.6.1 Upstream – Raw Material/Input Suppliers
- 3.7 PESTEL Analysis
- 3.7.1 Political Factors
- 3.7.2 Economic Factors
- 3.7.3 Social Factors
- 3.7.4 Technological Factors
- 3.7.5 Environmental Factors
- 3.7.6 Legal Factors
- 3.8 U.S. Consumer Electronics Extended Warranty Supply Chain Analysis
- 3.8.1 Raw Material/Input Supply Risk Assessment
- 3.8.2 Manufacturing Concentration Risk (Geographic Exposure)
- 3.8.3 Trade Disruption Impact Analysis
- 3.9 Regulatory & Policy Landscape
Note: The regulatory and policy landscape section covers regulations based on their applicability to the market, U.S. Consumer Electronics Extended Warranty category, geography, and scope of the study. Only regulatory frameworks with a material impact on operations, compliance, trade, sustainability, or market access are analyzed in detail.
Chapter 4. Key Investment Pockets & Opportunity Analysis
- 4.1 U.S. Consumer Electronics Extended Warranty Market Attractiveness Analysis
- 4.1.1 By Region – Investment Attractiveness Matrix (Volume × CAGR)
- 4.2 Absolute Revenue Growth Opportunity
- 4.2.1 By Region – Absolute USD Growth Through 2032
- 4.3 Incremental Volume Opportunity
- 4.3.1 By Region – Incremental Volume Through 2032
- 4.3.2 Segment – Incremental Volume
- 4.4 Emerging Submarket Opportunity Deep Dive (Subject to Applicability)
- 4.5 Emerging Market Opportunity Scorecards
- 4.5.1 United States
- 4.5.2 Europe
- 4.5.3 Asia
- 4.5.4 Middle East & Africa
Note: Emerging Market Opportunity Scorecards will be included based on relevance and strategic importance. Regions listed are indicative and may vary depending on data availability and market dynamics.
Chapter 5. U.S. Consumer Electronics Extended Warranty Import-Export Analysis & Trade Flows
- 5.1 Global Trade Overview
- 5.1.1 Global Export Value by Country (2023)
- 5.1.2 Global Export Volume by Country (2023)
- 5.1.3 Global Import Value by Country (2023)
- 5.1.4 Global Import Volume by Country (2023)
- 5.1.5 Net Trade Balance by Country (2023)
- 5.2 Export Analysis – Segment
- 5.2.1 Type 1 (HS Code)
- 5.2.2 Type 2 (HS Code)
- 5.2.3 Type 3 (HS Code)
- 5.2.4 Type 4 (HS Code)
- 5.2.5 Type 5 (HS Code)
- 5.3 Import Analysis – Segment
- 5.3.1 Type 1 (HS Code)
- 5.3.2 Type 2 (HS Code)
- 5.3.3 Type 3 (HS Code)
- 5.3.4 Type 4 (HS Code)
- 5.3.5 Type 5 (HS Code)
- 5.4 Average Unit Trade Prices
- 5.4.1 Average Export Price – Segment & Country
- 5.4.2 Average Import Price – Segment & Source Country
- 5.4.3 Price Trends (2023)
- 5.5 Key Trade Route Analysis
- 5.5.1 Trade Route 1
- 5.5.2 Trade Route 2
- 5.5.3 Trade Route 3
- 5.5.4 Trade Route 4
- 5.5.5 Trade Route 5
- 5.6 Trade Policy Impact Assessment
- 5.6.1 US Anti-Dumping & Section 301 Tariffs
- 5.6.2 EU Customs Union Impact
- 5.6.3 Major Free Trade Agreements
- 5.6.4 USMCA Rules of Origin
Note: Trade policy analysis will be included only where relevant to the U.S. Consumer Electronics Extended Warranty market.
Chapter 6. Competitive Landscape & Company Benchmarking
- 6.1 U.S. Consumer Electronics Extended Warranty Market Concentration & Structure
- 6.1.1 Herfindahl-Hirschman Index (HHI) – vs. 2023
- 6.1.2 Tier 1, Tier 2 & Tier 3 Market Structure
- 6.1.3 Global, Regional & Local Player Dynamics
- 6.2 U.S. Consumer Electronics Extended Warranty Market Share Analysis – 2023
- 6.2.1 Global Revenue Share by Company
- 6.2.2 Global Volume Share by Company
- 6.2.3 Regional Revenue Share
- 6.2.4 Market Share Evolution ( vs. 2023)
- 6.2.5 OEM Segment Share by Company
- 6.2.6 Replacement Segment Share by Company
- 6.3 Production/Delivery Capacity & Facility Analysis
- 6.3.1 Global Installed Capacity
- 6.3.2 Capacity Utilization Rates
- 6.3.3 Production/Output Volume
- 6.3.4 Facility Locations & Capacity Map
- 6.3.5 Planned Capacity Additions
- 6.4 U.S. Consumer Electronics Extended Warranty Competitive Benchmarking Matrix
- 6.4.1 Revenue, Volume, CAGR & Profitability Comparison
- 6.4.2 Channel Revenue Mix
- 6.4.3 Geographic Revenue Exposure
- 6.4.4 R&D Intensity
- 6.4.5 Sustainability Maturity
- 6.5 Strategic Developments in U.S. Consumer Electronics Extended Warranty (Last 24 Months)
- 6.5.1 Mergers, Acquisitions & Divestments
- 6.5.2 New U.S. Consumer Electronics Extended Warranty Launches
- 6.5.3 Facility Expansions
- 6.5.4 Strategic Alliances, Joint Ventures & Partnerships
- 6.5.5 Distribution Expansion & Market Entry
- 6.5.6 Sustainability & ESG Initiatives
- 6.6 Competitive Strategy Mapping
- 6.6.1 Leader, Challenger, Follower & Niche Classification
- 6.6.2 Pricing Strategy Comparison
- 6.6.3 Channel Strategy Matrix
Note: Strategic developments are included based on their materiality and the availability of reliable information.
Chapter 7. Global U.S. Consumer Electronics Extended Warranty Market – By Distribution Channel
- 7.1 Segment Overview
- 7.1.1 Volume & Revenue Split by Channel (2023 & 2032)
- 7.1.2 Channel Mix Evolution (2023-2032)
Chapter 8. Regional Market Analysis – Global Overview
- 8.1 Global Regional Overview
- 8.1.1 Regional Volume Share
- 8.1.2 Regional Revenue Share
- 8.1.3 Regional Volume by Region
- 8.1.4 Regional Revenue by Region
- 8.1.5 Regional Forecast Through 2032
- 8.2 Cross-Regional Segment Analysis
- 8.2.1 By Distribution Channel
- 8.2.2 By Brand/Price Tier
Chapter 9. North America U.S. Consumer Electronics Extended Warranty Market
- 9.1 United States
- 9.2 Canada
- 9.3 Mexico
Chapter 10. Europe U.S. Consumer Electronics Extended Warranty Market
- 10.1 Germany
- 10.2 France
- 10.3 Italy
- 10.4 United Kingdom
- 10.5 Spain
- 10.6 Poland
- 10.7 Russia
- 10.8 Netherlands
- 10.9 Belgium
- 10.10 Sweden
- 10.11 Denmark
- 10.12 Norway
- 10.13 Rest of Europe
Chapter 11. Asia Pacific U.S. Consumer Electronics Extended Warranty Market
- 11.1 China
- 11.2 India
- 11.3 Japan
- 11.4 South Korea
- 11.5 Thailand
- 11.6 Indonesia
- 11.7 Vietnam
- 11.8 Malaysia
- 11.9 Australia
- 11.10 Rest of Asia Pacific
Chapter 12. Latin America U.S. Consumer Electronics Extended Warranty Market
- 12.1 Brazil
- 12.2 Argentina
- 12.3 Colombia
- 12.4 Chile
- 12.5 Rest of Latin America
Chapter 13. Middle East U.S. Consumer Electronics Extended Warranty Market
- 13.1 Saudi Arabia
- 13.2 United Arab Emirates
- 13.3 Turkey
- 13.4 Israel
- 13.5 Iran
- 13.6 Rest of the Middle East
Chapter 14. Africa U.S. Consumer Electronics Extended Warranty Market
- 14.1 South Africa
- 14.2 Egypt
- 14.3 Nigeria
- 14.4 Morocco
- 14.5 Rest of Africa
Chapter 15. U.S. Consumer Electronics Extended Warranty Company Profiles
- 15.1 [Company 01]
- 15.1.1 Company Overview
- 15.1.2 Key Management Personnel
- 15.1.3 Products & Services Portfolio
- 15.1.4 Financial Performance
- 15.1.5 Key Market Focus & Geographic Presence
- 15.1.6 Recent Developments & Strategic Initiatives
Note: The company profile list is preliminary and may change based on research findings, market developments, data availability, and client requirements.
Chapter 16. Appendices
- Appendix A – List of Abbreviations & Acronyms
- Appendix B – Industry Classification Code Reference – Full Series
- Appendix C – Production & Capacity Data Tables
- Appendix D – End-Use & Demand Base Tables
- Appendix E – Consumption & Replacement Rate Assumptions
- Appendix F – ASP Reference Tables
- Appendix G – Manufacturing & Facility Database
- Appendix H – Import-Export Data Tables
- Appendix I – Regulatory Summary Tables
- Appendix J – Primary Research Participant List (Anonymized)
- Appendix K – Primary Research Questionnaire Framework
- Appendix L – Data Sources & Bibliography
- Appendix M – Market Size Divergence & Source Comparison
Chapter 17. Research Methodology
- 17.1 Research Framework & Philosophy
- 17.2 Secondary Research – Sources, Hierarchy & Data Extraction
- 17.3 Data Modeling – Bottom-Up & Top-Down Market Sizing
- 17.4 Primary Research – Stakeholder Framework, LOI & Sample Sizes
- 17.5 Forecast Methodology – Regression, Scenario & Sensitivity Analysis
- 17.6 Quality Control – Four-Layer Validation Framework
- 17.7 Limitations & Standard Assumptions
- 17.8 Disclaimer
