Market Overview
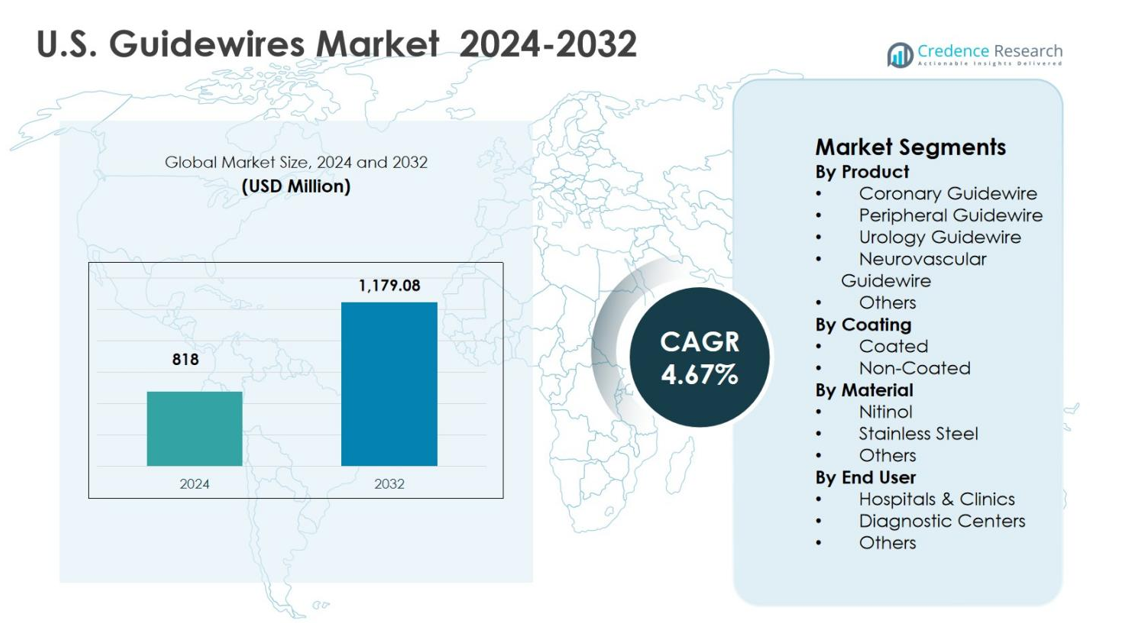
The U.S. Guidewires Market size was valued at USD 818 million in 2024 and is anticipated to reach USD 1,179.08 million by 2032, growing at a CAGR of 4.67% during the forecast period.
| REPORT ATTRIBUTE |
DETAILS |
| Historical Period |
2020-2023 |
| Base Year |
2024 |
| Forecast Period |
2025-2032 |
| U.S. Guidewires Market Size 2024 |
USD 818 million |
| U.S. Guidewires Market, CAGR |
4.67% |
| U.S. Guidewires Market Size 2032 |
USD 1,179.08 million |
The U.S. Guidewires Market is driven by strong participation from established medical device manufacturers such as Boston Scientific Corporation, Medtronic Plc, Abbott Laboratories Inc., Terumo Medical Corporation, Becton Dickinson & Company, Cook Medical, Teleflex Incorporated, B. Braun, Stryker Inc., and Olympus Corporation, all of which focus on innovation, product reliability, and broad clinical application coverage. These players emphasize advanced coated and nitinol-based guidewires to support complex coronary, peripheral, and neurovascular procedures. Regionally, the South leads the U.S. Guidewires Market with a 34.2% share in 2024, supported by a large patient base, high prevalence of cardiovascular diseases, expanding hospital infrastructure, and growing adoption of minimally invasive interventions across outpatient and ambulatory care settings.
Market Insights
- The U.S. Guidewires Market was valued at USD 818 million in 2024 and is expected to reach USD 1,179.08 million by 2032, expanding at a CAGR of 4.67% during the forecast period.
- Market growth is driven by rising cardiovascular and peripheral vascular disease prevalence, increasing volumes of coronary and peripheral interventions, and strong adoption of minimally invasive procedures across hospitals and outpatient facilities.
- Ongoing trends include growing demand for coated guidewires, which held a 68.9% share in 2024, and nitinol guidewires with a 54.3% share, supported by superior flexibility, torque control, and performance in complex anatomies.
- Market restraints include the high cost of advanced guidewire technologies and stringent regulatory and quality compliance requirements, which can limit adoption in cost-sensitive healthcare settings.
- Regionally, the South led with a 34.2% share in 2024, followed by the West at 27.8%, the Midwest at 21.6%, and the Northeast at 16.4%, while coronary guidewires dominated the product segment with a 41.6% share.
Access crucial information at unmatched prices!
Request your sample report today & start making informed decisions powered by Credence Research Inc.!
Download Sample
Market Segmentation Analysis:
By Product:
The U.S. Guidewires Market by product is led by coronary guidewires, which accounted for 41.6% market share in 2024, driven by the high volume of percutaneous coronary intervention procedures and the rising prevalence of cardiovascular diseases across the U.S. Coronary guidewires benefit from continuous innovation in torque control, tip flexibility, and lesion-crossing performance. Peripheral guidewires follow, supported by growing peripheral artery disease cases, while neurovascular and urology guidewires gain traction due to expanding minimally invasive neurological and urological interventions. Strong hospital adoption and physician preference reinforce coronary guidewire dominance.
- For instance, Boston Scientific launched the Kinetix Guidewire in 2009 for PCI procedures, featuring a micro-cut nitinol sleeve that provides significantly improved torque control over conventional spring coil designs, along with enhanced flexibility and a soft distal tip.
By Coating:
By coating, the coated guidewires segment dominated the U.S. Guidewires Market with a 68.9% share in 2024, owing to superior lubricity, reduced friction, and enhanced navigation through complex vascular anatomies. Hydrophilic and hybrid coatings significantly improve procedural efficiency, lower vessel trauma, and reduce procedure time, making them the preferred choice in interventional cardiology and neurovascular procedures. Rising demand for advanced minimally invasive techniques and increasing procedural complexity further support coated guidewire adoption, while non-coated guidewires maintain limited use in cost-sensitive and straightforward clinical applications.
- For instance, Terumo’s GLIDEWIRE Hydrophilic Coated Guidewire employs TERUMO Glide Technology, a proprietary hydrophilic coating that delivers unmatched lubricity and superior retention for smooth advancement through tortuous vessels in cardiology procedures.
By Material:
Based on material, nitinol guidewires held the largest share at 54.3% in 2024 in the U.S. Guidewires Market, supported by their superior flexibility, kink resistance, and shape memory properties. Nitinol guidewires are widely used in complex coronary, peripheral, and neurovascular interventions where precise navigation is critical. Their ability to maintain performance in tortuous anatomies drives strong clinician preference. Stainless steel guidewires retain demand for applications requiring higher pushability, while other materials serve niche clinical requirements, limiting their overall market contribution.
Key Growth Drivers
Rising Burden of Cardiovascular and Peripheral Vascular Diseases
The U.S. Guidewires Market is strongly driven by the increasing prevalence of cardiovascular diseases, peripheral artery disease, and diabetes-related vascular complications. An aging population and sedentary lifestyles continue to elevate demand for coronary and peripheral interventions. Guidewires remain essential in angioplasty, stent placement, and complex lesion management procedures. Expanded access to interventional cardiology services and early diagnostic capabilities further increase procedure volumes, sustaining consistent demand for high-performance guidewires across U.S. hospitals and specialty care centers.
- For instance, Boston Scientific’s COMET™ pressure guidewire supports FFR, DFR™, and Pd/Pa measurements in coronary interventions, streamlining workflows to cut procedure times during angioplasty and stent delivery.[image:1 from fetch]
Shift Toward Minimally Invasive Interventional Procedures
The growing preference for minimally invasive procedures significantly supports growth in the U.S. Guidewires Market. Interventional cardiology, neurovascular, and urology treatments increasingly rely on catheter-based techniques due to shorter recovery times, reduced complications, and lower healthcare costs. Guidewires enable precise navigation and device delivery in these procedures. Rising physician adoption of minimally invasive approaches and the expansion of catheterization laboratories and outpatient facilities continue to drive guidewire consumption nationwide.
- For instance, Cook Medical’s Roadrunner PC Hydrophilic Wire Guide, for instance, establishes ureteral access and aids device exchange in urological procedures like ureteroscopy and stone extraction.
Technological Advancements in Guidewire Design
Ongoing advancements in guidewire technology serve as a key growth driver in the U.S. Guidewires Market. Innovations in hydrophilic coatings, torque response, tip control, and material engineering improve procedural efficiency and clinical outcomes. Nitinol-based guidewires offer enhanced flexibility and kink resistance for complex anatomies. Manufacturers increasingly focus on application-specific designs, supporting higher success rates in challenging interventions and reinforcing clinician confidence and product adoption.
Key Trends & Opportunities
Increasing Adoption of Coated and Specialty Guidewires
The growing adoption of coated and specialty guidewires represents a major trend and opportunity in the U.S. Guidewires Market. Hydrophilic and hybrid-coated guidewires improve trackability and reduce vessel trauma, particularly in complex and tortuous anatomies. Rising volumes of neurovascular and chronic total occlusion procedures accelerate demand for specialized designs. This trend encourages manufacturers to expand premium product portfolios and introduce innovative, application-focused guidewire solutions, while also supporting improved procedural success rates, shorter intervention times, enhanced physician confidence, and broader adoption across advanced interventional care settings.
- For instance, Invamed’s InWIRE® 0.014” and 0.018” CTO Guidewire incorporates a low-friction hydrophilic coating over a Nitinol core, supporting customizable tip shaping to navigate tortuous vessels and tight chronic total occlusions with enhanced penetration and reduced vessel wall adhesion.
Expansion of Ambulatory Surgical Centers and Outpatient Care
The rapid growth of ambulatory surgical centers presents a significant opportunity for the U.S. Guidewires Market. Outpatient facilities increasingly perform interventional procedures due to cost efficiency and patient convenience. Higher procedure throughput in these settings boosts demand for reliable and easy-to-handle guidewires. Manufacturers benefit from recurring volume demand and opportunities to develop cost-effective products tailored for outpatient and day-care procedural environments, while supporting faster patient turnover, standardized procedural workflows, and consistent adoption across expanding outpatient cardiovascular and specialty intervention programs.
- For instance, Asahi Intecc’s ASAHI SION blue guidewire serves as a well-balanced workhorse for frontline coronary interventions, providing precise control in simple to complex outpatient cases with enhanced torque response.
Key Challenges
High Cost of Advanced Guidewire Technologies
The high cost of advanced and specialty guidewires remains a notable challenge in the U.S. Guidewires Market. Premium coatings, specialized materials, and application-specific designs increase product pricing, placing pressure on hospital and outpatient procurement budgets. Smaller healthcare facilities often face difficulties adopting high-end guidewires, leading to cost-performance trade-offs that can limit penetration of innovative products and slow adoption of next-generation technologies, especially in community hospitals and emerging outpatient care centers.
Stringent Regulatory and Quality Compliance Requirements
Strict regulatory frameworks and quality compliance requirements challenge manufacturers in the U.S. Guidewires Market. Regulatory approvals, clinical validation, and post-market surveillance increase development timelines and operational costs. Maintaining consistent quality standards and meeting evolving safety regulations demand significant investment, potentially delaying product launches and restricting rapid innovation, particularly for emerging market participants, while also increasing barriers to entry and limiting the pace of portfolio expansion across advanced interventional product lines.
Regional Analysis
Northeast
The Northeast accounted for 16.4% market share in 2024 in the U.S. Guidewires Market, supported by a high concentration of tertiary care hospitals, academic medical centers, and advanced cardiovascular institutes. States such as New York, Massachusetts, and Pennsylvania drive demand due to strong adoption of complex coronary and neurovascular interventions. High procedural volumes, early adoption of technologically advanced guidewires, and a well-established reimbursement framework contribute to steady market growth. Continuous investments in interventional cardiology infrastructure and skilled physician availability further strengthen regional demand.
Midwest
The Midwest captured 21.6% market share in 2024, driven by widespread access to cardiovascular care across urban and semi-urban healthcare facilities. States including Illinois, Ohio, and Michigan report strong utilization of coronary and peripheral guidewires due to a high prevalence of cardiovascular and metabolic disorders. The presence of large hospital networks and integrated healthcare systems supports consistent procedural volumes. Cost-efficient care delivery models and increasing adoption of minimally invasive interventions continue to support stable demand for guidewires throughout the Midwest region.
South
The South dominated the U.S. Guidewires Market with a 34.2% share in 2024, supported by a large patient population and high incidence of cardiovascular disease, diabetes, and obesity. States such as Texas, Florida, and Georgia contribute significantly due to expanding hospital infrastructure and rising interventional procedure volumes. Growth in ambulatory surgical centers and outpatient catheterization labs further boosts guidewire demand. Favorable demographic trends, increasing healthcare investments, and expanding access to minimally invasive procedures position the South as the leading regional market.
West
The West accounted for 27.8% market share in 2024, driven by strong adoption of advanced medical technologies and a high concentration of specialty care centers. California leads regional demand due to advanced interventional cardiology programs and a robust medical device ecosystem. High utilization of coated and specialty guidewires is supported by complex procedural requirements and innovation-driven healthcare systems. Favorable healthcare spending, strong physician expertise, and growing outpatient procedure volumes continue to reinforce the West’s significant contribution to the U.S. Guidewires Market.
Market Segmentations:
By Product
- Coronary Guidewire
- Peripheral Guidewire
- Urology Guidewire
- Neurovascular Guidewire
- Others
By Coating
By Material
- Nitinol
- Stainless Steel
- Others
By End User
- Hospitals & Clinics
- Diagnostic Centers
- Others
By Geography
- Northeast
- Midwest
- South
- West
Competitive Landscape
The U.S. Guidewires Market features the presence of key players including Boston Scientific Corporation, Medtronic Plc, Abbott Laboratories Inc., Terumo Medical Corporation, Becton Dickinson & Company, Cook Medical, Teleflex Incorporated, B. Braun, Stryker Inc., and Olympus Corporation. The market is characterized by strong emphasis on product innovation, portfolio expansion, and procedural specialization to address complex coronary, peripheral, and neurovascular interventions. Leading companies focus on developing advanced coated and nitinol-based guidewires to enhance trackability, torque response, and lesion-crossing capability. Strategic investments in research and development support continuous performance improvements and application-specific designs. Companies also strengthen their positions through hospital partnerships, physician training programs, and broad distribution networks. Regulatory compliance, product reliability, and brand reputation play a critical role in purchasing decisions, reinforcing the dominance of established manufacturers within the U.S. Guidewires Market.
Shape Your Report to Specific Countries or Regions & Enjoy 30% Off!
Key Player Analysis
Recent Developments
- In October 2025, Medtronic plc launched its Stedi Extra Support guidewire during the Transcatheter Cardiovascular Therapeutics (TCT) conference to enhance performance and stability of transcatheter aortic valve replacement procedures in the U.S. market.
- In October 2025, Asahi Intecc USA entered the U.S. gastrointestinal device segment with the launch of the Fielder 18 endoscopic guidewire and Tornus ES endoscopic dilator, expanding its guidewire portfolio beyond vascular interventions.
- In July 2025, Medtronic entered an exclusive U.S. distribution agreement with Future Medical Design Co., Ltd. (FMD) for specialty peripheral guidewires, including the first 400 cm 0.018” option for transradial access in peripheral arterial disease treatment
Report Coverage
The research report offers an in-depth analysis based on Product, Coating, Material, End User and Geography. It details leading market players, providing an overview of their business, product offerings, investments, revenue streams, and key applications. Additionally, the report includes insights into the competitive environment, SWOT analysis, current market trends, as well as the primary drivers and constraints. Furthermore, it discusses various factors that have driven market expansion in recent years. The report also explores market dynamics, regulatory scenarios, and technological advancements that are shaping the industry. It assesses the impact of external factors and global economic changes on market growth. Lastly, it provides strategic recommendations for new entrants and established companies to navigate the complexities of the market.
Future Outlook
- The U.S. Guidewires Market will continue to benefit from rising volumes of coronary and peripheral interventional procedures across hospitals and outpatient facilities.
- Increasing adoption of minimally invasive techniques will sustain consistent demand for high-performance and specialty guidewires.
- Technological innovation in coatings, tip control, and torque response will remain a primary focus for manufacturers.
- Nitinol-based guidewires will witness stronger adoption due to superior flexibility and performance in complex anatomies.
- Growing use of guidewires in neurovascular and urology interventions will expand application diversity.
- Expansion of ambulatory surgical centers will increase procedural throughput and guidewire consumption.
- Physicians will increasingly prefer application-specific guidewires tailored to lesion complexity and anatomy.
- Manufacturers will strengthen clinical training and education programs to support product adoption.
- Regulatory compliance and quality assurance will remain critical for sustaining market credibility.
- Strategic collaborations and product line extensions will shape long-term market positioning.


