
| REPORT ATTRIBUTE | DETAILS |
|---|---|
| Historical Period | 2020-2023 |
| Base Year | 2024 |
| Forecast Period | 2025-2032 |
| U.S. Safety Eyewear Market Size 2024 | USD 1,239.76 million |
| U.S. Safety Eyewear Market, CAGR | 6.17% |
| U.S. Safety Eyewear Market Size 2032 | USD 2,002.23 million |
Market Overview
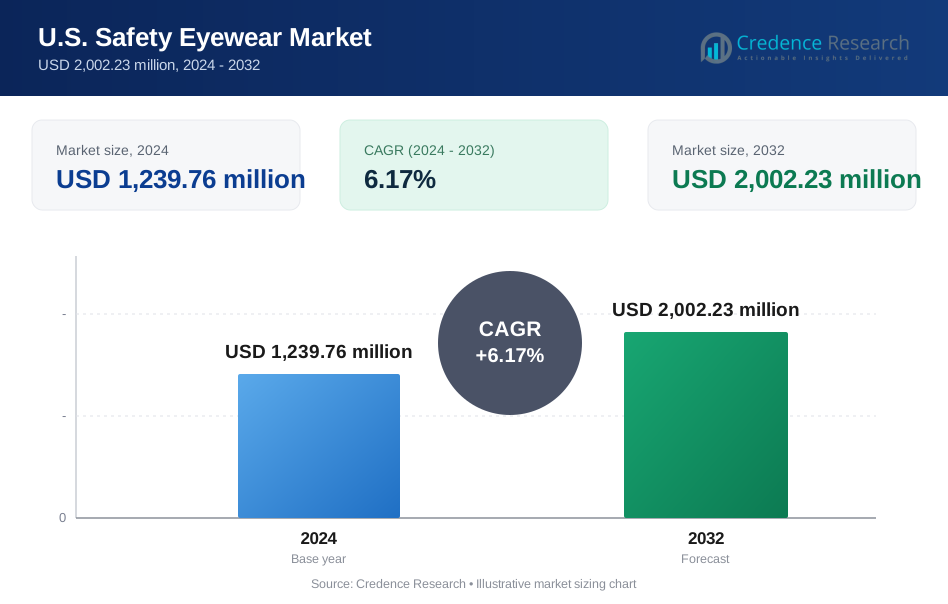
The U.S. Safety Eyewear market size was valued at USD 1,239.76 million in 2024 and is anticipated to reach USD 2,002.23 million by 2032, at a CAGR of 6.17% during the forecast period (2024-2032).
The U.S. Safety Eyewear market benefits from stringent OSHA and ANSI Z87.1 regulations that compel employers to equip workers with certified eye protection. It capitalizes on rising awareness of occupational hazards and growing corporate investment in employee well-being. It leverages advances in lens technologies anti-fog, anti-scratch and UV-protective coatings—to deliver clarity and durability under harsh conditions. It embraces ergonomic frame designs with lightweight materials and customizable fits that improve comfort during extended wear. It integrates smart features like heads-up displays, sensor-based hazard alerts and augmented reality overlays to support Industry 4.0 applications in manufacturing, construction and oil & gas operations. It adopts sustainable materials and reusable designs that align with corporate environmental goals and appeal to eco-conscious buyers. It harnesses digital sales channels and B2B e-procurement platforms to streamline sourcing and broaden market reach, driving steady growth and innovation.
The U.S. Safety Eyewear Market spans diverse regional hubs, with heavy-industry demand driving procurement in Texas and Louisiana, technology clusters shaping requirements in California and the Pacific Northwest, automotive and aerospace manufacturing sustaining orders across the Midwest, and pharmaceutical, research and healthcare facilities anchoring growth in the Northeast. It benefits from region-specific risk profiles—UV exposure in the Southwest, chemical handling in Gulf Coast refineries, precision requirements in cleanroom environments—and aligns product offerings accordingly. Key players such as Kimberly-Clark Corp., MCR Safety, Honeywell International Inc., 3M and Radians Inc. compete on advanced lens technologies, ergonomic frame designs and smart-eyewear integrations. These manufacturers leverage national distribution networks and B2B e-procurement platforms to optimize inventory management and accelerate fulfillment for large enterprises, small contractors and individual end users. Collaborative partnerships with regional safety trainers and digital fitting services further enhance adoption and ensure solutions meet evolving industry standards.
Market Insights
- The U.S. Safety Eyewear market size was valued at USD 1,239.76 million in 2024 and is anticipated to reach USD 2,002.23 million by 2032, at a CAGR of 6.17%.
- The Global Safety Eyewear Market was valued at USD 4,244.64 million in 2024 and is projected to reach USD 6,806.27 million by 2032, growing at a CAGR of 6.08% during the forecast period.
- Employers enforce OSHA and ANSI Z87.1 standards to mitigate eye injury risk, requiring certified eyewear across construction, manufacturing and healthcare. Corporate safety initiatives prioritize protective gear procurement to reduce incident rates, driving stable demand for high-performance, impact-resistant eyewear solutions.
- Manufacturers develop ergonomic frame designs featuring adjustable nose bridges and lightweight materials to enhance comfort during extended wear. They adopt anti-fog, anti-scratch and UV-protective lens coatings that maintain optical clarity in harsh environments, boosting user compliance and productivity on the job.
- Smart eyewear with heads-up displays and real-time hazard sensors gains traction in manufacturing and oil & gas sites. IoT connectivity enables centralized risk monitoring and data-driven maintenance alerts, reducing downtime and reinforcing on-site safety compliance.
- Key players including Kimberly-Clark, MCR Safety, Honeywell, 3M and Radians compete on robust R&D investments, extensive distribution partnerships and digital sales platforms. They differentiate products through prescription insert options, modular frame systems and value-added services like virtual fitting and safety training bundles.
- High unit costs for advanced protective eyewear, particularly prescription and smart-feature models, limit adoption among small enterprises and independent contractors. Budget-conscious buyers often select basic models that provide minimal compliance, which leaves performance gaps in risk-intensive environments.
- Western and Midwestern hubs drive balanced demand through construction, aerospace and renewable energy projects, while the Southern region leads heavy-industry procurement in petrochemical and offshore sectors. Northeastern states maintain steady orders for pharmaceutical labs, healthcare and high-precision manufacturing applications.
Report Scope
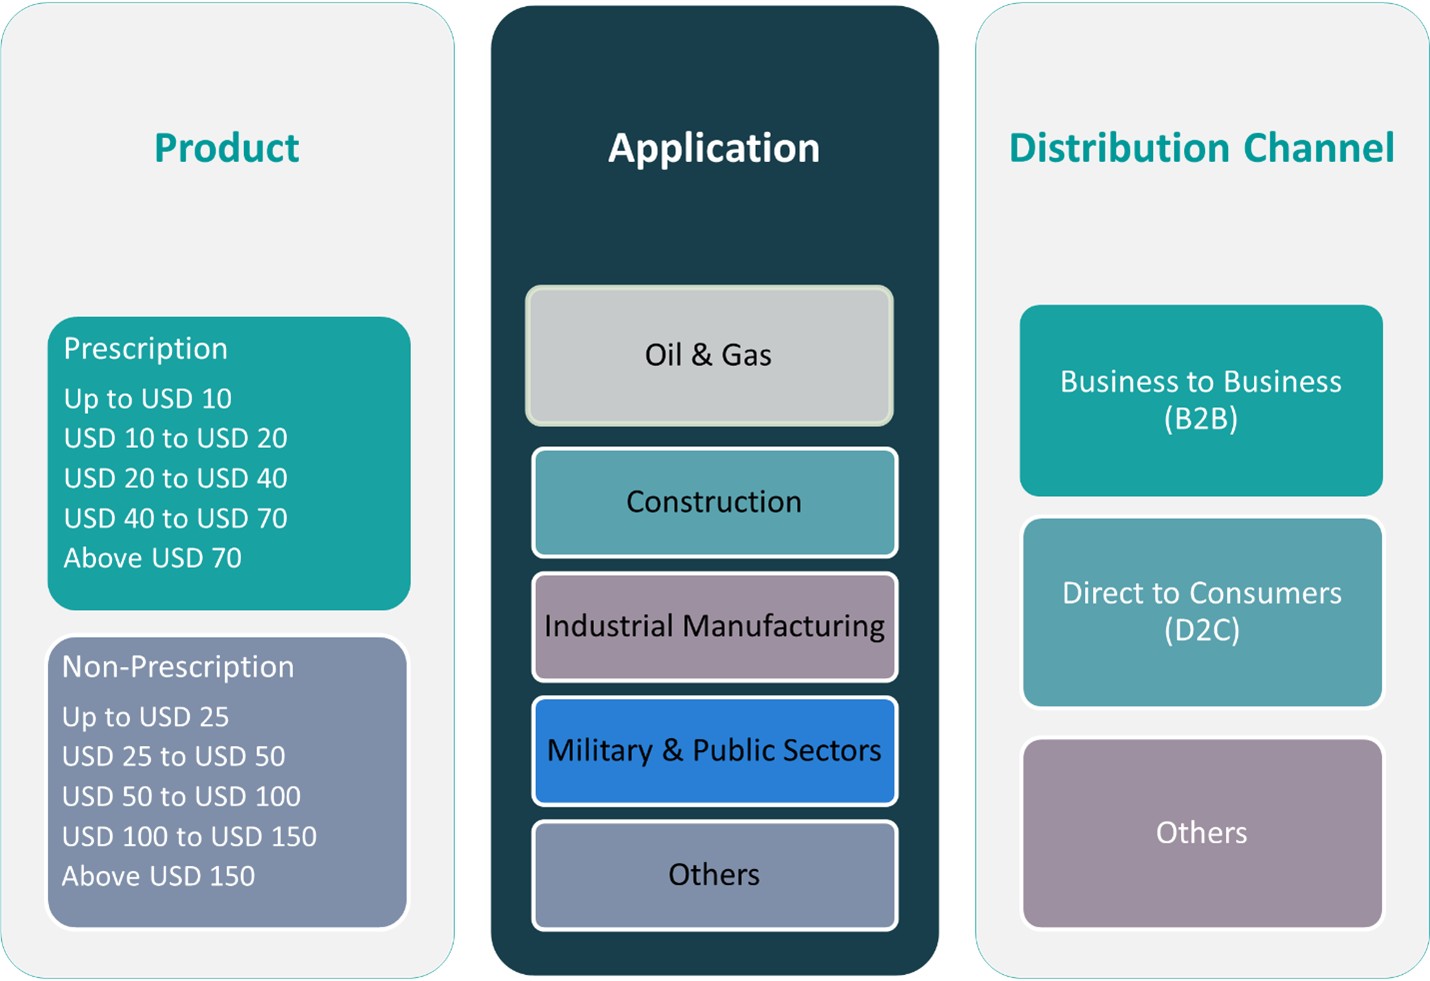
This report segments the U.S. Safety Eyewear Market as follows:
Market Drivers
Strict Regulatory Standards Promote Compliance and Adoption
U.S. Safety Eyewear Market benefits from strict regulatory standards that enforce eye protection in high-risk industries. OSHA mandates and ANSI Z87.1 certifications form the compliance baseline in construction, manufacturing and healthcare. It compels employers to equip personnel with protective eyewear and face penalties for noncompliance. Heightened enforcement and inspection frequency reinforce protective equipment procurement. Regulators update standards to address emerging hazards from chemical exposure and impact risks. Companies conduct periodic safety audits to ensure eyewear standards remain met. It drives steady demand for certified and tested eyewear solutions.
- For instance, OSHA mandates require employers to provide certified safety eyewear to workers in hazardous environments, ensuring compliance with workplace safety standards.
Cutting-Edge Lens Technologies Deliver Enhanced Durability and Clarity
U.S. Safety Eyewear Market capitalizes on cutting-edge lens technologies that deliver enhanced durability and optical clarity. Innovative coatings resist fog, scratches and chemical corrosion under harsh environments. It extends product lifespan and reduces replacement costs. UV-protective layers shield eyes during outdoor and high-intensity light tasks. Manufacturers integrate impact-resistant polymers to meet safety thresholds in extreme conditions. It enables clear vision that supports worker productivity and reduces fatigue. Continuous research in material science sustains performance improvements.
- For instance, polycarbonate and Trivex lenses offer superior impact resistance while remaining lightweight.
Ergonomic Design and Custom Fit Strategies Improve Worker Comfort
U.S. Safety Eyewear Market emphasizes ergonomic design and custom fit strategies to improve worker comfort. Adjustable nose bridges and temple arms deliver personalized support for diverse facial profiles. It uses lightweight materials such as nylon and titanium alloys to minimize pressure and heat buildup. Companies adopt modular frame systems that allow quick lens swaps for different tasks. It reduces wearer fatigue and enhances safety compliance during long work shifts. Manufacturers implement soft-touch finishes that prevent slippage and irritation. It underpins higher adoption rates in sectors with extended equipment usage.
Digital Sales Channels and Sustainability Initiatives Expand Market Reach
U.S. Safety Eyewear Market leverages digital sales channels and sustainability initiatives to expand market reach. E-commerce platforms and B2B procurement systems streamline sourcing for small and mid-size businesses. It integrates virtual fitting tools that assist buyers in selecting optimal products remotely. Brands adopt recycled plastics and bio-based materials to meet corporate environmental goals. It introduces reusable and replaceable components that reduce waste and lifecycle costs. Sustainability efforts strengthen brand loyalty among eco-conscious clients. It drives growth by aligning product innovation with emerging corporate responsibility trends.
Market Trends
E-Commerce Growth Streamlines Procurement and Distribution
The U.S. Safety Eyewear Market relies on e-commerce platforms that simplify ordering and delivery processes. It integrates with enterprise resource planning systems to automate repeat orders and track inventory levels. Direct-to-consumer websites extend reach to small businesses and independent contractors. Fast shipping options and transparent order tracking increase customer satisfaction. Data analytics from online sales help manufacturers forecast demand and optimize production schedules. It accelerates adoption among regional distributors and end users who value convenience.
- For instance, e-commerce & direct-to-consumer (DTC) platforms account for 50% of the safety eyewear market, driven by the convenience of online shopping and bulk purchasing.
Demand for Personalized and Ergonomic Designs Increases Worker Compliance
The U.S. Safety Eyewear Market responds to custom-fit requirements with adjustable nose bridges and temple lengths. It offers modular frame components that workers tailor for improved comfort and stability. Prescription insert options support vision correction needs on industrial sites. Color-coded frames help safety managers enforce uniform compliance across employee groups. Virtual fitting tools use facial mapping technology to recommend optimal frame styles. It reduces return rates and ensures consistent protection across diverse workforces.
- For instance, eyewear brands are increasingly offering integrated prescription lenses, enhanced visual clarity, and lightweight materials to promote continuous wear without discomfort.
Smart Sensor and Augmented Reality Integration Enhances On-Site Safety
The U.S. Safety Eyewear Market integrates heads-up displays to deliver real-time hazard alerts and work instructions. Manufacturers partner with tech firms to integrate IoT capabilities into protective eyewear. AR overlays guide maintenance personnel through complex repair tasks without consulting printed manuals. Embedded gas sensors trigger visual warnings when airborne contaminants exceed safe thresholds. Bluetooth connectivity links eyewear with mobile apps for centralized site monitoring. Battery life improvements support extended shifts without compromising safety features. It strengthens risk mitigation efforts in high-hazard environments.
Sustainable Materials and Circular Economy Practices Gain Corporate Support
The U.S. Safety Eyewear Market adopts recycled plastics and biodegradable polymers to reduce environmental impact. It employs reusable lens cartridges that lower waste and replacement costs over the product lifecycle. Take-back programs encourage end-of-life collection and material recovery. Corporate buyers set sustainability criteria in vendor contracts to meet ESG goals. Certifications from recognized eco-labels validate green manufacturing practices. It builds brand loyalty among environmentally conscious clients. Partnerships with recycling firms ensure closed-loop supply chains.
Market Challenges Analysis
High Product Costs and Budget Constraints Strain Adoption
The U.S. Safety Eyewear Market faces high costs for advanced protective eyewear. It challenges small and mid-sized enterprises that manage tight operational budgets. Employers balance performance benefits against purchase price when they evaluate safety gear. Prescription inserts and smart features drive up expense and complicate procurement. Bulk purchasing agreements provide discounts but impose volume commitments that some buyers avoid. Retail markups in specialized channels reduce accessibility for independent contractors. It forces some organizations to choose basic models that may not address evolving risk profiles.
- For instance, procurement teams in small and mid-sized enterprises across North America allocate limited funds across multiple safety needs, delaying purchase approvals and reducing order volumes.
Regulatory Complexity and Standardization Gaps Challenge Manufacturers
The U.S. Safety Eyewear Market confronts complex regulatory requirements at federal and state levels. It must comply with ANSI Z87.1 updates while it addresses industry-specific mandates in construction, healthcare and oil and gas. Manufacturers invest in rigorous test and certification processes to meet these updated standards. Variations in test protocols between labs slow product launches and raise development costs. End users may follow outdated guidelines and expose employers to compliance gaps. Certification bodies demand documentation that extends approval timelines. It complicates market entry for new brands and limits product diversity.
Market Opportunities
Integration with Wearable Tech and Smart Manufacturing
The U.S. Safety Eyewear Market can diversify product portfolios through integration with wearable sensor and AR platforms. It can offer real-time hazard alerts and equipment status overlays via smart lenses. It can connect to IoT networks for remote monitoring and incident analytics. It can reduce downtime by alerting maintenance crews to emerging equipment faults. It can partner with industrial automation providers to embed safety features into digital workflows. It can justify premium pricing with enhanced productivity benefits. It can support data-driven safety strategies that boost employer ROI.
Penetration into New Industrial and Consumer Segments
The U.S. Safety Eyewear Market can expand reach into emerging industries such as renewable energy and autonomous vehicle manufacturing. It can adapt designs to suit laboratory and cleanroom environments in pharmaceutical and semiconductor sectors. It can introduce casual safety eyewear lines for DIY and home renovation enthusiasts. It can leverage direct-to-consumer channels to capture retail demand among hobbyists. It can collaborate with safety training firms to bundle products with compliance courses. It can establish subscription services that replace lenses and frames periodically. It can drive adoption by demonstrating cost savings from injury prevention and extended equipment life.
Market Segmentation Analysis:
By Product:
The U.S. Safety Eyewear market categorizes products by prescription and non-prescription offerings. Prescription segment divides by price tiers: up to USD 10; USD 10 to USD 20; USD 20 to USD 40; USD 40 to USD 70; above USD 70. It serves basic protection needs through mid-range optical solutions and premium corrective lenses. Non-prescription segment organizes by tiers: up to USD 25; USD 25 to USD 50; USD 50 to USD 100; USD 100 to USD 150; above USD 150. It addresses variation in budget and performance requirements across diverse end users.
By Application: The U.S. Safety Eyewear market further segments by application into oil & gas, construction, industrial manufacturing, military & public sectors, and others. It aligns product designs and compliance standards with each industry’s risk profile.
By Distribution Channel:
Distribution channels include business-to-business, direct-to-consumer and others. It relies on B2B partnerships to supply large enterprises and safety distributors. It leverages D2C platforms to reach individual workers and small contractors. It adapts channel strategies to capture diverse customer segments.
Segments:
Based on Product:
- Prescription
- Up to USD 10
- USD 10 to USD 20
- USD 20 to USD 40
- USD 40 to USD 70
- Above USD 70
- Non-Prescription
- Up to USD 25
- USD 25 to USD 50
- USD 50 to USD 100
- USD 100 to USD 150
- Above USD 150
Based on Application:
- Oil & Gas
- Construction
- Industrial Manufacturing
- Military & Public Sectors
- Others
Based on Distribution Channel:
- Business to Business (B2B)
- Direct to Consumers (D2C)
- Others
Based on the Geography:
- Western United States
- Midwestern United States
- Southern United States
- Northeastern United States
Regional Analysis
Western and Midwestern United States The U.S. Safety Eyewear Market reflects strong demand in the Western and Midwestern United States due to robust construction, oil & gas, and renewable energy activities. It benefits from high manufacturing output in California and aerospace facilities across the Pacific Northwest. Energy-sector expansion in states such as Oklahoma and Kansas sustains procurement of impact-resistant and UV-protective eyeglasses. Tech firms in urban centers promote ergonomic designs for extended-shift comfort and integrate heads-up display prototypes. Regional distributors leverage e-commerce platforms to maintain optimal stock levels and fulfill bulk orders efficiently. Price competition among local suppliers accelerates adoption of lightweight frame materials across industrial sites. The Western region accounts for approximately 28% of the national market, while the Midwestern region contributes around 24%.
Southern United States
The U.S. Safety Eyewear Market in the Southern United States capitalizes on heavy industrial and construction growth across Texas, Florida and the Gulf Coast. It secures strong orders from petrochemical refineries in Louisiana and offshore drilling operations. Large-scale manufacturing hubs in Alabama and Tennessee drive demand for anti-fog and scratch-resistant lenses. Extensive infrastructure projects spur corporate procurement of ergonomic protective eyewear for long-duration outdoor work. Regional safety regulations emphasize compliance with ANSI Z87.1 standards and propel investments in certified products. E-procurement platforms enable manufacturers to track usage and simplify reorder processes for mid-sized contractors. The Southern region holds roughly 31% of the total U.S. market share.
Northeastern United States The U.S. Safety Eyewear Market in the Northeastern United States exhibits stable growth driven by pharmaceutical, healthcare and laboratory sectors. It supports strict compliance protocols in hospitals and cleanrooms throughout the Boston–New York corridor. Academic institutions and research centers in Pennsylvania and Massachusetts purchase high-precision protective lenses for laboratory applications. Urban construction projects in metropolitan areas demand ergonomic frames that combine style with compliance for worker uptake. Small-batch manufacturers leverage local distribution networks to customize orders and deliver punctually. Industry alliances host safety expos that showcase smart eyewear and AR-enhanced models tailored to specialized tasks. The Northeastern region comprises approximately 17% of the national market share.
Key Player Analysis
- Kimberly-Clark Corp.
- MCR Safety
- Honeywell International, Inc.
- 3M
- Radians, Inc.
Competitive Analysis
The U.S. safety eyewear market features several leading players that drive innovation and competition. Key companies such as 3M Company, Honeywell International Inc., Uvex Safety Group, MSA Safety Incorporated, Bollé Safety, and DEWALT dominate the landscape. These players compete by focusing on product quality, technological advancements, and extensive distribution networks. These companies emphasize ergonomic designs and incorporate cutting-edge materials to improve impact resistance and user comfort. Many focus on combining functionality with aesthetics, catering to both industrial and commercial customers. Strategic marketing efforts and partnerships with safety organizations help strengthen their market presence and brand recognition. Additionally, the adoption of smart eyewear technologies and customizable options plays a critical role in differentiating products from competitors. Market players continuously adapt to evolving regulations and shifting end-user demands, ensuring they deliver innovative solutions. This dynamic competition fosters ongoing growth and drives the development of safer, more efficient eyewear products tailored to a wide range of industries.
Recent Developments
- In April 2024, Popticals, a premium eyewear brand, launched the POPZULU Ops Edition, a line of ballistic glasses and safety eyewear. POPZULU is designed for tactical and industrial environments, offering full-scale defense with lenses engineered to shield and a frame that can collapse into a pocket-sized hard-shell case. The POPZULU sunglasses feature an innovative frame design and patented FL2 Micro-Rail System technology for collapsibility. They are crafted using high-quality materials like Hydrophobic Ri-Pel coating, Grilamid TR90 for lightweight and durability, and Impacto lenses from Carl Zeiss Vision that are 5X more resistant to hits and stresses than polycarbonate.
- In April 2024, Innovative Eyewear, Inc. announced filing two new U.S. patent applications related to its new Lucyd Armor smart safety glasses product, which is planned for introduction in mid-2024. The utility patent application covers the product's functional aspects, while the design patent application covers its ornamental design.
- In March 2024, Protective Industrial Products (PIP), a leader in personal protective equipment, acquired Scope Optics Pty Ltd., a safety eyewear company based in Australia. By incorporating Scope Optics' safety eyewear into its existing portfolio of eye protection brands, PIP is adding a wider selection of premium designs, advanced lens technologies, and exceptional value to serve its customers better. The acquisition of Scope Optics is another example of PIP's proven acquisition strategy to strengthen its portfolio of head-to-toe PPE solutions.
Market Concentration & Characteristics
Top-tier manufacturers represent a consolidated landscape, with the five largest firms capturing roughly 45% of total revenue. The U.S. Safety Eyewear Market features moderate concentration, where Kimberly-Clark, MCR Safety, Honeywell, 3M and Radians exert pricing authority and set quality benchmarks. It balances concentrated leadership with numerous niche providers that specialize in prescription inserts, smart features and sustainable materials. Certification requirements and rigorous testing protocols raise entry barriers and favor established players. It relies on multi-channel distribution networks industrial distributors, direct-to-consumer platforms and e-procurement systems to serve diverse end users. Price differentiation spans basic protective models to advanced, sensor-enabled eyewear. It underscores a stable yet dynamic industry characterized by technological innovation, regulatory compliance and evolving user preferences.
Report Coverage
The research report offers an in-depth analysis based on Product, Application, Distribution Channel and Geography. It details leading market players, providing an overview of their business, product offerings, investments, revenue streams, and key applications. Additionally, the report includes insights into the competitive environment, SWOT analysis, current market trends, as well as the primary drivers and constraints. Furthermore, it discusses various factors that have driven market expansion in recent years. The report also explores market dynamics, regulatory scenarios, and technological advancements that are shaping the industry. It assesses the impact of external factors and global economic changes on market growth. Lastly, it provides strategic recommendations for new entrants and established companies to navigate the complexities of the market.
Future Outlook
- The U.S. safety eyewear market will expand due to stricter workplace safety regulations.
- Increasing awareness about eye protection will drive higher adoption among workers.
- Technological advancements will lead to more innovative and comfortable eyewear designs.
- Growth in construction, manufacturing, and healthcare sectors will boost demand.
- Smart safety eyewear with augmented reality features will gain market traction.
- Companies will invest more in developing lightweight and impact-resistant materials.
- Rising focus on employee health and safety programs will encourage safety eyewear use.
- Online sales channels will improve product accessibility and customer reach.
- Collaboration between manufacturers and regulatory bodies will enhance product standards.
- Continuous innovation will meet evolving end-user needs and regulatory requirements.
Request a Free Sample
Fill in your details and we'll send you a free sample report.
- Sample data tables & charts
- Research methodology
Need a Custom Version of This Report?
Tailor the scope, geography, or segments to your exact requirements.
- Custom geography or segment scope
- Direct access to our analyst team
Frequently Asked Questions
What is the current size of the U.S. Safety Eyewear market?
What factors are driving the growth of the U.S. Safety Eyewear market?
What are some challenges faced by the U.S. Safety Eyewear market?
Who are the major players in the U.S. Safety Eyewear market?
Table of Content
Chapter 1. Report Introduction
- 1.1 Report Description & Purpose
- 1.1.1 Report Title & Market Definition
- 1.1.2 Unique Selling Propositions (USP) & Key Differentiators
- 1.1.3 Value Proposition for Stakeholders
- 1.2 Research Objectives
- 1.2.1 Market Sizing Objectives (Volume & Revenue)
- 1.2.2 Segmentation Objectives
- 1.2.3 Competitive Intelligence Objectives
- 1.2.4 Forecast & Scenario Objectives
- 1.3 Report Scope
- 1.3.1 U.S. Safety Eyewear Scope – Types & Subtypes Covered
- 1.3.2 Geographic Scope – Regions & Countries Covered
- 1.3.3 Historical Period, Base Year & Forecast Period (2024; forecast to 2032)
- 1.3.4 Inclusions & Exclusions
- 1.4 HS Code & Classification Framework
- 1.5 Currency, Units & Pricing Basis
- 1.6 Target Stakeholders
- 1.7 Limitations & Assumptions
Chapter 2. Executive Summary
- 2.1 Global U.S. Safety Eyewear Market Snapshot
- 2.1.1 Market Size – Historical (2024) & Forecast (2024-2032) (2024: USD 1,239.76 million → 2032: USD 2,002.23 million)
- 2.1.2 Volume & Revenue – Global Totals
- 2.1.3 Key Market Highlights – Top Five Facts
- 2.2 U.S. Safety Eyewear Market Segmentation Snapshot
- 2.2.1 Market Split by Region – 2024 vs. 2032
- 2.3 Competitive Snapshot
- 2.3.1 Top 10 Players by Revenue Share – 2024
- 2.3.2 Top 10 Players by Volume Share – 2024
- 2.3.3 Recent Strategic Developments (18-Month Summary)
- 2.4 Key Investment Highlights & Strategic Conclusions
Chapter 3. U.S. Safety Eyewear Market Dynamics & Industry Analysis
- 3.1 Market Overview & Context
- 3.1.1 U.S. Safety Eyewear Market Position in the Broader Automotive Value Chain
- 3.1.2 OEM vs. Replacement Market Dynamics
- 3.1.3 Market Maturity & Development Stage by Region
- 3.2 U.S. Safety Eyewear Market Drivers
- 3.3 U.S. Safety Eyewear Market Restraints & Challenges
- 3.4 U.S. Safety Eyewear Market Opportunities
- 3.5 Porter's Five Forces Analysis
- 3.5.1 Threat of New Entrants
- 3.5.2 Bargaining Power of Suppliers
- 3.5.3 Bargaining Power of Buyers
- 3.5.4 Threat of Substitutes
- 3.5.5 Competitive Rivalry – Intensity Assessment
- 3.6 U.S. Safety Eyewear Value Chain Analysis
- 3.6.1 Upstream – Raw Material/Input Suppliers
- 3.6.1.1 Raw Material/Input 1
- 3.6.1.2 Raw Material/Input 2
- 3.6.1.3 Raw Material/Input 3
- 3.6.2 Midstream – Production/Manufacturing/Service Delivery
- 3.6.2.1 Production/Process Overview
- 3.6.2.2 Key Facility Locations & Capacity by Manufacturer
- 3.6.3 Downstream – Distribution & End Consumer
- 3.6.3.1 Primary Channel – B2B/OEM
- 3.6.3.2 Secondary Channels – Dealer, Retail, Online, Direct
- 3.6.4 Value Chain Profitability Analysis
- 3.6.1 Upstream – Raw Material/Input Suppliers
- 3.7 PESTEL Analysis
- 3.7.1 Political Factors
- 3.7.2 Economic Factors
- 3.7.3 Social Factors
- 3.7.4 Technological Factors
- 3.7.5 Environmental Factors
- 3.7.6 Legal Factors
- 3.8 U.S. Safety Eyewear Supply Chain Analysis
- 3.8.1 Raw Material/Input Supply Risk Assessment
- 3.8.2 Manufacturing Concentration Risk (Geographic Exposure)
- 3.8.3 Trade Disruption Impact Analysis
- 3.9 Regulatory & Policy Landscape
Note: The regulatory and policy landscape section covers regulations based on their applicability to the market, U.S. Safety Eyewear category, geography, and scope of the study. Only regulatory frameworks with a material impact on operations, compliance, trade, sustainability, or market access are analyzed in detail.
Chapter 4. Key Investment Pockets & Opportunity Analysis
- 4.1 U.S. Safety Eyewear Market Attractiveness Analysis
- 4.1.1 By Region – Investment Attractiveness Matrix (Volume × CAGR)
- 4.2 Absolute Revenue Growth Opportunity
- 4.2.1 By Region – Absolute USD Growth Through 2032
- 4.3 Incremental Volume Opportunity
- 4.3.1 By Region – Incremental Volume Through 2032
- 4.3.2 Segment – Incremental Volume
- 4.4 Emerging Submarket Opportunity Deep Dive (Subject to Applicability)
- 4.5 Emerging Market Opportunity Scorecards
- 4.5.1 United States
- 4.5.2 Europe
- 4.5.3 Asia
- 4.5.4 Middle East & Africa
Note: Emerging Market Opportunity Scorecards will be included based on relevance and strategic importance. Regions listed are indicative and may vary depending on data availability and market dynamics.
Chapter 5. U.S. Safety Eyewear Import-Export Analysis & Trade Flows
- 5.1 Global Trade Overview
- 5.1.1 Global Export Value by Country (2024)
- 5.1.2 Global Export Volume by Country (2024)
- 5.1.3 Global Import Value by Country (2024)
- 5.1.4 Global Import Volume by Country (2024)
- 5.1.5 Net Trade Balance by Country (2024)
- 5.2 Export Analysis – Segment
- 5.2.1 Type 1 (HS Code)
- 5.2.2 Type 2 (HS Code)
- 5.2.3 Type 3 (HS Code)
- 5.2.4 Type 4 (HS Code)
- 5.2.5 Type 5 (HS Code)
- 5.3 Import Analysis – Segment
- 5.3.1 Type 1 (HS Code)
- 5.3.2 Type 2 (HS Code)
- 5.3.3 Type 3 (HS Code)
- 5.3.4 Type 4 (HS Code)
- 5.3.5 Type 5 (HS Code)
- 5.4 Average Unit Trade Prices
- 5.4.1 Average Export Price – Segment & Country
- 5.4.2 Average Import Price – Segment & Source Country
- 5.4.3 Price Trends (2024)
- 5.5 Key Trade Route Analysis
- 5.5.1 Trade Route 1
- 5.5.2 Trade Route 2
- 5.5.3 Trade Route 3
- 5.5.4 Trade Route 4
- 5.5.5 Trade Route 5
- 5.6 Trade Policy Impact Assessment
- 5.6.1 US Anti-Dumping & Section 301 Tariffs
- 5.6.2 EU Customs Union Impact
- 5.6.3 Major Free Trade Agreements
- 5.6.4 USMCA Rules of Origin
Note: Trade policy analysis will be included only where relevant to the U.S. Safety Eyewear market.
Chapter 6. Competitive Landscape & Company Benchmarking
- 6.1 U.S. Safety Eyewear Market Concentration & Structure
- 6.1.1 Herfindahl-Hirschman Index (HHI) – vs. 2024
- 6.1.2 Tier 1, Tier 2 & Tier 3 Market Structure
- 6.1.3 Global, Regional & Local Player Dynamics
- 6.2 U.S. Safety Eyewear Market Share Analysis – 2024
- 6.2.1 Global Revenue Share by Company
- 6.2.2 Global Volume Share by Company
- 6.2.3 Regional Revenue Share
- 6.2.4 Market Share Evolution ( vs. 2024)
- 6.2.5 OEM Segment Share by Company
- 6.2.6 Replacement Segment Share by Company
- 6.3 Production/Delivery Capacity & Facility Analysis
- 6.3.1 Global Installed Capacity
- 6.3.2 Capacity Utilization Rates
- 6.3.3 Production/Output Volume
- 6.3.4 Facility Locations & Capacity Map
- 6.3.5 Planned Capacity Additions
- 6.4 U.S. Safety Eyewear Competitive Benchmarking Matrix
- 6.4.1 Revenue, Volume, CAGR & Profitability Comparison
- 6.4.2 Channel Revenue Mix
- 6.4.3 Geographic Revenue Exposure
- 6.4.4 R&D Intensity
- 6.4.5 Sustainability Maturity
- 6.5 Strategic Developments in U.S. Safety Eyewear (Last 24 Months)
- 6.5.1 Mergers, Acquisitions & Divestments
- 6.5.2 New U.S. Safety Eyewear Launches
- 6.5.3 Facility Expansions
- 6.5.4 Strategic Alliances, Joint Ventures & Partnerships
- 6.5.5 Distribution Expansion & Market Entry
- 6.5.6 Sustainability & ESG Initiatives
- 6.6 Competitive Strategy Mapping
- 6.6.1 Leader, Challenger, Follower & Niche Classification
- 6.6.2 Pricing Strategy Comparison
- 6.6.3 Channel Strategy Matrix
Note: Strategic developments are included based on their materiality and the availability of reliable information.
Chapter 7. Global U.S. Safety Eyewear Market – By Distribution Channel
- 7.1 Segment Overview
- 7.1.1 Volume & Revenue Split by Channel (2024 & 2032)
- 7.1.2 Channel Mix Evolution (2024-2032)
Chapter 8. Regional Market Analysis – Global Overview
- 8.1 Global Regional Overview
- 8.1.1 Regional Volume Share
- 8.1.2 Regional Revenue Share
- 8.1.3 Regional Volume by Region
- 8.1.4 Regional Revenue by Region
- 8.1.5 Regional Forecast Through 2032
- 8.2 Cross-Regional Segment Analysis
- 8.2.1 By Distribution Channel
- 8.2.2 By Brand/Price Tier
Chapter 9. North America U.S. Safety Eyewear Market
- 9.1 United States
- 9.2 Canada
- 9.3 Mexico
Chapter 10. Europe U.S. Safety Eyewear Market
- 10.1 Germany
- 10.2 France
- 10.3 Italy
- 10.4 United Kingdom
- 10.5 Spain
- 10.6 Poland
- 10.7 Russia
- 10.8 Netherlands
- 10.9 Belgium
- 10.10 Sweden
- 10.11 Denmark
- 10.12 Norway
- 10.13 Rest of Europe
Chapter 11. Asia Pacific U.S. Safety Eyewear Market
- 11.1 China
- 11.2 India
- 11.3 Japan
- 11.4 South Korea
- 11.5 Thailand
- 11.6 Indonesia
- 11.7 Vietnam
- 11.8 Malaysia
- 11.9 Australia
- 11.10 Rest of Asia Pacific
Chapter 12. Latin America U.S. Safety Eyewear Market
- 12.1 Brazil
- 12.2 Argentina
- 12.3 Colombia
- 12.4 Chile
- 12.5 Rest of Latin America
Chapter 13. Middle East U.S. Safety Eyewear Market
- 13.1 Saudi Arabia
- 13.2 United Arab Emirates
- 13.3 Turkey
- 13.4 Israel
- 13.5 Iran
- 13.6 Rest of the Middle East
Chapter 14. Africa U.S. Safety Eyewear Market
- 14.1 South Africa
- 14.2 Egypt
- 14.3 Nigeria
- 14.4 Morocco
- 14.5 Rest of Africa
Chapter 15. U.S. Safety Eyewear Company Profiles
- 15.1 [Company 01]
- 15.1.1 Company Overview
- 15.1.2 Key Management Personnel
- 15.1.3 Products & Services Portfolio
- 15.1.4 Financial Performance
- 15.1.5 Key Market Focus & Geographic Presence
- 15.1.6 Recent Developments & Strategic Initiatives
Note: The company profile list is preliminary and may change based on research findings, market developments, data availability, and client requirements.
Chapter 16. Appendices
- Appendix A – List of Abbreviations & Acronyms
- Appendix B – Industry Classification Code Reference – Full Series
- Appendix C – Production & Capacity Data Tables
- Appendix D – End-Use & Demand Base Tables
- Appendix E – Consumption & Replacement Rate Assumptions
- Appendix F – ASP Reference Tables
- Appendix G – Manufacturing & Facility Database
- Appendix H – Import-Export Data Tables
- Appendix I – Regulatory Summary Tables
- Appendix J – Primary Research Participant List (Anonymized)
- Appendix K – Primary Research Questionnaire Framework
- Appendix L – Data Sources & Bibliography
- Appendix M – Market Size Divergence & Source Comparison
Chapter 17. Research Methodology
- 17.1 Research Framework & Philosophy
- 17.2 Secondary Research – Sources, Hierarchy & Data Extraction
- 17.3 Data Modeling – Bottom-Up & Top-Down Market Sizing
- 17.4 Primary Research – Stakeholder Framework, LOI & Sample Sizes
- 17.5 Forecast Methodology – Regression, Scenario & Sensitivity Analysis
- 17.6 Quality Control – Four-Layer Validation Framework
- 17.7 Limitations & Standard Assumptions
- 17.8 Disclaimer
