Market Overview:
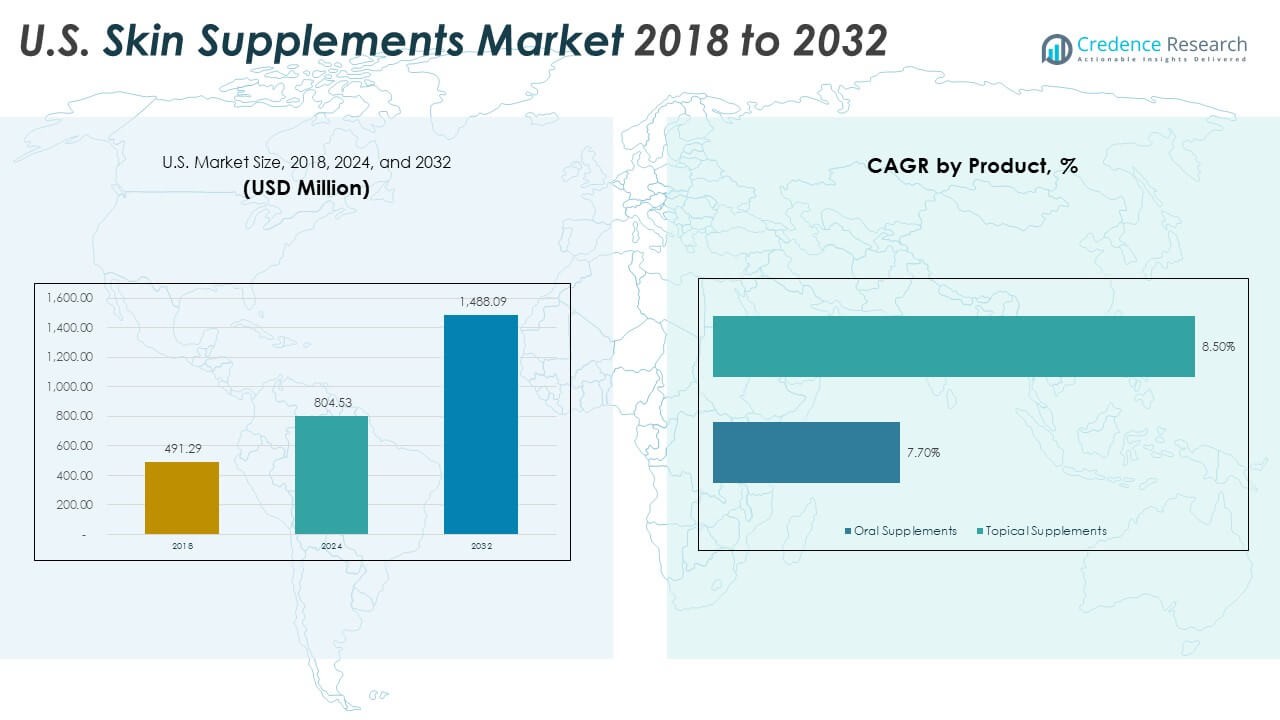
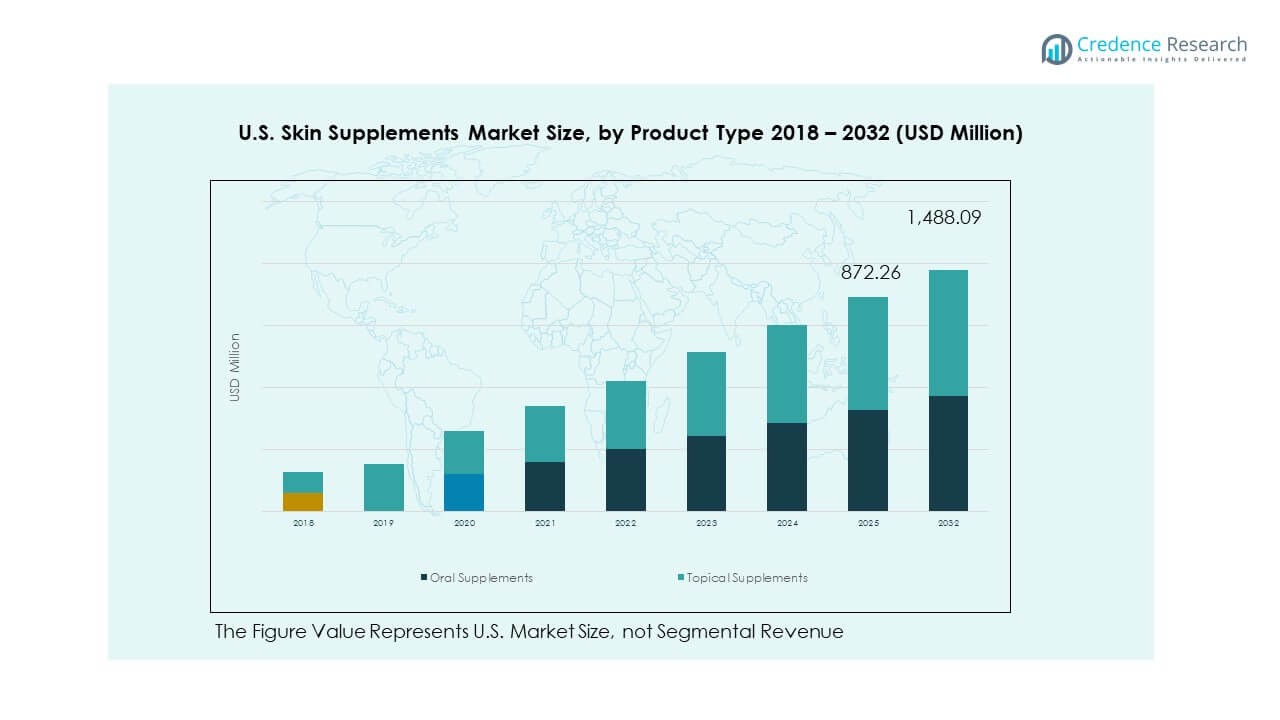
The U.S. Skin Supplements Market size was valued at USD 491.29 million in 2018 to USD 804.53 million in 2024 and is anticipated to reach USD 1,488.09 million by 2032, at a CAGR of 7.99% during the forecast period.
| REPORT ATTRIBUTE |
DETAILS |
| Historical Period |
2020-2023 |
| Base Year |
2024 |
| Forecast Period |
2025-2032 |
| U.S. Skin Supplements Market Size 2024 |
USD 804.53 Million |
| U.S. Skin Supplements Market, CAGR |
7.99% |
| U.S. Skin Supplements Market Size 2032 |
USD 1,488.09 Million |
The market is advancing as consumers increasingly prioritize preventive skincare and nutrition-based solutions. Rising awareness of the link between diet and skin health encourages adoption of collagen, hyaluronic acid, and vitamin-rich supplements. Urban stress, pollution, and changing lifestyles drive demand for products that address aging, hydration, and blemishes. Endorsements by dermatologists and the influence of social media elevate consumer trust and visibility. It expands further as wellness trends integrate into daily skincare routines, fueling consistent growth across diverse demographics.
Regionally, the Northeast leads due to higher consumer awareness, dense urban populations, and strong presence of premium brands. The Midwest shows stable demand supported by retail distribution and affordability-driven choices. The South is gaining ground through expanding e-commerce and adoption among younger consumers. The West emerges as a hub for innovation with strong emphasis on natural, sustainable, and plant-based formulations. It benefits from a culture of wellness and lifestyle-driven purchasing, positioning the region as an incubator for future product development and growth opportunities.
Access crucial information at unmatched prices!
Request your sample report today & start making informed decisions powered by Credence Research Inc.!
Download Sample
Market Insights
- The U.S. Skin Supplements Market was valued at USD 491.29 million in 2018, reached USD 804.53 million in 2024, and is projected to attain USD 1,488.09 million by 2032, recording a CAGR of 7.99%.
- The Northeast held 32% share, driven by strong urban density and higher consumer awareness; the Midwest accounted for 27% with retail penetration supporting steady growth; the South captured 23% through rising adoption and expanding e-commerce.
- The West contributed 18% share and stands as the fastest-growing region, supported by innovation, sustainable demand, and wellness-focused consumer culture.
- Oral supplements represented 41% of the market in 2032, maintaining dominance due to convenience and strong consumer adoption across demographics.
- Topical supplements held 59% share in 2032, reflecting increasing preference for integrated skincare solutions that combine external and internal approaches.

Market Drivers
Rising Focus on Holistic Skin Health and Nutrition Awareness
Consumers are increasingly prioritizing overall wellness through nutrition-driven skincare solutions. Awareness of the link between diet and skin quality encourages adoption of supplements containing collagen, vitamins, and antioxidants. The U.S. Skin Supplements Market benefits from this rising focus on prevention rather than reactive treatment. Social media and influencer-driven campaigns raise consumer interest in nutritional skin support. Dermatologists and wellness experts promote these products as part of a daily care routine. It gains momentum as younger demographics look for long-term skin health. This awareness aligns with lifestyle shifts toward clean beauty and non-invasive care. Rising consumer education strengthens market demand.
- For example, Hum Nutrition’s Skin Squad Pre+Probiotic was tested in a dermatologist-supervised 60-day study, where 88% of participants reported a decrease in non-cystic acne breakouts. The study also highlighted noticeable improvements in digestion and overall skin condition.
Increasing Prevalence of Skin Concerns in Urban Populations
Urban lifestyles expose consumers to pollution, stress, and irregular diets, driving skin-related concerns. Acne, dryness, pigmentation, and early aging signs contribute to growing reliance on supplements. The U.S. Skin Supplements Market sees growth from busy individuals seeking convenient solutions. Supplements address hydration, elasticity, and texture issues through targeted formulations. Rising consumer anxiety over visible skin problems pushes faster product adoption. Clinical studies support ingredient claims, improving consumer trust. It allows manufacturers to position supplements as credible solutions. Urbanization continues to fuel demand for advanced nutraceuticals.
Growing Acceptance of Preventive Care and Anti-Aging Solutions
Preventive healthcare adoption is increasing, particularly for anti-aging and skin rejuvenation. Consumers invest early in collagen boosters and hyaluronic acid to maintain skin vitality. The U.S. Skin Supplements Market gains from the growing acceptance of beauty-from-within approaches. Consumers aged 25–40 adopt preventive measures before visible aging signs appear. Rising disposable incomes allow wider access to premium formulations. It drives companies to develop scientifically backed solutions with proven results. Marketing highlights long-term benefits of consistent usage. Preventive care positions supplements as essential beauty and wellness tools.
Expansion of Product Accessibility Across Multiple Distribution Channels
E-commerce, pharmacies, and specialty stores improve consumer access to skin supplements. Online platforms provide detailed information, reviews, and subscription options, driving convenience. The U.S. Skin Supplements Market strengthens distribution networks to reach diverse demographics. Retail partnerships expand visibility of nutraceutical brands in established outlets. Pharmacies leverage clinical positioning to build consumer trust in formulations. It enables both premium and mass-market products to penetrate efficiently. Improved accessibility encourages impulse buying and sustained adoption. Expanding digital health channels further support consistent product engagement.
- For example, Ritual’s HyaCera™ underwent a 12-week randomized, double-blind, placebo-controlled clinical trial with 63 participants, demonstrating a 356% reduction in crow’s feet wrinkles and a 290% increase in facial skin smoothness compared to placebo.
Market Trends
Innovation in Formulations with Clinically Researched Ingredients
Manufacturers increasingly invest in clinically validated formulations to boost consumer confidence. New product launches feature patented collagen peptides, hyaluronic acid complexes, and botanical blends. The U.S. Skin Supplements Market observes rising focus on bioavailable ingredients for better absorption. Brands highlight scientific validation to differentiate from unregulated competitors. It strengthens credibility in a competitive landscape. Innovation aligns with consumer preference for measurable outcomes. Marketing emphasizes research-backed benefits for elasticity, hydration, and radiance. The trend builds trust across informed consumer groups.
Personalization and Custom Skin Nutrition Programs
Personalized nutrition solutions gain momentum with DNA analysis and lifestyle-based recommendations. Consumers expect products tailored to skin type, age, and specific concerns. The U.S. Skin Supplements Market responds with subscription kits and algorithm-based customization. Technology integrates consumer data to design unique supplement regimes. It enhances engagement by offering targeted results. Personalized solutions improve brand loyalty and repeat purchases. Retailers adopt direct-to-consumer models for deeper customization. This trend redefines consumer expectations for skin nutrition.
- For example, Anake provides DNA-based personalized skincare by analyzing over 15 genetic markers to create detailed skin profiles. Its system integrates DNA analysis, lifestyle assessment, and AI-powered skin consultations to deliver tailored product and supplement recommendations.
Integration of Beauty-from-Within Concept in Mainstream Beauty Industry
The boundary between cosmetics and nutrition continues to narrow. Beauty brands introduce supplements alongside topical skincare products. The U.S. Skin Supplements Market benefits from beauty retailers expanding into ingestible skincare. Consumers increasingly view supplements as part of daily beauty rituals. It establishes supplements as integral to holistic beauty care. Strategic collaborations between skincare companies and nutraceutical firms accelerate innovation. Cross-industry marketing campaigns reinforce the beauty-from-within narrative. This integration drives higher consumer acceptance and market penetration.
- For example, Imaraïs Beauty partnered with The Vitamin Shoppe to launch its vegan, sugar-free wellness gummies Youth, Balance, and Sutra across 480 retail locations. These gummies are PETA-certified, cruelty-free, and positioned under the retailer’s “Beauty from Within” supplement concept.
Sustainability and Ethical Product Development Shaping Consumer Preferences
Eco-conscious consumers demand supplements sourced from sustainable and ethical practices. Brands highlight traceable supply chains, plant-based ingredients, and eco-friendly packaging. The U.S. Skin Supplements Market adapts to meet these evolving preferences. Consumers support companies aligned with environmental and social responsibility. It encourages innovation in biodegradable capsules and recyclable formats. Transparency on sourcing strengthens consumer trust. Ethical branding resonates with younger demographics who value responsible consumption. Sustainability shapes long-term strategies in the market.
Market Challenges Analysis
Regulatory Complexity and Lack of Standardization Across Product Categories
The market faces challenges due to unclear regulation and varying standards for nutraceuticals. Supplements are often marketed with limited oversight, raising concerns about safety and efficacy. The U.S. Skin Supplements Market must address trust issues stemming from unverified claims. Consumers remain cautious without clear FDA guidance. It pressures manufacturers to invest in clinical research for credibility. Regulatory uncertainty slows product approvals and innovation. Lack of harmonization across categories limits cross-border opportunities. Consistency in standards is essential for sustainable growth.
High Competition and Consumer Skepticism Toward Product Efficacy
The market experiences intense competition from global and local brands offering similar formulations. Consumers struggle to differentiate products in a crowded space. The U.S. Skin Supplements Market faces skepticism due to overstated benefits in advertising. It forces brands to validate products with clinical trials and transparent labeling. Price sensitivity challenges premium segment growth. Consumer trust fluctuates based on brand reputation and transparency. Emerging players find it difficult to sustain market presence. Clear communication and proven outcomes are critical to overcoming skepticism.
Market Opportunities
Rising Demand for Science-Backed and Multi-Functional Skin Supplements
Consumers seek multi-functional products targeting hydration, elasticity, and protection simultaneously. The U.S. Skin Supplements Market can leverage innovation to deliver all-in-one solutions. It creates opportunities for brands offering clinically validated, comprehensive products. Demand for multifunctionality allows companies to expand into niche categories. Enhanced formulations with measurable results attract health-conscious consumers. Evolving consumer expectations favor brands with strong research backing. This shift positions supplements as part of long-term wellness strategies. Companies can lead by integrating nutrition, science, and lifestyle.
Growth of Digital Health Platforms and Direct-to-Consumer Models
Online platforms provide opportunities for personalized engagement and global reach. The U.S. Skin Supplements Market benefits from rising digital health adoption. It enables brands to offer subscription-based plans and personalized dashboards. Direct-to-consumer sales enhance control over consumer data. Companies can deliver tailored recommendations with interactive tools. Virtual consultations support deeper consumer trust and engagement. Digital models improve efficiency in reaching younger audiences. Expanding digital ecosystems will drive long-term opportunities in the segment.

Market Segmentation Analysis
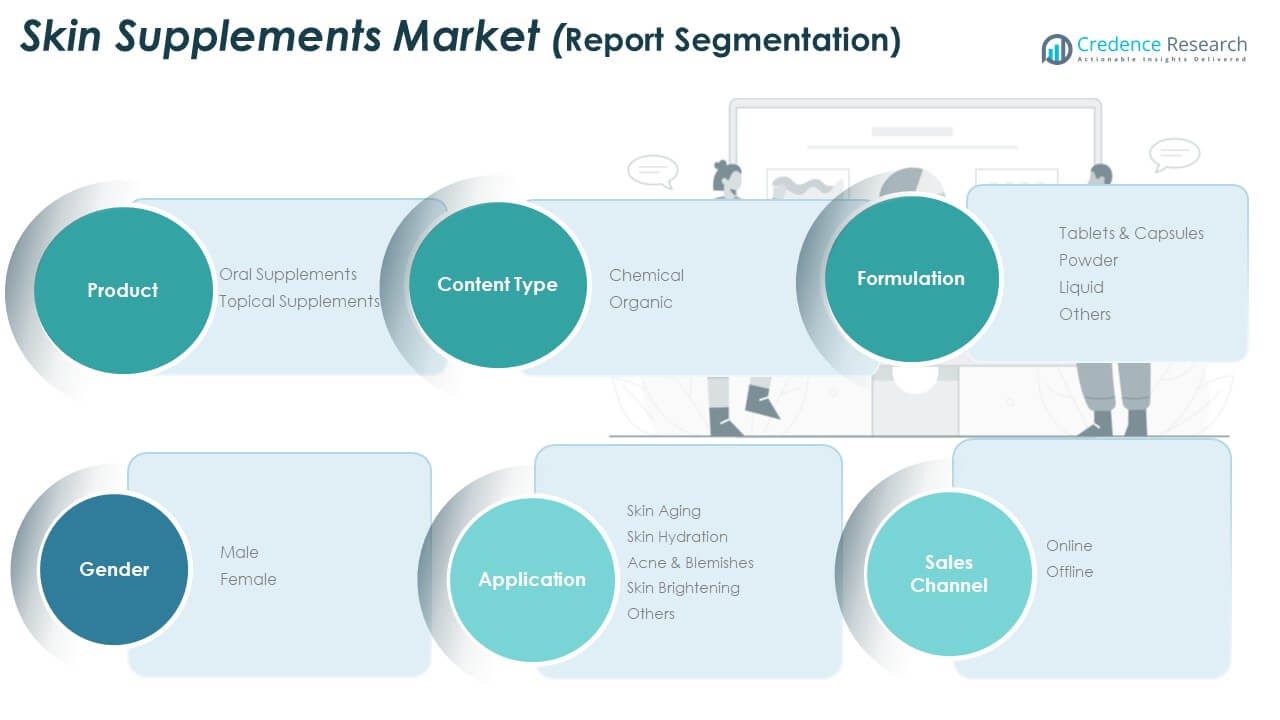
By product
The U.S. Skin Supplements Market is categorized into oral and topical supplements. Oral supplements dominate due to their ease of use and integration into daily routines. Topical supplements are steadily expanding as consumers combine external care with ingestible solutions. It strengthens growth as both categories address distinct consumer needs within holistic skincare.
- For example, Neutrogena launched a “Skin Supplements” line in November 2023, including Clear Complexion Antioxidant Gummies with Zinc and Skin Hydration Gummies. The Clear Complexion gummies include vitamins A, C, E, zinc, selenium, and probiotics to support skin and gut health.
By application
The market covers skin aging, hydration, acne and blemishes, skin brightening, and others. Skin aging leads demand with preventive and anti-aging solutions gaining traction among adults. Hydration products attract younger users managing lifestyle-related skin dryness. It also benefits from acne and blemish formulations targeting teenagers and young adults, while brightening products appeal to consumers seeking even skin tone.
By content type
The market divides into chemical and organic. Organic products are expanding quickly, supported by rising preference for natural and clean-label solutions. Chemical-based products remain vital where clinical research and efficacy drive consumer trust. It creates a balance between traditional formulations and emerging plant-based alternatives.
By formulation
Tablets and capsules dominate due to precise dosing and convenience. Powders and liquids serve niche consumers seeking flexibility and faster absorption. It provides opportunities for brands to diversify product portfolios across user preferences.
- For example, Ritual launched HyaCera in May 2023, featuring 120 mg of bio-fermented hyaluronic acid (Hyabest®) and 350 mg of wheat oil extract (Ceratiq®). The supplement uses a capsule-in-capsule delivery system to preserve ingredient stability until ingestion.
By gender
Female consumers remain the primary users, reflecting strong alignment with beauty and wellness routines. Male adoption continues to rise, driven by greater awareness of preventive care. It opens new opportunities for gender-focused product lines.
By sales channel
Online platforms lead growth with widespread accessibility, personalized recommendations, and subscription models. Offline channels, including pharmacies and specialty stores, sustain credibility and in-person consultation. It ensures balanced market penetration across consumer groups.

Segmentation
By Product Segment
- Oral Supplements
- Topical Supplements
By Application Segment
- Skin Aging
- Skin Hydration
- Acne & Blemishes
- Skin Brightening
- Others
By Content Type Segment
By Formulation Segment
- Tablets & Capsules
- Powder
- Liquid
- Others
By Gender Segment
By Sales Channel Segment
Regional Analysis
Northeast Region
The Northeast accounts for 32% of the U.S. Skin Supplements Market, supported by high urban density and strong consumer awareness of wellness solutions. The region has a well-established retail network with specialty stores, pharmacies, and premium outlets promoting skin supplements. Consumers in cities such as New York and Boston display strong preference for organic and clinically tested formulations. It benefits from higher disposable incomes and early adoption of preventive care products. The concentration of dermatology clinics and wellness centers strengthens consumer trust. Regional demand grows consistently with product diversification and effective marketing strategies.
Midwest and South Regions
The Midwest holds 27% of the U.S. Skin Supplements Market, with demand led by growing interest in affordable and mass-market nutraceuticals. The South contributes 23%, driven by rising population and expanding e-commerce penetration. In the Midwest, large retail chains support distribution of supplements across suburban and semi-urban areas. The South experiences strong uptake among younger demographics seeking hydration and acne-focused products. It benefits from rising awareness campaigns and accessible price ranges. Both regions show steady adoption due to expanding online availability and increased health education efforts.
West Region
The West commands 18% of the U.S. Skin Supplements Market, supported by a strong culture of health, beauty, and lifestyle innovation. California leads the region, with wellness-driven consumers demanding premium, sustainable, and plant-based products. The influence of tech-driven e-commerce platforms and subscription models accelerates adoption. It fosters collaboration between supplement brands and cosmetic companies, strengthening cross-category appeal. Regional consumers favor transparency, clinical validation, and eco-conscious packaging. This market environment makes the West an incubator for innovation and future growth.
Shape Your Report to Specific Countries or Regions & Enjoy 30% Off!
Key Player Analysis
- Amway
- GNC Holdings, Inc.
- NeoCell Corporation
- Murad LLC
- HUM Nutrition
- Perricone MD
- The Estée Lauder Companies Inc.
- Nutrafol
- Vital Proteins
- Garden of Life
- Other Key Players
Competitive Analysis
The U.S. Skin Supplements Market is highly competitive, shaped by global leaders and specialized nutraceutical brands. Key companies include Amway, GNC Holdings, HUM Nutrition, Murad LLC, NeoCell, and The Estée Lauder Companies. It features a blend of legacy players with diversified portfolios and niche companies focused on premium or organic segments. Intense competition pushes brands to prioritize clinical research, product differentiation, and sustainable sourcing to win consumer trust. Firms adopt strategies such as new product launches, mergers, acquisitions, and targeted regional expansions to secure market share. Direct-to-consumer models and subscription services are expanding rapidly, supported by strong online engagement. It drives companies to align with digital platforms, influencer marketing, and data-driven personalization. Competition remains strong across pricing tiers, with premium players highlighting innovation while mass-market brands focus on accessibility and scale.
Recent Developments
- In August 2025, Pilly Labs debuted its marine collagen gummies in the United States, targeting consumers interested in clean-label, natural beauty supplements for improving skin texture, joint flexibility, and hair vitality, marking an innovative shift toward convenient, non-synthetic formulations in the U.S. skin supplements market.
- In June 2025, Amway expanded its long-standing partnership with South Korea-based HEM Pharma to deepen research and innovation in gut health and microbiome solutions. This extended collaboration is particularly focused on expanding microbiome-based technologies into markets like the United States, directly benefiting Amway’s nutrition and skin health product portfolios.
- In May 2025, e.l.f. Beauty announced a significant acquisition involving Hailey Bieber’s skincare and makeup brand, Rhode, in a deal valued at up to $1 billion, solidifying one of the largest recent transactions in the celebrity beauty sector.
Report Coverage
The research report offers an in-depth analysis based on Product Segment, Application Segment, Content Type Segment, Formulation Segment, Gender Segment and Sales Channel Segment. It details leading market players, providing an overview of their business, product offerings, investments, revenue streams, and key applications. Additionally, the report includes insights into the competitive environment, SWOT analysis, current market trends, as well as the primary drivers and constraints. Furthermore, it discusses various factors that have driven market expansion in recent years. The report also explores market dynamics, regulatory scenarios, and technological advancements that are shaping the industry. It assesses the impact of external factors and global economic changes on market growth. Lastly, it provides strategic recommendations for new entrants and established companies to navigate the complexities of the market.
Future Outlook
- The U.S. Skin Supplements Market will expand as consumers adopt beauty-from-within solutions across diverse age groups.
- Rising demand for clinically validated ingredients will push companies to strengthen R&D investments and product transparency.
- Growth in subscription-based models and direct-to-consumer channels will enhance brand-consumer relationships.
- Partnerships between cosmetic brands and nutraceutical firms will create innovative product combinations targeting multiple skin concerns.
- Increasing popularity of personalized supplements will drive the integration of digital platforms and AI-driven customization.
- Strong focus on sustainability and eco-friendly packaging will shape product positioning and consumer trust.
- E-commerce expansion will increase penetration into underserved areas, providing opportunities for mass-market growth.
- Younger demographics will prioritize preventive care, fueling steady demand for anti-aging and hydration-focused formulations.
- Regulatory developments will influence innovation cycles, encouraging compliance-focused product launches with higher credibility.
- The U.S. Skin Supplements Market will remain competitive, with niche brands challenging global players through targeted innovation.


