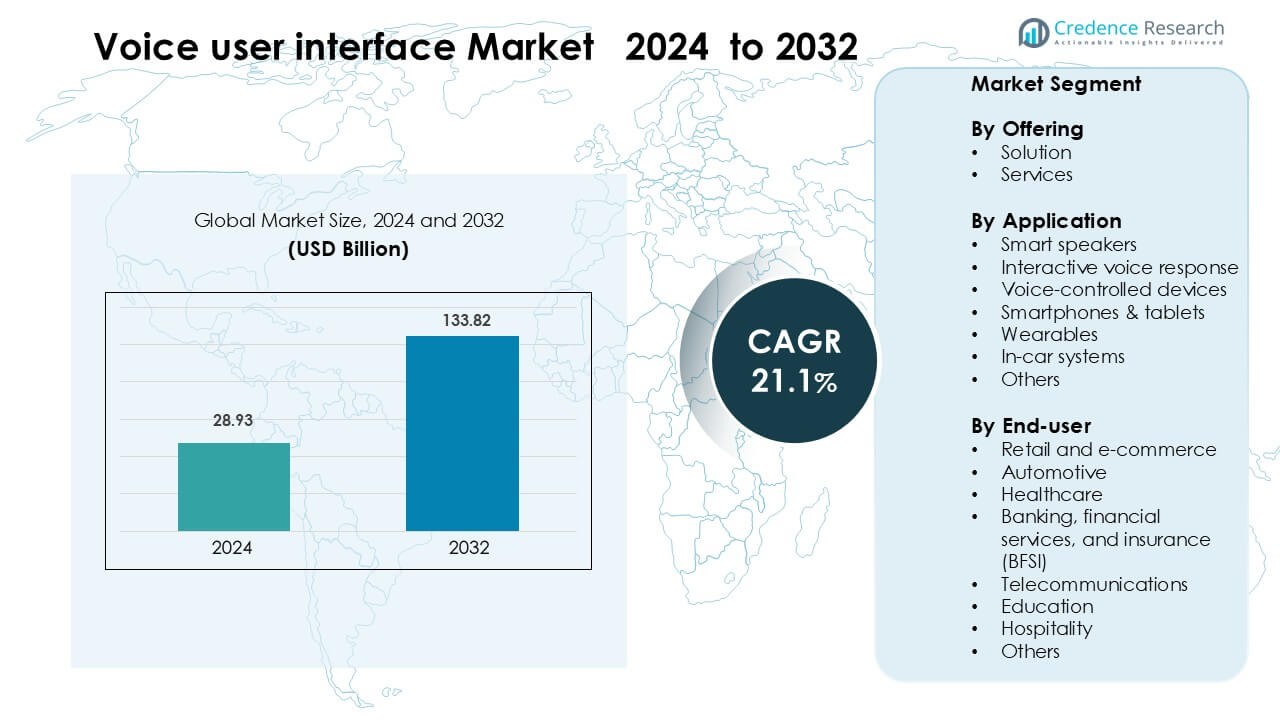
Global Voice User Interface Market By Offering (Solution and Service), By Application (Smart Speakers, Interactive Voice Response, On-premise Solutions, Cloud Solutions, Voice-controlled Devices, Smartphones & Tablets and Others) Growth, Future Prospects & Competitive Analysis, 2016 – 2030

Price: $4999

Published: | Report ID: 16939 | Report Format : PDF

Key Highlights of the report

How are the major segments performing in the voice user interface market?

  • In 2022, the solution category accounted for the largest share of the market. This is because speech user interface solutions offer several advantages, including adaptability, multitasking, accessibility, and privacy.
  • In 2022, the smart speakers category held a largest share. The residential market is increasingly adopting smart speakers because they allow voice recognition-based control over smart home applications, which is driving the segment’s growth.
  • In 2022, the consumer electronic category held a largest share. The dramatic decrease in the price of voice and speech devices, software advancements, and improvements in related content are all driving forces behind the speech and voice recognition sector.

What is the market size of voice user interface regarding value?

The global voice user interface market is anticipated to grow at a substantial CAGR of 22.50% in the upcoming years. The global Voice user interface industry was estimated to be worth USD 15.1 billion in 2022 and was expected to be worth USD 62.5 billion by 2028.

Design Element 2

Access crucial information at unmatched prices!

Request your free sample report today & start making informed decisions powered by Credence Research!

Download Free Sample
CTA Design Element 3

Which region dominated the voice user interface market?

In 2022, the North American region was anticipated to hold a prominent share in the global voice user interface market. The major drivers of the global voice user interface market are the growing use of speech recognition devices in multi-factor authentication systems across several industry verticals, the rising popularity of smart devices, and the population’s high level of disposable income. Additionally, the need for the voice user interface is growing as financial institutions implement voice authentication solutions, smart devices are being more widely used in government, BFSI, and other businesses, and data security concerns. A growing understanding of cloud computing applications, AI software, and the many benefits of voice assistant services will enhance resource utilization.

How US market is performing in the voice user interface market?

In 2022, the United States was anticipated to hold a prominent share of the global voice user interface market in the North American region. The use of voice assistants and smart speakers in homes and businesses is expected to grow, boosting the US market for voice user interfaces. The nation’s largest businesses and government agencies are investing heavily in technology. For instance, in March 2021, U.S. President Joe Biden unveiled a comprehensive plan to update the nation’s infrastructure that is expected to cost more than $2.25 trillion and present lucrative opportunities for voice user interface technology producers in the area.

How is the economy impacting the global voice user interface growth?

The devastating pandemic’s effects are slowly wearing off on the economy, but the harm it caused to the industries cannot be undone. Covid-19 similarly hampered the market for voice user interfaces. The Covid-19 epidemic significantly hurt the voice user interface market in 2020. The manufacturing of all products, including digital gadgets, was shut down worldwide following the directives provided by the government during the epidemic.

What is the competitive environment of the voice user interface market?

The major players use this tactic to boost their line of products and increase the size of their business. Major international firms are forging alliances and partnerships with other players to reorganize and expand their commercial activities. These businesses have consistently focused on R&D investments, collaborations, joint ventures, and acquisitions to expand their product line. For instance, in November 2021, Oracle Cloud Infrastructure (OCI), a cloud platform enabling you to create and manage various apps and services, joined forces with SoundHound. As part of this partnership, OCI would help SoundHound’s speech AI platform as it handles many queries and scales to enable rapid development and international expansion.

Executive Summary

What are the key trends in the voice user interface market?

  • With the development of technology, more individuals are utilizing robotics and artificial intelligence in various facets of their lives. Voice user interfaces boost productivity by enabling users to do several activities simultaneously. For instance, the Voice user interface allows the user to cook and write an email simultaneously.
  • Many innovative and fascinating technologies have evolved in the modern period. Numerous human duties have been made easier by technology because of the integration of several technologies. The addition of voice user interface has likely made it simpler for people to use social media networks.

How has the digital transformation of industries fueled market expansion?

The digital transformation in sectors like internet services, BFSI, communications, healthcare, and media and entertainment is one of the main drivers fueling the growth of the worldwide VUI market. Users’ preferences for internet services have changed due to the development of cutting-edge internet technologies like high-speed broadband and the advent of VoIP services on cell phones, which has accelerated the acceptance of new technologies. For instance, OTT services allow consumers to watch internet videos at home on laptops, desktop computers, or TV displays via a variety of devices, and the majority of these device manufacturers now include voice user interfaces. Online learning alters conventional educational processes through cutting-edge technology like Big Data analytics and AR. During the forecast period, these factors will fuel the market’s expansion.

Which are the key investments by the voice user interface market players?

The market for voice user interfaces will continue to develop as a result of significant industry players spending a lot of money on R&D to increase the range of their product offerings. Market participants are also undertaking several strategic activities to expand their worldwide reach, including collaboration with other organizations, greater investments in key market developments, and major market advancements. Furthermore, the growing adoption of voice user interfaces in autonomous vehicles will create new investment opportunities for regional market vendors, which will favor the market’s expansion throughout the projection period.

Some major players in the voice user interface market are Advanced Voice Recognition Systems, Inc., Agnitio S.L, Apple, Inc, Amazon, Inc., Baidu, Inc, BioTrust ID B.V, CastleOS Software, LLC, Facebook, Google and Microsoft Corporation.

Voice User Interface Market

What are the major driving factors for the voice user interface market?

Over the projection period, it is predicted that the voice user interface market would grow significantly due to the growing popularity of Internet of Things-based smart home applications. The industry has grown as a result of the popularity of voice-based biometric security solutions. In addition, the market opportunity for voice user interfaces is projected to be fueled by increased interest in self-service apps and voice-activated navigation systems in the automotive sector. On the other hand, it is anticipated that advancements in artificial intelligence technology will present enticing possibilities for the expansion of the voice user interface market over the projected timeframe.

What are the major risks for the voice user interface market?

The rise of the sector is being hampered by the challenges of combining many languages and the growing concerns about data protection from voice-enabled smart devices. Furthermore, the security issues related to voice user interfaces are another major barrier to the growth of the global VUI industry. Network security in high-security sectors is thought to threaten national security in many nations because these network areas could be targets of terrorist strikes. VUI might not be widely used in the future because it is a possible target for hackers.

Which is the key industry vertical category in the voice user interface market?

The consumer electronic category held the largest share in the market in 2022. There are numerous market-dominating products as a result of the introduction of voice-based intelligent gadgets in the consumer sector. The consumer vertical’s speech and voice recognition market is projected to be significantly influenced by the increased demand for intelligent virtual assistants and speakers with voice capabilities throughout the forecast period. One of the significant VUI market trends anticipated to have a favorable effect on the sector during the projected period is the rising demand for consumer electronics, such as smart homes and the creation of smart cities. To help with tasks based on human commands, VUI is employed in household appliances. This results in the segment’s expansion.

How is the voice user interface market performing in regions?

Asia Pacific market is anticipated to witness fastest growth in the global voice user interface market during the forecast period. This is linked to increased knowledge of voice assistant services, cloud computing, and artificial intelligence applications that can improve resource utilization.  Additionally, it is projected that the increased use of AI technology in the BFSI, healthcare, automotive, and government sectors would accelerate the regional adoption of voice technology. A major factor in the rapid adoption of voice user interface technology in the area is the existence of developing nations like China and India.

What is the regulatory landscape for the voice user interface market?

A major problem for the market’s expansion is the rise in worries about data privacy from voice-enabled smart devices and the difficulty of integrating numerous languages. As a result, the government has enacted numerous rules to protect users’ privacy. Due to a rise in demand for digital applications and work-from-home rules adopted by the governments of numerous nations, the VUI has increased demand from the residential sector.

Shape Your Report to Specific Countries or Regions & Enjoy 30% Off!

What are the major players planning for the future of the voice user interface market?

Through creative ideas and solutions, multinational corporations like Microsoft Corporation (Microsoft), IBM, and Alphabet Inc. are promoting the growth of smart cities. Vendors create items in response to consumer demands and preferences. For instance, Amazon Alexa, a sophisticated personal assistant created by the online retailer, offers voice control of smart home appliances. Like Amazon Echo, Alphabet Inc.’s Google Home is a smart speaker that manages every aspect of a smart home. Thus, the rising adoption of technology will drive the market expansion in the coming years.

REPORT ATTRIBUTE DETAILS
Voice User Interface Market by Volume Yes
Voice User Interface Market by Value Yes
Voice User Interface Market, Tornado Analysis Yes
Voice User Interface Market, STAR Analysis Yes
Voice User Interface Market, SRC Analysis Yes
Voice User Interface Market, Import-Export Data Yes (On Demand)
Voice User Interface Market Pricing Analysis Yes (On Demand)
Voice User Interface Market Segment Analysis By Offering (Solution and Service)

By Application (Smart Speakers, Interactive Voice Response, On-premise Solutions, Cloud Solutions, Voice-controlled Devices, Smartphones & Tablets and Others)

By Industry Vertical (BFSI, Retail & E-commerce, Consumer Electronic, Automotive & Transportation, Healthcare & Life Science, Travel & Hospitality, Government & Defense Sector and Others (Media &entertainment, IT & Telecommunication, and Commercial Sector))

Voice User Interface Market, Regional Analysis North America (US and Canada)

Europe (Germany, UK, France, Italy, Spain, and Rest of Europe)

Asia Pacific (China, India, Japan, South Korea, South East Asia, and Rest of Asia Pacific)

Latin America (Brazil, Mexico, and Rest of Latin America)

Middle East and Africa (GCC Countries, South Africa, and Rest of Middle East and Africa)

Voice User Interface Market Key Companies Advanced Voice Recognition Systems, Inc., Agnitio S.L, Apple, Inc, Amazon, Inc., Baidu, Inc, BioTrust ID B.V, CastleOS Software, LLC, Facebook, Google and Microsoft Corporation
Voice User Interface Market Competitive Landscape Market Share Analysis

Competitive Benchmarking

Key Players Market Positioning

Geographical Presence Analysis

Major Strategies Adopted

Segmentation of Global Voice User Interface Market-

Global Voice User Interface Market – By Offering

  • Solution
  • Service

Global Voice User Interface Market – By Application

  • Smart Speakers
  • Interactive Voice Response
  • On-premise Solutions
  • Cloud Solutions
  • Voice-controlled Devices
  • Smartphones & Tablets
  • Others

Global Voice User Interface Market – By Industry Vertical

  • BFSI
  • Retail & E-commerce
  • Consumer Electronic
  • Automotive & Transportation
  • Healthcare & Life Science
  • Travel & Hospitality
  • Government & Defense Sector
  • Others
    • Media &entertainment
    • IT & Telecommunication
    • Commercial Sector

Global Voice User Interface Market – By Region

  • North America
    • U.S.
    • Canada
  • Europe
    • Germany
    • France
    • U.K.
    • Italy
    • Spain
    • Rest of Europe
  • Asia Pacific
    • China
    • Japan
    • India
    • South Korea
    • South-east Asia
    • Rest of Asia Pacific
  • Latin America
    • Brazil
    • Mexico
    • Rest of Latin America
  • Middle East & Africa
    • GCC Countries
    • South Africa
    • Rest of Middle East and Africa

1. Preface
1.1. Report Description
1.1.1. Purpose of the Report
1.1.2. Target Audience
1.1.3. USP and Key Offerings
1.2. Research Scope
1.3. Research Methodology
1.3.1. Phase I – Secondary Research
1.3.2. Phase II – Primary Research
1.3.3. Phase III – Expert Panel Review
1.3.4. Approach Adopted
1.3.4.1. Top-Down Approach
1.3.4.2. Bottom-Up Approach
1.3.5. Assumptions
1.4. Market Introduction
1.5. Market Research Scope

2. Executive Summary
2.1. Market Snapshot: Global Voice User Interface Market
2.2. Global Voice User Interface Market, By Type
2.3. Global Voice User Interface Market, By Service
2.4. Global Voice User Interface Market, By Equipment Type
2.5. Global Voice User Interface Market, By Region

3. Market Dynamics & Factors Analysis
3.1. Introduction
3.1.1. Global Voice User Interface Market Value, 2017-2030, (US$ Bn)
3.1.2. Y-o-Y Growth Trend Analysis
3.2. Market Dynamics
3.2.1. Market Drivers
3.2.2. Market Restraints
3.2.3. Market Opportunities
3.2.4. Major Industry Challenges
3.3. Growth and Development Patterns
3.4. Investment Feasibility Analysis
3.5. Market Opportunity Analysis
3.5.1. Type
3.5.2. Service
3.5.3. Equipment Type
3.5.4. Geography

4. Premium Insights
4.1. STAR (Situation, Task, Action, Results) Analysis
4.2. Porter’s Five Forces Analysis
4.2.1. Threat of New Entrants
4.2.2. Bargaining Power of Buyers/Consumers
4.2.3. Bargaining Power of Suppliers
4.2.4. Threat of Substitute Types
4.2.5. Intensity of Competitive Rivalry
4.3. Key Market Trends
4.3.1. Demand Side Trends
4.3.2. Supply Side Trends
4.4. Value Chain Analysis
4.5. Material Analysis
4.6. Analysis and Recommendations
4.7. Marketing Strategy Analysis
4.7.1. Direct Marketing
4.7.2. Indirect Marketing
4.7.3. Marketing Channel Development Trend

5. Market Positioning of Key Players, 2022
5.1. Company market share of key players, 2022
5.2. Competitive Benchmarking
5.3. Market Positioning of Key Vendors
5.4. Geographical Presence Analysis
5.5. Major Strategies Adopted by Key Players
5.5.1. Key Strategies Analysis
5.5.2. Mergers and Acquisitions
5.5.3. Partnerships
5.5.4. Product Launch
5.5.5. Geographical Expansion
5.5.6. Others

6. Economic Impact Analysis
6.1. Recession Impact
6.1.1. North America
6.1.2. Europe
6.1.3. Asia Pacific
6.1.4. Latin America
6.1.5. Middle East and Africa
6.2. Ukraine-Russia War Impact
6.2.1. North America
6.2.2. Europe
6.2.3. Asia Pacific
6.2.4. Latin America
6.2.5. Middle East and Africa
6.3. COVID-19 Impact Analysis
6.3.1. North America
6.3.2. Europe
6.3.3. Asia Pacific
6.3.4. Latin America
6.3.5. Middle East and Africa

7. Global Voice User Interface Market
7.1. Global Voice User Interface Market, by Type, 2017-2030 (US$ Bn)
7.1.1. Overview
7.1.2. Global Voice User Interface Market, By Type, 2022 vs 2030 (in%)
7.1.3. Global Voice User Interface Market, By Polymetallic Nodules, 2017-2030 (US$ Bn)
7.1.4. Global Voice User Interface Market, By Polymetallic Sulphides, 2017-2030 (US$ Bn)
7.1.5. Global Voice User Interface Market, By Cobalt-Rich Crusts, 2017-2030 (US$ Bn)
7.2. Global Voice User Interface Market, by Service, 2017-2030 (US$ Bn)
7.2.1. Overview
7.2.2. Global Voice User Interface Market, By Service, 2022 vs 2030 (in%)
7.2.3. Global Voice User Interface Market, By Exploration, 2017-2030 (US$ Bn)
7.2.4. Global Voice User Interface Market, By Extraction, 2017-2030 (US$ Bn)
7.3. Global Voice User Interface Market, by Equipment Type, 2017-2030 (US$ Bn)
7.3.1. Overview
7.3.2. Global Voice User Interface Market, By Equipment Type, 2022 vs 2030 (in%)
7.3.3. Global Voice User Interface Market, By Seabed Mining Crawler, 2017-2030 (US$ Bn)
7.3.4. Global Voice User Interface Market, By Riser System, 2017-2030 (US$ Bn)
7.3.5. Global Voice User Interface Market, By Others, 2017-2030 (US$ Bn)

8. North America Voice User Interface Market Analysis
8.1. North America Voice User Interface Market, by Type, 2017-2030(US$ Bn)
8.1.1. Overview
8.1.2. SRC Analysis
8.2. North America Voice User Interface Market, by Service, 2017-2030(US$ Bn)
8.2.1. Overview
8.2.2. SRC Analysis
8.3. North America Voice User Interface Market, by Equipment Type, 2017-2030(US$ Bn)
8.3.1. Overview
8.3.2. SRC Analysis
8.4. North America Voice User Interface Market, by Country, 2017-2030 (US$ Bn)
8.4.1. U.S.
8.4.1.1. U.S. Voice User Interface Market Estimates and Forecast, 2017-2030 (US$ Bn)
8.4.1.2. U.S. Voice User Interface, By Type, 2017-2030 (US$ Bn)
8.4.1.3. U.S. Voice User Interface, By Service, 2017-2030 (US$ Bn)
8.4.1.4. U.S. Voice User Interface, By Equipment Type, 2017-2030 (US$ Bn)
8.4.2. Canada
8.4.2.1. Canada Voice User Interface Market Estimates and Forecast, 2017-2030 (US$ Bn)
8.4.2.2. Canada Voice User Interface, By Type, 2017-2030 (US$ Bn)
8.4.2.3. Canada Voice User Interface, By Service, 2017-2030 (US$ Bn)
8.4.2.4. Canada Voice User Interface, By Equipment Type, 2017-2030 (US$ Bn)

9. Europe Voice User Interface Market Analysis
9.1. Europe Voice User Interface Market, by Type, 2017-2030(US$ Bn)
9.1.1. Overview
9.1.2. SRC Analysis
9.2. Europe Voice User Interface Market, by Service, 2017-2030(US$ Bn)
9.2.1. Overview
9.2.2. SRC Analysis
9.3. Europe Voice User Interface Market, by Equipment Type, 2017-2030(US$ Bn)
9.3.1. Overview
9.3.2. SRC Analysis
9.4. Europe Voice User Interface Market, by Country, 2017-2030 (US$ Bn)
9.4.1. Germany
9.4.1.1. Germany Voice User Interface Market Estimates and Forecast, 2017-2030 (US$ Bn)
9.4.1.2. Germany Voice User Interface, By Type, 2017-2030 (US$ Bn)
9.4.1.3. Germany Voice User Interface, By Service, 2017-2030 (US$ Bn)
9.4.1.4. Germany Voice User Interface, By Equipment Type, 2017-2030 (US$ Bn)
9.4.2. France
9.4.2.1. France Voice User Interface Market Estimates and Forecast, 2017-2030 (US$ Bn)
9.4.2.2. France Voice User Interface, By Type, 2017-2030 (US$ Bn)
9.4.2.3. France Voice User Interface, By Service, 2017-2030 (US$ Bn)
9.4.2.4. France Voice User Interface, By Equipment Type, 2017-2030 (US$ Bn)
9.4.3. UK
9.4.3.1. UK Voice User Interface Market Estimates and Forecast, 2017-2030 (US$ Bn)
9.4.3.2. UK Voice User Interface, By Type, 2017-2030 (US$ Bn)
9.4.3.3. UK Voice User Interface, By Service, 2017-2030 (US$ Bn)
9.4.3.4. UK Voice User Interface, By Equipment Type, 2017-2030 (US$ Bn)
9.4.4. Italy
9.4.4.1. Italy Voice User Interface Market Estimates and Forecast, 2017-2030 (US$ Bn)
9.4.4.2. Italy Voice User Interface, By Type, 2017-2030 (US$ Bn)
9.4.4.3. Italy Voice User Interface, By Service, 2017-2030 (US$ Bn)
9.4.4.4. Italy Voice User Interface, By Equipment Type, 2017-2030 (US$ Bn)
9.4.5. Spain
9.4.5.1. Spain Voice User Interface Market Estimates and Forecast, 2017-2030 (US$ Bn)
9.4.5.2. Spain Voice User Interface, By Type, 2017-2030 (US$ Bn)
9.4.5.3. Spain Voice User Interface, By Service, 2017-2030 (US$ Bn)
9.4.5.4. Spain Voice User Interface, By Equipment Type, 2017-2030 (US$ Bn)
9.4.6. Rest of Europe
9.4.6.1. Rest of Europe Voice User Interface Market Estimates and Forecast, 2017-2030 (US$ Bn)
9.4.6.2. Rest of Europe Voice User Interface, By Type, 2017-2030 (US$ Bn)
9.4.6.3. Rest of Europe Voice User Interface, By Service, 2017-2030 (US$ Bn)
9.4.6.4. Rest of Europe Voice User Interface, By Equipment Type, 2017-2030 (US$ Bn)

10. Asia Pacific Voice User Interface Market Analysis
10.1. Asia Pacific Voice User Interface Market, by Type, 2017-2030(US$ Bn)
10.1.1. Overview
10.1.2. SRC Analysis
10.2. Asia Pacific Voice User Interface Market, by Service, 2017-2030(US$ Bn)
10.2.1. Overview
10.2.2. SRC Analysis
10.3. Asia Pacific Voice User Interface Market, by Equipment Type, 2017-2030(US$ Bn)
10.3.1. Overview
10.3.2. SRC Analysis
10.4. Asia Pacific Voice User Interface Market, by Country, 2017-2030 (US$ Bn)
10.4.1. China
10.4.1.1. China Voice User Interface Market Estimates and Forecast, 2017-2030 (US$ Bn)
10.4.1.2. China Voice User Interface, By Type, 2017-2030 (US$ Bn)
10.4.1.3. China Voice User Interface, By Service, 2017-2030 (US$ Bn)
10.4.1.4. China Voice User Interface, By Equipment Type, 2017-2030 (US$ Bn)
10.4.2. Japan
10.4.2.1. Japan Voice User Interface Market Estimates and Forecast, 2017-2030 (US$ Bn)
10.4.2.2. Japan Voice User Interface, By Type, 2017-2030 (US$ Bn)
10.4.2.3. Japan Voice User Interface, By Service, 2017-2030 (US$ Bn)
10.4.2.4. Japan Voice User Interface, By Equipment Type, 2017-2030 (US$ Bn)
10.4.3. India
10.4.3.1. India Voice User Interface Market Estimates and Forecast, 2017-2030 (US$ Bn)
10.4.3.2. India Voice User Interface, By Type, 2017-2030 (US$ Bn)
10.4.3.3. India Voice User Interface, By Service, 2017-2030 (US$ Bn)
10.4.3.4. India Voice User Interface, By Equipment Type, 2017-2030 (US$ Bn)
10.4.4. South Korea
10.4.4.1. South Korea Voice User Interface Market Estimates and Forecast, 2017-2030 (US$ Bn)
10.4.4.2. South Korea Voice User Interface, By Type, 2017-2030 (US$ Bn)
10.4.4.3. South Korea Voice User Interface, By Service, 2017-2030 (US$ Bn)
10.4.4.4. South Korea Voice User Interface, By Equipment Type, 2017-2030 (US$ Bn)
10.4.5. South-East Asia
10.4.5.1. South-East Asia Voice User Interface Market Estimates and Forecast, 2017-2030 (US$ Bn)
10.4.5.2. South-East Asia Voice User Interface, By Type, 2017-2030 (US$ Bn)
10.4.5.3. South-East Asia Voice User Interface, By Service, 2017-2030 (US$ Bn)
10.4.5.4. South-East Asia Voice User Interface, By Equipment Type, 2017-2030 (US$ Bn)
10.4.6. Rest of Asia Pacific
10.4.6.1. Rest of Asia Pacific Voice User Interface Market Estimates and Forecast, 2017-2030 (US$ Bn)
10.4.6.2. Rest of Asia Pacific Voice User Interface, By Type, 2017-2030 (US$ Bn)
10.4.6.3. Rest of Asia Pacific Voice User Interface, By Service, 2017-2030 (US$ Bn)
10.4.6.4. Rest of Asia Pacific Voice User Interface, By Equipment Type, 2017-2030 (US$ Bn)

11. Latin America Voice User Interface Market Analysis
11.1. Latin America Voice User Interface Market, by Type, 2017-2030(US$ Bn)
11.1.1. Overview
11.1.2. SRC Analysis
11.2. Latin America Voice User Interface Market, by Service, 2017-2030(US$ Bn)
11.2.1. Overview
11.2.2. SRC Analysis
11.3. Latin America Voice User Interface Market, by Equipment Type, 2017-2030(US$ Bn)
11.3.1. Overview
11.3.2. SRC Analysis
11.4. Latin America Voice User Interface Market, by Country, 2017-2030 (US$ Bn)
11.4.1. Brazil
11.4.1.1. Brazil Voice User Interface Market Estimates and Forecast, 2017-2030 (US$ Bn)
11.4.1.2. Brazil Voice User Interface, By Type, 2017-2030 (US$ Bn)
11.4.1.3. Brazil Voice User Interface, By Service, 2017-2030 (US$ Bn)
11.4.1.4. Brazil Voice User Interface, By Equipment Type, 2017-2030 (US$ Bn)
11.4.2. Mexico
11.4.2.1. Mexico Voice User Interface Market Estimates and Forecast, 2017-2030 (US$ Bn)
11.4.2.2. Mexico Voice User Interface, By Type, 2017-2030 (US$ Bn)
11.4.2.3. Mexico Voice User Interface, By Service, 2017-2030 (US$ Bn)
11.4.2.4. Mexico Voice User Interface, By Equipment Type, 2017-2030 (US$ Bn)
11.4.3. Rest of Latin America
11.4.3.1. Rest of Latin America Voice User Interface Market Estimates and Forecast, 2017-2030 (US$ Bn)
11.4.3.2. Rest of Latin America Voice User Interface, By Type, 2017-2030 (US$ Bn)
11.4.3.3. Rest of Latin America Voice User Interface, By Service, 2017-2030 (US$ Bn)
11.4.3.4. Rest of Latin America Voice User Interface, By Equipment Type, 2017-2030 (US$ Bn)

12. Middle East and Africa Voice User Interface Market Analysis
12.1. Middle East and Africa Voice User Interface Market, by Type, 2017-2030(US$ Bn)
12.1.1. Overview
12.1.2. SRC Analysis
12.2. Middle East and Africa Voice User Interface Market, by Service, 2017-2030(US$ Bn)
12.2.1. Overview
12.2.2. SRC Analysis
12.3. Middle East and Africa Voice User Interface Market, by Equipment Type, 2017-2030(US$ Bn)
12.3.1. Overview
12.3.2. SRC Analysis
12.4. Middle East and Africa Voice User Interface Market, by Country, 2017-2030 (US$ Bn)
12.4.1. GCC Countries
12.4.1.1. GCC Countries Voice User Interface Market Estimates and Forecast, 2017-2030 (US$ Bn)
12.4.1.2. GCC Countries Voice User Interface, By Type, 2017-2030 (US$ Bn)
12.4.1.3. GCC Countries Voice User Interface, By Service, 2017-2030 (US$ Bn)
12.4.1.4. GCC Countries Voice User Interface, By Equipment Type, 2017-2030 (US$ Bn)
12.4.2. South Africa
12.4.2.1. South Africa Voice User Interface Market Estimates and Forecast, 2017-2030 (US$ Bn)
12.4.2.2. South Africa Voice User Interface, By Type, 2017-2030 (US$ Bn)
12.4.2.3. South Africa Voice User Interface, By Service, 2017-2030 (US$ Bn)
12.4.2.4. South Africa Voice User Interface, By Equipment Type, 2017-2030 (US$ Bn)
12.4.3. Rest of Middle East and Africa
12.4.3.1. Rest of Middle East and Africa Voice User Interface Market Estimates and Forecast, 2017-2030 (US$ Bn)
12.4.3.2. Rest of Middle East and Africa Voice User Interface, By Type, 2017-2030 (US$ Bn)
12.4.3.3. Rest of Middle East and Africa Voice User Interface, By Service, 2017-2030 (US$ Bn)
12.4.3.4. Rest of Middle East and Africa Voice User Interface, By Equipment Type, 2017-2030 (US$ Bn)

13. Company Profiles
13.1. 2H Offshore (Acteon Group Ltd.)
13.1.1. Company Overview
13.1.2. Products/Services Portfolio
13.1.3. Geographical Presence
13.1.4. Financial Summary
13.1.4.1. Market Revenue and Net Profit (2019-2022)
13.1.4.2. Business Segment Revenue Analysis
13.1.4.3. Geographical Revenue Analysis
13.2. Bauer AG
13.3. Cellula Robotics Ltd.
13.4. Deep Reach Technology, Inc.
13.5. Kongsberg Maritime
13.6. Odyssey Marine Exploration, Inc.
13.7. Robert Bosch GmbH
13.8. Saab Seaeye Ltd (Saab AB)
13.9. SEAS Offshore Pty Ltd
13.10. Soil Machine Dynamics Ltd

List of Figures
FIG. 1 Global Voice User Interface Market: Research Methodology
FIG. 2 Market Size Estimation – Top Down & Bottom up Approach
FIG. 3 Global Voice User Interface Market Segmentation
FIG. 4 Global Voice User Interface Market, by Type, 2022 (US$ Bn)
FIG. 5 Global Voice User Interface Market, by Service, 2022 (US$ Bn)
FIG. 6 Global Voice User Interface Market, by Equipment Type, 2022 (US$ Bn)
FIG. 7 Global Voice User Interface Market, by Geography, 2022 (US$ Bn)
FIG. 8 Attractive Investment Proposition, by Type, 2022
FIG. 9 Attractive Investment Proposition, by Service, 2022
FIG. 10 Attractive Investment Proposition, by Equipment Type, 2022
FIG. 11 Attractive Investment Proposition, by Geography, 2022
FIG. 12 Global Market Share Analysis of Key Voice User Interface Market Manufacturers, 2022
FIG. 13 Global Market Positioning of Key Voice User Interface Market Manufacturers, 2022
FIG. 14 Global Voice User Interface Market Value Contribution, By Type, 2022 & 2030 (Value %)
FIG. 15 Global Voice User Interface Market, by Polymetallic Nodules, Value, 2017-2030 (US$ Bn)
FIG. 16 Global Voice User Interface Market, by Polymetallic Sulphides, Value, 2017-2030 (US$ Bn)
FIG. 17 Global Voice User Interface Market, by Cobalt-Rich Crusts, Value, 2017-2030 (US$ Bn)
FIG. 18 Global Voice User Interface Market Value Contribution, By Service, 2022 & 2030 (Value %)
FIG. 19 Global Voice User Interface Market, by Exploration, Value, 2017-2030 (US$ Bn)
FIG. 20 Global Voice User Interface Market, by Extraction, 2017-2030 (US$ Bn)
FIG. 21 Global Voice User Interface Market Value Contribution, By Equipment Type, 2022 & 2030 (Value %)
FIG. 22 Global Voice User Interface Market, by Seabed Mining Crawler, Value, 2017-2030 (US$ Bn)
FIG. 23 Global Voice User Interface Market, by Riser System, 2017-2030 (US$ Bn)
FIG. 24 Global Voice User Interface Market, by Others, 2017-2030 (US$ Bn)
FIG. 25 North America Voice User Interface Market, 2017-2030 (US$ Bn)
FIG. 26 U.S. Voice User Interface Market, 2017-2030 (US$ Bn)
FIG. 27 Canada Voice User Interface Market, 2017-2030 (US$ Bn)
FIG. 28 Europe Voice User Interface Market, 2017-2030 (US$ Bn)
FIG. 29 Germany Voice User Interface Market, 2017-2030 (US$ Bn)
FIG. 30 France Voice User Interface Market, 2017-2030 (US$ Bn)
FIG. 31 U.K. Voice User Interface Market, 2017-2030 (US$ Bn)
FIG. 32 Italy Voice User Interface Market, 2017-2030 (US$ Bn)
FIG. 33 Spain Voice User Interface Market, 2017-2030 (US$ Bn)
FIG. 34 Rest of Europe Voice User Interface Market, 2017-2030 (US$ Bn)
FIG. 35 Asia Pacific Voice User Interface Market, 2017-2030 (US$ Bn)
FIG. 36 China Voice User Interface Market, 2017-2030 (US$ Bn)
FIG. 37 Japan Voice User Interface Market, 2017-2030 (US$ Bn)
FIG. 38 India Voice User Interface Market, 2017-2030 (US$ Bn)
FIG. 39 South Korea Voice User Interface Market, 2017-2030 (US$ Bn)
FIG. 40 South-East Asia Voice User Interface Market, 2017-2030 (US$ Bn)
FIG. 41 Rest of Asia Pacific Voice User Interface Market, 2017-2030 (US$ Bn)
FIG. 42 Latin America Voice User Interface Market, 2017-2030 (US$ Bn)
FIG. 43 Brazil Voice User Interface Market, 2017-2030 (US$ Bn)
FIG. 44 Mexico Voice User Interface Market, 2017-2030 (US$ Bn)
FIG. 45 Rest of Latin America Voice User Interface Market, 2017-2030 (US$ Bn)
FIG. 46 Middle East & Africa Voice User Interface Market, 2017-2030 (US$ Bn)
FIG. 47 GCC Countries Voice User Interface Market, 2017-2030 (US$ Bn)
FIG. 48 South Africa Voice User Interface Market, 2017-2030 (US$ Bn)
FIG. 49 Rest of Middle East and Africa Voice User Interface Market, 2017-2030 (US$ Bn)

List of Tables
TABLE 1 Market Snapshot: Global Voice User Interface Market
TABLE 2 Global Voice User Interface Market, by Competitive Benchmarking, 2022
TABLE 3 Global Voice User Interface Market, by Geographical Presence Analysis, 2022
TABLE 4 Global Voice User Interface Market, by Key Strategies Analysis, 2022
TABLE 5 Global Voice User Interface Market, by Type, 2017-2030 (US$ Bn)
TABLE 6 Global Voice User Interface Market, by Service, 2017-2030 (US$ Bn)
TABLE 7 Global Voice User Interface Market, by Equipment Type, 2017-2030 (US$ Bn)
TABLE 8 Global Voice User Interface Market, by Geography, 2017-2030 (US$ Bn)
TABLE 9 North America Voice User Interface Market, by Type, 2017-2030 (US$ Bn)
TABLE 10 North America Voice User Interface Market, by Service, 2017-2030 (US$ Bn)
TABLE 11 North America Voice User Interface Market, by Equipment Type, 2017-2030 (US$ Bn)
TABLE 12 North America Voice User Interface Market, by Country, 2017-2030 (US$ Bn)
TABLE 13 US Voice User Interface Market, by Type, 2017-2030 (US$ Bn)
TABLE 14 US Voice User Interface Market, by Service, 2017-2030 (US$ Bn)
TABLE 15 US Voice User Interface Market, by Equipment Type, 2017-2030 (US$ Bn)
TABLE 16 Canada Voice User Interface Market, by Type, 2017-2030 (US$ Bn)
TABLE 17 Canada Voice User Interface Market, by Service, 2017-2030 (US$ Bn)
TABLE 18 Canada Voice User Interface Market, by Equipment Type, 2017-2030 (US$ Bn)
TABLE 19 Europe Voice User Interface Market, by Type, 2017-2030 (US$ Bn)
TABLE 20 Europe Voice User Interface Market, by Service, 2017-2030 (US$ Bn)
TABLE 21 Europe Voice User Interface Market, by Equipment Type, 2017-2030 (US$ Bn)
TABLE 22 Europe Voice User Interface Market, by Country, 2017-2030 (US$ Bn)
TABLE 23 Germany Voice User Interface Market, by Type, 2017-2030 (US$ Bn)
TABLE 24 Germany Voice User Interface Market, by Service, 2017-2030 (US$ Bn)
TABLE 25 Germany Voice User Interface Market, by Equipment Type, 2017-2030 (US$ Bn)
TABLE 26 France Voice User Interface Market, by Type, 2017-2030 (US$ Bn)
TABLE 27 France Voice User Interface Market, by Service, 2017-2030 (US$ Bn)
TABLE 28 France Voice User Interface Market, by Equipment Type, 2017-2030 (US$ Bn)
TABLE 29 UK Voice User Interface Market, by Type, 2017-2030 (US$ Bn)
TABLE 30 UK Voice User Interface Market, by Service, 2017-2030 (US$ Bn)
TABLE 31 UK Voice User Interface Market, by Equipment Type, 2017-2030 (US$ Bn)
TABLE 32 Italy Voice User Interface Market, by Type, 2017-2030 (US$ Bn)
TABLE 33 Italy Voice User Interface Market, by Service, 2017-2030 (US$ Bn)
TABLE 34 Italy Voice User Interface Market, by Equipment Type, 2017-2030 (US$ Bn)
TABLE 35 Spain Voice User Interface Market, by Type, 2017-2030 (US$ Bn)
TABLE 36 Spain Voice User Interface Market, by Service, 2017-2030 (US$ Bn)
TABLE 37 Spain Voice User Interface Market, by Equipment Type, 2017-2030 (US$ Bn)
TABLE 38 Rest of Europe Voice User Interface Market, by Type, 2017-2030 (US$ Bn)
TABLE 39 Rest of Europe Voice User Interface Market, by Service, 2017-2030 (US$ Bn)
TABLE 40 Rest of Europe Voice User Interface Market, by Equipment Type, 2017-2030 (US$ Bn)
TABLE 41 Asia Pacific Voice User Interface Market, by Type, 2017-2030 (US$ Bn)
TABLE 42 Asia Pacific Voice User Interface Market, by Service, 2017-2030 (US$ Bn)
TABLE 43 Asia Pacific Voice User Interface Market, by Equipment Type, 2017-2030 (US$ Bn)
TABLE 44 Asia Pacific Voice User Interface Market, by Country, 2017-2030 (US$ Bn)
TABLE 45 China Voice User Interface Market, by Type, 2017-2030 (US$ Bn)
TABLE 46 China Voice User Interface Market, by Service, 2017-2030 (US$ Bn)
TABLE 47 China Voice User Interface Market, by Equipment Type, 2017-2030 (US$ Bn)
TABLE 48 Japan Voice User Interface Market, by Type, 2017-2030 (US$ Bn)
TABLE 49 Japan Voice User Interface Market, by Service, 2017-2030 (US$ Bn)
TABLE 50 Japan Voice User Interface Market, by Equipment Type, 2017-2030 (US$ Bn)
TABLE 51 India Voice User Interface Market, by Type, 2017-2030 (US$ Bn)
TABLE 52 India Voice User Interface Market, by Service, 2017-2030 (US$ Bn)
TABLE 53 India Voice User Interface Market, by Equipment Type, 2017-2030 (US$ Bn)
TABLE 54 South Korea Voice User Interface Market, by Type, 2017-2030 (US$ Bn)
TABLE 55 South Korea Voice User Interface Market, by Service, 2017-2030 (US$ Bn)
TABLE 56 South Korea Voice User Interface Market, by Equipment Type, 2017-2030 (US$ Bn)
TABLE 57 South-East Asia Voice User Interface Market, by Type, 2017-2030 (US$ Bn)
TABLE 58 South-East Asia Voice User Interface Market, by Service, 2017-2030 (US$ Bn)
TABLE 59 South-East Asia Voice User Interface Market, by Equipment Type, 2017-2030 (US$ Bn)
TABLE 60 Rest of Asia Pacific Voice User Interface Market, by Type, 2017-2030 (US$ Bn)
TABLE 61 Rest of Asia Pacific Voice User Interface Market, by Service, 2017-2030 (US$ Bn)
TABLE 62 Rest of Asia Pacific Voice User Interface Market, by Equipment Type, 2017-2030 (US$ Bn)
TABLE 63 Latin America Voice User Interface Market, by Type, 2017-2030 (US$ Bn)
TABLE 64 Latin America Voice User Interface Market, by Service, 2017-2030 (US$ Bn)
TABLE 65 Latin America Voice User Interface Market, by Equipment Type, 2017-2030 (US$ Bn)
TABLE 66 Latin America Voice User Interface Market, by Country, 2017-2030 (US$ Bn)
TABLE 67 Brazil Voice User Interface Market, by Type, 2017-2030 (US$ Bn)
TABLE 68 Brazil Voice User Interface Market, by Service, 2017-2030 (US$ Bn)
TABLE 69 Brazil Voice User Interface Market, by Equipment Type, 2017-2030 (US$ Bn)
TABLE 70 Mexico Voice User Interface Market, by Type, 2017-2030 (US$ Bn)
TABLE 71 Mexico Voice User Interface Market, by Service, 2017-2030 (US$ Bn)
TABLE 72 Mexico Voice User Interface Market, by Equipment Type, 2017-2030 (US$ Bn)
TABLE 73 Rest of Latin America Voice User Interface Market, by Type, 2017-2030 (US$ Bn)
TABLE 74 Rest of Latin America Voice User Interface Market, by Service, 2017-2030 (US$ Bn)
TABLE 75 Rest of Latin America Voice User Interface Market, by Equipment Type, 2017-2030 (US$ Bn)
TABLE 76 Middle East and Africa Voice User Interface Market, by Type, 2017-2030 (US$ Bn)
TABLE 77 Middle East and Africa Voice User Interface Market, by Service, 2017-2030 (US$ Bn)
TABLE 78 Middle East and Africa Voice User Interface Market, by Equipment Type, 2017-2030 (US$ Bn)
TABLE 79 Middle East and Africa Voice User Interface Market, by Country, 2017-2030 (US$ Bn)
TABLE 80 GCC Countries Voice User Interface Market, by Type, 2017-2030 (US$ Bn)
TABLE 81 GCC Countries Voice User Interface Market, by Service, 2017-2030 (US$ Bn)
TABLE 82 GCC Countries Voice User Interface Market, by Equipment Type, 2017-2030 (US$ Bn)
TABLE 83 South Africa Voice User Interface Market, by Type, 2017-2030 (US$ Bn)
TABLE 84 South Africa Voice User Interface Market, by Service, 2017-2030 (US$ Bn)
TABLE 85 South Africa Voice User Interface Market, by Equipment Type, 2017-2030 (US$ Bn)
TABLE 86 Rest of Middle East and Africa Voice User Interface Market, by Type, 2017-2030 (US$ Bn)
TABLE 87 Rest of Middle East and Africa Voice User Interface Market, by Service, 2017-2030 (US$ Bn)
TABLE 88 Rest of Middle East and Africa Voice User Interface Market, by Equipment Type, 2017-2030 (US$ Bn)

Frequently asked questions

How does COVID-19 Impact the global voice user interface market?

The Covid-19 epidemic significantly hurt the voice user interface market in 2020. The manufacturing of all products, including digital gadgets, was shut down worldwide following the directives provided by the government during the epidemic.

Which is the leading region of the market for voice user interface?

North America accounted for the most heightened share in the global voice user interface market.

What are the key drivers for the growth of the voice user interface market?

Over the projection period, it is predicted that the voice user interface market would grow significantly due to the growing popularity of Internet of Things-based smart home applications.

Which is the major segment in the voice user interface market by offering?

The solution segment had a major share in the global market in 2022.

Which is the major segment in the voice user interface market by industry vertical?

The consumer electronic segment had a major share in the global market.

Saudi Arabia Managed Security Services Market

Published:
Report ID: 36393

Microwave Oven Market

Published:
Report ID: 36314

Inkjet Coders Market

Published:
Report ID: 6669

Rich Communication Services Market

Published:
Report ID: 35774

Middle East and Africa Real-Time Payments Market

Published:
Report ID: 35770

Vietnam Managed Security Services (MSS) Market

Published:
Report ID: 35766

Middle East and Africa EdTech and Smart Classroom Market

Published:
Report ID: 35756

Digital Business Support System (DBSS) Market

Published:
Report ID: 35732

China Artificial Intelligence (AI) Market

Published:
Report ID: 35729

Asia-Pacific Workforce Management Software Market

Published:
Report ID: 35719

Mobile Wallet Market

Published:
Report ID: 8977

Recirculating Chillers Market

Published:
Report ID: 8862

Purchase Options

$2999
Delivery Format: Excel.
$4999
Designed for the individual purchaser.
$6999
Users located at a single corporate site or regional office.
$7999
Allowed for unlimited sharing globally within one company.
Smallform of Sample request

Have a question?

User Profile

Don’t settle for less – trust Mitul to help you find the best solution.

Report delivery within 24 to 48 hours

– Other Info –

What people say?-

User Review

I am very impressed with the information in this report. The author clearly did their research when they came up with this product and it has already given me a lot of ideas.

Jana Schmidt
CEDAR CX Technologies

– Connect with us –

Phone

+91 6232 49 3207


support

24/7 Research Support


sales@credenceresearch.com

– Research Methodology –

Going beyond the basics: advanced techniques in research methodology

– Trusted By –

Pepshi, LG, Nestle
Motorola, Honeywell, Johnson and johnson
LG Chem, SIEMENS, Pfizer
Unilever, Samsonite, QIAGEN