
Market Overview
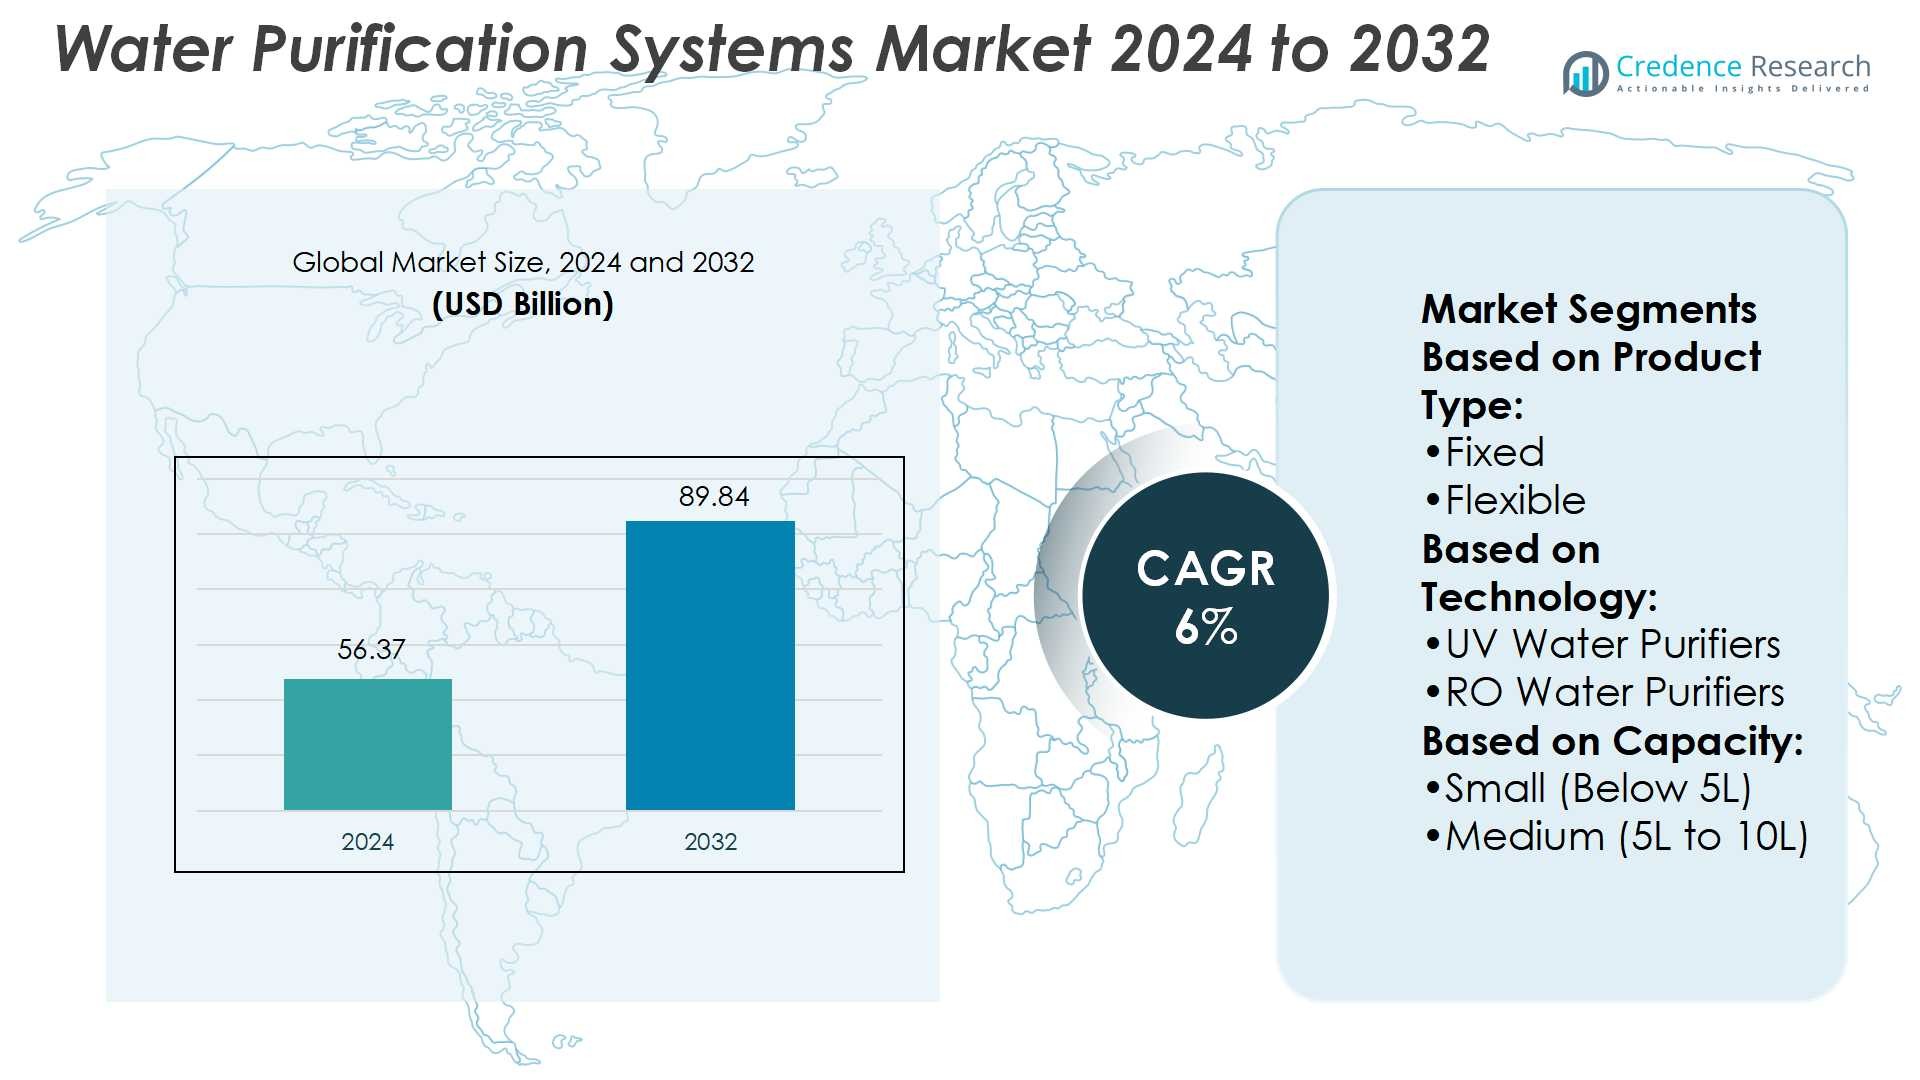
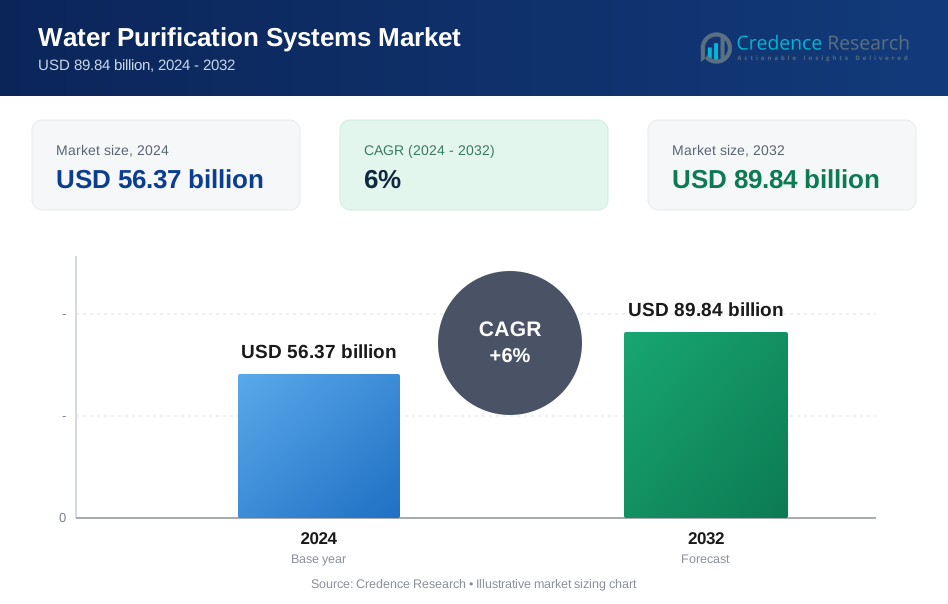
Water Purification Systems Market size was valued USD 56.37 billion in 2024 and is anticipated to reach USD 89.84 billion by 2032, at a CAGR of 6% during the forecast period.
| REPORT ATTRIBUTE | DETAILS |
|---|---|
| Historical Period | 2020-2023 |
| Base Year | 2024 |
| Forecast Period | 2025-2032 |
| Water Purification Systems Market Size 2024 | USD 56.37 Billion |
| Water Purification Systems Market, CAGR | 6% |
| Water Purification Systems Market Size 2032 | USD 89.84 Billion |
The water purification systems market is shaped by top players such as Honeywell International Inc., Kent RO Systems Ltd., A.O. Smith Corporation, LG Electronics, Brita LP, Aquatech International LLC, Culligan International Company, iSpring Water Systems LLC, Helen of Troy Limited, and APEC Water Systems. These companies compete through product innovation, smart technologies, and sustainable purification solutions catering to residential, commercial, and industrial users. Strategic partnerships and global expansions further strengthen their market presence. Regionally, North America leads the market with a 34% share, driven by strict water quality regulations, high consumer awareness, and strong adoption of premium purification systems across households, healthcare facilities, and commercial establishments.
Market Insights
- The Water Purification Systems Market was valued at USD 56.37 billion in 2024 and is projected to reach USD 89.84 billion by 2032, growing at a CAGR of 6%.
- Increasing awareness of waterborne diseases and stricter regulations on water quality drive adoption across residential, commercial, and industrial sectors.
- Smart and eco-friendly purification systems, including IoT-enabled RO and UV technologies, are emerging as key trends, boosting demand for efficient and sustainable solutions.
- The market is highly competitive with leading players focusing on product innovation, strategic partnerships, and global expansion to strengthen their presence.
- North America holds a 34% share, maintaining leadership through regulatory enforcement and premium adoption, while RO technology dominates with the largest segment share due to its effectiveness in removing contaminants.
Market Segmentation Analysis:
By Product Type
The product type segment includes fixed and flexible water purification systems. Fixed systems hold the dominant share due to their higher efficiency, long service life, and suitability for residential and commercial spaces. Consumers prefer fixed units for consistent water quality and integration with plumbing systems. Rising awareness of health and safety standards further drives demand for fixed systems. Flexible systems continue to grow but remain secondary, as they are often chosen for temporary or portable uses rather than long-term household or industrial applications.
- For instance, Honeywell’s HWP2013W table-top purifier removes 99.97% of bacteria (like E. coli, Pseudomonas aeruginosa) and 99.97% of toxic heavy metals (lead, chromium, arsenic) with its filters lasting 317 gallons (~4 months) under typical use.
By Technology
Among UV, RO, and gravity water purifiers, RO water purifiers lead the segment with the largest market share. Their dominance is driven by the ability to remove dissolved salts, heavy metals, and impurities, ensuring safe drinking water. Growing urbanization and rising concerns over groundwater contamination have increased the adoption of RO systems. UV purifiers follow, valued for their effectiveness against microbial contamination. Gravity purifiers remain popular in rural areas with low electricity access, but they contribute a smaller share compared to RO systems in the global market.
- For instance, Kent’s “Zero Water Wastage Technology” pushes back rejected water into the overhead tank using an internal pump, achieving a recovery rate of 50 % (i.e. half of intake becomes purified water) rather than traditional rates where much more is rejected.
By Capacity
In the capacity segment, medium-sized systems (5L to 10L) dominate the market. This sub-segment accounts for the largest share due to widespread household adoption, balancing storage needs and affordability. Families prefer medium-capacity units as they are compact yet sufficient for daily water consumption. Small systems below 5L are popular among individuals or small households but have limited demand. High-capacity units above 10L serve large households, offices, and institutions, showing growth potential in commercial applications but still holding a smaller share compared to medium systems.
Key Growth Drivers
Rising Demand for Safe Drinking Water
Urbanization and industrial growth have increased water contamination risks, driving demand for purification systems. Consumers prioritize clean water to avoid health issues caused by bacteria, viruses, and heavy metals. Governments also promote adoption through initiatives ensuring access to potable water. Rapid awareness of waterborne diseases strengthens this driver, particularly in developing nations with limited safe water infrastructure. As a result, residential and commercial users invest heavily in advanced purifiers, making this a strong factor in market expansion.
- For instance, A.O. Smith’s S600 Tankless RO delivers a filtration capacity of 600 gallons per day (≈ 1.5 L/min) using Side-Stream RO 2.0 membrane, enhancing water recovery.
Technological Advancements in Filtration Systems
Continuous innovation in purification technologies significantly boosts market growth. Advanced RO, UV, and gravity-based systems provide higher efficiency, compact designs, and longer filter lifespans. Smart purifiers with IoT connectivity enable remote monitoring and timely maintenance alerts. These innovations improve user convenience while reducing operational costs. Industrial and municipal sectors adopt advanced systems to meet strict quality standards. Such technological progress enhances competitiveness and strengthens global adoption across both developed and emerging markets.
- For instance, model WW155NPB has an 8-litre dual-protection stainless steel tank, an “in-tank UV” cycle that runs every 6 hours to prevent bacterial growth, and a warranty of 10 years on the steel tank.
Supportive Regulations and Government Programs
Stringent regulations on water quality drive adoption of purification systems worldwide. Governments enforce standards for drinking water safety in residential, healthcare, and commercial sectors. Subsidies and public health programs also promote awareness and installation of affordable systems. For instance, rural development schemes often include water purification units to improve community health. Regulations targeting industrial wastewater treatment further expand opportunities. These policy frameworks create a sustainable demand base, ensuring continuous growth of the water purification systems market.
Key Trends & Opportunities
Integration of Smart and Connected Features
IoT-enabled purifiers are emerging as a strong trend, offering real-time water quality monitoring and predictive maintenance. Consumers value convenience features like mobile app control and filter replacement alerts. Manufacturers leverage these technologies to build premium offerings that differentiate them in competitive markets. The smart purifier segment also creates opportunities in urban areas with rising adoption of connected home solutions.
- For instance, Brita Hub™ countertop system includes a filter that lasts up to 6 months and processes up to 120 gallons before needing replacement; its design offers electronic reminders for filter change.
Shift Toward Eco-Friendly and Sustainable Systems
Growing environmental concerns push demand for energy-efficient and low-waste purifiers. Companies develop eco-friendly RO systems that minimize water wastage, while gravity-based models require no electricity. Consumers in developed regions prefer sustainable solutions that align with green living practices. This trend creates opportunities for companies to innovate in recyclable filters and low-carbon technologies.
- For instance, Culligan’s Aquasential® Smart RO Drinking Water System delivers 75 gallons per day production and operates with a recovery rate of 52.8%. The system uses a 3-gallon storage tank and works at inlet water temperatures between 33-100 °F.
Expansion in Emerging Economies
Rising disposable incomes and urban infrastructure development in Asia-Pacific, Africa, and Latin America create vast opportunities. Households increasingly adopt purifiers due to greater awareness of waterborne diseases. Governments in these regions actively fund clean water projects, opening long-term growth prospects. Companies that provide affordable yet reliable systems stand to gain significantly.
Key Challenges
High Maintenance and Operational Costs
Advanced purification systems require frequent filter replacements and regular servicing. These recurring costs discourage adoption, especially in price-sensitive markets. Industrial and residential users often perceive maintenance as a financial burden, limiting long-term usage. Companies must balance technology advancement with affordability to overcome this challenge.
Limited Access in Rural Areas
Rural populations often lack awareness and purchasing power for advanced purification systems. Poor infrastructure, low income, and limited distribution channels hinder adoption in remote regions. Despite government efforts, penetration remains low compared to urban centers. Bridging this gap requires targeted strategies and cost-effective product designs.
Regional Analysis
North America
North America leads the water purification systems market with a 34% share in 2024, supported by strong consumer awareness and advanced infrastructure. Strict regulatory standards, such as those from the Environmental Protection Agency (EPA), drive adoption in residential, commercial, and industrial sectors. Increasing demand for smart and eco-friendly purifiers further fuels growth, particularly in urban households and healthcare facilities. High disposable incomes and a mature distribution network also strengthen regional leadership. Ongoing technological advancements and premium product adoption continue to maintain North America’s dominance throughout the forecast period.
Europe
Europe holds a 28% market share, driven by stringent EU water safety directives and sustainability goals. Consumers prioritize eco-friendly purification systems with low energy consumption and minimal water wastage. Demand is strong across residential and commercial applications, supported by rising concerns over aging water infrastructure. Countries like Germany, France, and the UK lead adoption, particularly in urban centers. The growing trend of connected and IoT-enabled purifiers also supports regional expansion. With continued emphasis on green technologies, Europe remains a major market for innovative and sustainable water purification solutions.
Asia-Pacific
Asia-Pacific accounts for 25% of the market share and represents the fastest-growing region. Rapid urbanization, population growth, and rising health awareness fuel high demand across China, India, and Southeast Asia. Government initiatives for clean drinking water access and rising disposable incomes accelerate adoption in both rural and urban areas. The region shows strong demand for affordable RO and gravity-based purifiers, while premium smart systems are gaining traction in metropolitan cities. Increasing investment from global players and expanding retail networks further strengthen Asia-Pacific’s growth prospects in the forecast period.
Latin America
Latin America contributes 7% of the global market share, with demand concentrated in Brazil, Mexico, and Argentina. Rising concerns about waterborne diseases and growing urban populations drive the adoption of purification systems. Government-led initiatives and health awareness programs boost residential uptake. However, price sensitivity remains a key factor, pushing demand for affordable gravity-based and compact purifiers. Industrial and commercial applications are also expanding, particularly in food and beverage sectors. As infrastructure improves and disposable incomes rise, Latin America is expected to show steady growth in the water purification systems market.
Middle East & Africa
The Middle East & Africa region holds a 6% market share, primarily driven by water scarcity and dependence on desalinated sources. Countries like Saudi Arabia, UAE, and South Africa lead adoption due to limited access to naturally safe water. Growing residential demand and infrastructure development projects increase reliance on advanced purification systems. Governments actively invest in clean water programs, creating opportunities for technology providers. However, affordability challenges limit penetration in rural areas. With urbanization and public health campaigns expanding, the region is projected to experience gradual yet sustained growth.
Market Segmentations:
By Product Type:
- Fixed
- Flexible
By Technology:
- UV Water Purifiers
- RO Water Purifiers
By Capacity:
- Small (Below 5L)
- Medium (5L to 10L)
By Geography
- North America
- U.S.
- Canada
- Europe
- Germany
- France
- Italy
- U.K.
- Russia
- Rest of Europe
- Asia-Pacific
- India
- China
- Japan
- Rest of Asia-Pacific
- Latin America
- Brazil
- Mexico
- Rest of Latin America
- Middle East and Africa
- GCC Countries
- South Africa
- Rest of Middle East and Africa
Competitive Landscape
The water purification systems market is highly competitive, with leading players including Honeywell International Inc., Kent RO Systems Ltd., A.O. Smith Corporation, LG Electronics, Brita LP, Aquatech International LLC, Culligan International Company, iSpring Water Systems LLC, Helen of Troy Limited, and APEC Water Systems. The water purification systems market remains highly competitive, driven by continuous technological innovation and expanding consumer demand. Companies focus on developing advanced RO, UV, and smart-connected systems that provide higher efficiency, convenience, and sustainability. Strong emphasis is placed on eco-friendly designs, such as low-waste RO units and energy-efficient purifiers, to meet growing environmental regulations and consumer preferences. Market competition is also shaped by strategic partnerships, mergers, and expansions into emerging economies where demand for affordable solutions is rising. With rising health awareness and regulatory support, the competitive landscape continues to evolve toward innovation, accessibility, and long-term sustainability.
Key Player Analysis
- Honeywell International Inc.
- Kent RO Systems Ltd.
- O. Smith Corporation
- LG Electronics
- Brita LP
- Aquatech International LLC
- Culligan International Company
- iSpring Water Systems LLC
- Helen of Troy Limited
- APEC Water Systems
Recent Developments
- In May 2025, JIMMY launches R9 Countertop RO water purifier. It is designed as the perfect gift, JIMMY R9 shows appreciation for everything moms do, bringing heartfelt wishes into their daily routines.
- In May 2025, SK Magic unveiled a limited edition collaboration product, the 'SK Magic X PSG ultra-compact direct water purifier,' with the world-renowned football club Paris Saint-Germain FC (PSG).
- In January 2025, VIOMI launched two Composite Water Purifiers, Vortex 8 and Kunlun, during CES 2025. Vortex 8, which can be found on Amazon now, employs cutting-edge reverse osmosis (RO) with filtering accuracy of 0.0001-microns.
- In July 2024, Unilever reached an agreement to sell its water purification division, Pureit, to A. O. Smith, a prominent player in global water technology. Pureit provides diverse water purification solutions in countries including India, Bangladesh, Sri Lanka, Vietnam, and Mexico.
Report Coverage
The research report offers an in-depth analysis based on Product Type, Technology, Capacity and Geography. It details leading market players, providing an overview of their business, product offerings, investments, revenue streams, and key applications. Additionally, the report includes insights into the competitive environment, SWOT analysis, current market trends, as well as the primary drivers and constraints. Furthermore, it discusses various factors that have driven market expansion in recent years. The report also explores market dynamics, regulatory scenarios, and technological advancements that are shaping the industry. It assesses the impact of external factors and global economic changes on market growth. Lastly, it provides strategic recommendations for new entrants and established companies to navigate the complexities of the market.
Future Outlook
- The market will expand with rising global awareness of waterborne diseases.
- Smart and IoT-enabled purifiers will gain strong consumer adoption.
- Eco-friendly purification systems will dominate due to sustainability regulations.
- Emerging economies will drive significant demand for affordable solutions.
- Industrial and municipal adoption will rise with stricter wastewater norms.
- Premium product demand will increase in urban and high-income regions.
- Technological advances will enhance efficiency and reduce maintenance costs.
- Online sales channels will strengthen market reach and accessibility.
- Government clean water initiatives will create stable growth opportunities.
- Competitive intensity will increase as global and regional players expand.
Request a Free Sample
Fill in your details and we'll send you a free sample report.
- Sample data tables & charts
- Research methodology
Need a Custom Version of This Report?
Tailor the scope, geography, or segments to your exact requirements.
- Custom geography or segment scope
- Direct access to our analyst team
Frequently Asked Questions
What is the current market size for Water Purification Systems Market, and what is its projected size in 2032?
At what Compound Annual Growth Rate is the Water Purification Systems Market projected to grow between 2025 and 2032?
Which Water Purification Systems Market segment held the largest share in 2024?
What are the primary factors fueling the growth of the Water Purification Systems Market?
Who are the leading companies in the Water Purification Systems Market?
Which region commanded the largest share of the Water Purification Systems Market in 2024?
Table of Content
Chapter 1. Report Introduction
- 1.1 Report Description & Purpose
- 1.1.1 Report Title & Market Definition
- 1.1.2 Unique Selling Propositions (USP) & Key Differentiators
- 1.1.3 Value Proposition for Stakeholders
- 1.2 Research Objectives
- 1.2.1 Market Sizing Objectives (Volume & Revenue)
- 1.2.2 Segmentation Objectives
- 1.2.3 Competitive Intelligence Objectives
- 1.2.4 Forecast & Scenario Objectives
- 1.3 Report Scope
- 1.3.1 Water Purification Systems Scope – Types & Subtypes Covered
- 1.3.2 Geographic Scope – Regions & Countries Covered
- 1.3.3 Historical Period, Base Year & Forecast Period (2024; forecast to 2032)
- 1.3.4 Inclusions & Exclusions
- 1.4 HS Code & Classification Framework
- 1.5 Currency, Units & Pricing Basis
- 1.6 Target Stakeholders
- 1.7 Limitations & Assumptions
Chapter 2. Executive Summary
- 2.1 Global Water Purification Systems Market Snapshot
- 2.1.1 Market Size – Historical (2024) & Forecast (2024-2032) (2024: USD 56.37 billion → 2032: USD 89.84 billion)
- 2.1.2 Volume & Revenue – Global Totals
- 2.1.3 Key Market Highlights – Top Five Facts
- 2.2 Water Purification Systems Market Segmentation Snapshot
- 2.2.1 Market Split by Region – 2024 vs. 2032
- 2.3 Competitive Snapshot
- 2.3.1 Top 10 Players by Revenue Share – 2024
- 2.3.2 Top 10 Players by Volume Share – 2024
- 2.3.3 Recent Strategic Developments (18-Month Summary)
- 2.4 Key Investment Highlights & Strategic Conclusions
Chapter 3. Water Purification Systems Market Dynamics & Industry Analysis
- 3.1 Market Overview & Context
- 3.1.1 Water Purification Systems Market Position in the Broader Automotive Value Chain
- 3.1.2 OEM vs. Replacement Market Dynamics
- 3.1.3 Market Maturity & Development Stage by Region
- 3.2 Water Purification Systems Market Drivers
- 3.3 Water Purification Systems Market Restraints & Challenges
- 3.4 Water Purification Systems Market Opportunities
- 3.5 Porter's Five Forces Analysis
- 3.5.1 Threat of New Entrants
- 3.5.2 Bargaining Power of Suppliers
- 3.5.3 Bargaining Power of Buyers
- 3.5.4 Threat of Substitutes
- 3.5.5 Competitive Rivalry – Intensity Assessment
- 3.6 Water Purification Systems Value Chain Analysis
- 3.6.1 Upstream – Raw Material/Input Suppliers
- 3.6.1.1 Raw Material/Input 1
- 3.6.1.2 Raw Material/Input 2
- 3.6.1.3 Raw Material/Input 3
- 3.6.2 Midstream – Production/Manufacturing/Service Delivery
- 3.6.2.1 Production/Process Overview
- 3.6.2.2 Key Facility Locations & Capacity by Manufacturer
- 3.6.3 Downstream – Distribution & End Consumer
- 3.6.3.1 Primary Channel – B2B/OEM
- 3.6.3.2 Secondary Channels – Dealer, Retail, Online, Direct
- 3.6.4 Value Chain Profitability Analysis
- 3.6.1 Upstream – Raw Material/Input Suppliers
- 3.7 PESTEL Analysis
- 3.7.1 Political Factors
- 3.7.2 Economic Factors
- 3.7.3 Social Factors
- 3.7.4 Technological Factors
- 3.7.5 Environmental Factors
- 3.7.6 Legal Factors
- 3.8 Water Purification Systems Supply Chain Analysis
- 3.8.1 Raw Material/Input Supply Risk Assessment
- 3.8.2 Manufacturing Concentration Risk (Geographic Exposure)
- 3.8.3 Trade Disruption Impact Analysis
- 3.9 Regulatory & Policy Landscape
Note: The regulatory and policy landscape section covers regulations based on their applicability to the market, Water Purification Systems category, geography, and scope of the study. Only regulatory frameworks with a material impact on operations, compliance, trade, sustainability, or market access are analyzed in detail.
Chapter 4. Key Investment Pockets & Opportunity Analysis
- 4.1 Water Purification Systems Market Attractiveness Analysis
- 4.1.1 By Region – Investment Attractiveness Matrix (Volume × CAGR)
- 4.2 Absolute Revenue Growth Opportunity
- 4.2.1 By Region – Absolute USD Growth Through 2032
- 4.3 Incremental Volume Opportunity
- 4.3.1 By Region – Incremental Volume Through 2032
- 4.3.2 Segment – Incremental Volume
- 4.4 Emerging Submarket Opportunity Deep Dive (Subject to Applicability)
- 4.5 Emerging Market Opportunity Scorecards
- 4.5.1 United States
- 4.5.2 Europe
- 4.5.3 Asia
- 4.5.4 Middle East & Africa
Note: Emerging Market Opportunity Scorecards will be included based on relevance and strategic importance. Regions listed are indicative and may vary depending on data availability and market dynamics.
Chapter 5. Water Purification Systems Import-Export Analysis & Trade Flows
- 5.1 Global Trade Overview
- 5.1.1 Global Export Value by Country (2024)
- 5.1.2 Global Export Volume by Country (2024)
- 5.1.3 Global Import Value by Country (2024)
- 5.1.4 Global Import Volume by Country (2024)
- 5.1.5 Net Trade Balance by Country (2024)
- 5.2 Export Analysis – Segment
- 5.2.1 Type 1 (HS Code)
- 5.2.2 Type 2 (HS Code)
- 5.2.3 Type 3 (HS Code)
- 5.2.4 Type 4 (HS Code)
- 5.2.5 Type 5 (HS Code)
- 5.3 Import Analysis – Segment
- 5.3.1 Type 1 (HS Code)
- 5.3.2 Type 2 (HS Code)
- 5.3.3 Type 3 (HS Code)
- 5.3.4 Type 4 (HS Code)
- 5.3.5 Type 5 (HS Code)
- 5.4 Average Unit Trade Prices
- 5.4.1 Average Export Price – Segment & Country
- 5.4.2 Average Import Price – Segment & Source Country
- 5.4.3 Price Trends (2024)
- 5.5 Key Trade Route Analysis
- 5.5.1 Trade Route 1
- 5.5.2 Trade Route 2
- 5.5.3 Trade Route 3
- 5.5.4 Trade Route 4
- 5.5.5 Trade Route 5
- 5.6 Trade Policy Impact Assessment
- 5.6.1 US Anti-Dumping & Section 301 Tariffs
- 5.6.2 EU Customs Union Impact
- 5.6.3 Major Free Trade Agreements
- 5.6.4 USMCA Rules of Origin
Note: Trade policy analysis will be included only where relevant to the Water Purification Systems market.
Chapter 6. Competitive Landscape & Company Benchmarking
- 6.1 Water Purification Systems Market Concentration & Structure
- 6.1.1 Herfindahl-Hirschman Index (HHI) – vs. 2024
- 6.1.2 Tier 1, Tier 2 & Tier 3 Market Structure
- 6.1.3 Global, Regional & Local Player Dynamics
- 6.2 Water Purification Systems Market Share Analysis – 2024
- 6.2.1 Global Revenue Share by Company
- 6.2.2 Global Volume Share by Company
- 6.2.3 Regional Revenue Share
- 6.2.4 Market Share Evolution ( vs. 2024)
- 6.2.5 OEM Segment Share by Company
- 6.2.6 Replacement Segment Share by Company
- 6.3 Production/Delivery Capacity & Facility Analysis
- 6.3.1 Global Installed Capacity
- 6.3.2 Capacity Utilization Rates
- 6.3.3 Production/Output Volume
- 6.3.4 Facility Locations & Capacity Map
- 6.3.5 Planned Capacity Additions
- 6.4 Water Purification Systems Competitive Benchmarking Matrix
- 6.4.1 Revenue, Volume, CAGR & Profitability Comparison
- 6.4.2 Channel Revenue Mix
- 6.4.3 Geographic Revenue Exposure
- 6.4.4 R&D Intensity
- 6.4.5 Sustainability Maturity
- 6.5 Strategic Developments in Water Purification Systems (Last 24 Months)
- 6.5.1 Mergers, Acquisitions & Divestments
- 6.5.2 New Water Purification Systems Launches
- 6.5.3 Facility Expansions
- 6.5.4 Strategic Alliances, Joint Ventures & Partnerships
- 6.5.5 Distribution Expansion & Market Entry
- 6.5.6 Sustainability & ESG Initiatives
- 6.6 Competitive Strategy Mapping
- 6.6.1 Leader, Challenger, Follower & Niche Classification
- 6.6.2 Pricing Strategy Comparison
- 6.6.3 Channel Strategy Matrix
Note: Strategic developments are included based on their materiality and the availability of reliable information.
Chapter 7. Global Water Purification Systems Market – By Distribution Channel
- 7.1 Segment Overview
- 7.1.1 Volume & Revenue Split by Channel (2024 & 2032)
- 7.1.2 Channel Mix Evolution (2024-2032)
Chapter 8. Regional Market Analysis – Global Overview
- 8.1 Global Regional Overview
- 8.1.1 Regional Volume Share
- 8.1.2 Regional Revenue Share
- 8.1.3 Regional Volume by Region
- 8.1.4 Regional Revenue by Region
- 8.1.5 Regional Forecast Through 2032
- 8.2 Cross-Regional Segment Analysis
- 8.2.1 By Distribution Channel
- 8.2.2 By Brand/Price Tier
Chapter 9. North America Water Purification Systems Market
- 9.1 United States
- 9.2 Canada
- 9.3 Mexico
Chapter 10. Europe Water Purification Systems Market
- 10.1 Germany
- 10.2 France
- 10.3 Italy
- 10.4 United Kingdom
- 10.5 Spain
- 10.6 Poland
- 10.7 Russia
- 10.8 Netherlands
- 10.9 Belgium
- 10.10 Sweden
- 10.11 Denmark
- 10.12 Norway
- 10.13 Rest of Europe
Chapter 11. Asia Pacific Water Purification Systems Market
- 11.1 China
- 11.2 India
- 11.3 Japan
- 11.4 South Korea
- 11.5 Thailand
- 11.6 Indonesia
- 11.7 Vietnam
- 11.8 Malaysia
- 11.9 Australia
- 11.10 Rest of Asia Pacific
Chapter 12. Latin America Water Purification Systems Market
- 12.1 Brazil
- 12.2 Argentina
- 12.3 Colombia
- 12.4 Chile
- 12.5 Rest of Latin America
Chapter 13. Middle East Water Purification Systems Market
- 13.1 Saudi Arabia
- 13.2 United Arab Emirates
- 13.3 Turkey
- 13.4 Israel
- 13.5 Iran
- 13.6 Rest of the Middle East
Chapter 14. Africa Water Purification Systems Market
- 14.1 South Africa
- 14.2 Egypt
- 14.3 Nigeria
- 14.4 Morocco
- 14.5 Rest of Africa
Chapter 15. Water Purification Systems Company Profiles
- 15.1 [Company 01]
- 15.1.1 Company Overview
- 15.1.2 Key Management Personnel
- 15.1.3 Products & Services Portfolio
- 15.1.4 Financial Performance
- 15.1.5 Key Market Focus & Geographic Presence
- 15.1.6 Recent Developments & Strategic Initiatives
Note: The company profile list is preliminary and may change based on research findings, market developments, data availability, and client requirements.
Chapter 16. Appendices
- Appendix A – List of Abbreviations & Acronyms
- Appendix B – Industry Classification Code Reference – Full Series
- Appendix C – Production & Capacity Data Tables
- Appendix D – End-Use & Demand Base Tables
- Appendix E – Consumption & Replacement Rate Assumptions
- Appendix F – ASP Reference Tables
- Appendix G – Manufacturing & Facility Database
- Appendix H – Import-Export Data Tables
- Appendix I – Regulatory Summary Tables
- Appendix J – Primary Research Participant List (Anonymized)
- Appendix K – Primary Research Questionnaire Framework
- Appendix L – Data Sources & Bibliography
- Appendix M – Market Size Divergence & Source Comparison
Chapter 17. Research Methodology
- 17.1 Research Framework & Philosophy
- 17.2 Secondary Research – Sources, Hierarchy & Data Extraction
- 17.3 Data Modeling – Bottom-Up & Top-Down Market Sizing
- 17.4 Primary Research – Stakeholder Framework, LOI & Sample Sizes
- 17.5 Forecast Methodology – Regression, Scenario & Sensitivity Analysis
- 17.6 Quality Control – Four-Layer Validation Framework
- 17.7 Limitations & Standard Assumptions
- 17.8 Disclaimer
