
Market Overview:
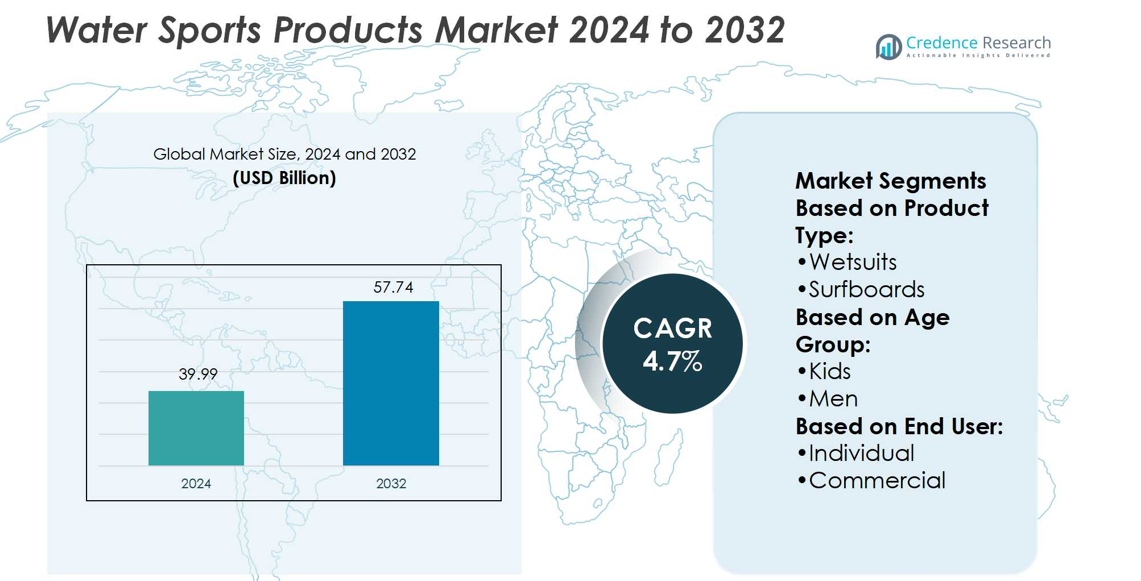
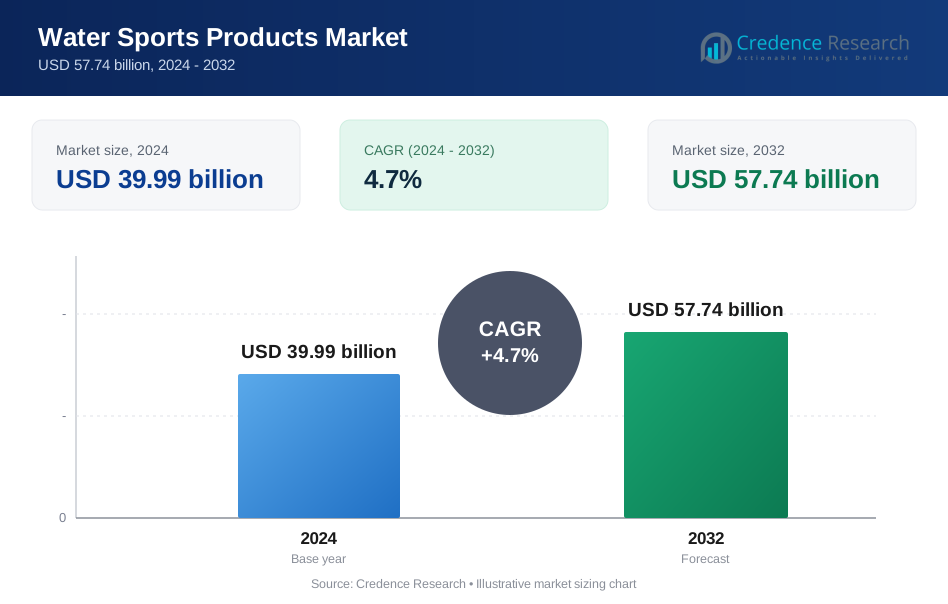
Water Sports Products Market size was valued i n 2024 and is anticipated to reach USD 57.74 billion by 2032, at a CAGR of 4.7% during the forecast period.
| REPORT ATTRIBUTE | DETAILS |
|---|---|
| Historical Period | 2020-2023 |
| Base Year | 2024 |
| Forecast Period | 2025-2032 |
| Water Sports Products Market Size 2024 | USD 39.99 billion |
| Water Sports Products Market, CAGR | 4.7% |
| Water Sports Products Market Size 2032 | USD 57.74 billion |
The water sports products market is shaped by prominent players such as Naish International, Aqua Lung International, Hurley, Cressi, Body Glove, Hobie Cat Company, Mares, Airhead Sports Group, Beuchat, and Liquid Force. These companies focus on innovation, sustainability, and global distribution to maintain competitiveness across product categories including surfboards, wetsuits, diving gear, and recreational equipment. North America leads the global market with a 37% share, supported by strong consumer participation, advanced tourism infrastructure, and a robust retail network. The region’s leadership is reinforced by continuous product upgrades, high disposable incomes, and cultural engagement with water-based recreational activities.
Market Insights
- The Water Sports Products Market was valued at USD 39.99 billion in 2024 and will reach USD 57.74 billion by 2032, growing at a CAGR of 4.7%.
- Market growth is driven by rising adventure tourism, fitness awareness, and demand for eco-friendly surfboards, wetsuits, and diving gear.
- Trends include the adoption of sustainable materials, digital engagement strategies, and expansion of rental models through surf schools and resorts.
- Competitive intensity remains high, with key players focusing on innovation and global distribution to strengthen their product portfolios.
- North America holds a 37% market share, leading due to strong tourism infrastructure, while surfboards dominate the product segment with 34% share, supported by recreational and professional adoption.
Market Segmentation Analysis:
By Product Type
In the water sports products market, surfboards dominate with a 34% share. Their leadership is driven by the rising popularity of recreational surfing, coastal tourism, and international surfing competitions. Wetsuits follow closely, supported by demand in colder regions where thermal protection is essential. The growth of wakeboarding and water skiing also supports demand for specialized boards and gear, yet these remain niche compared to surfboards. Continuous innovation in lightweight and durable materials has strengthened surfboard adoption across both professional and leisure users, reinforcing its dominant position in this segment.
- For instance, Aqualung Super Stretch / AquaFlex neoprene is said to have three times the stretch of standard neoprene. The Solaflex semi-dry suit uses 8 mm neoprene in torso and 7 mm in legs and arms.
By Age Group
Men represent the leading segment in the water sports products market, holding a 46% share. The dominance is attributed to higher participation in competitive and recreational surfing, wakeboarding, and water skiing. Women’s segment is growing rapidly, supported by increasing involvement in wellness-driven water activities and female-focused product lines. Kids’ products account for a smaller share but gain traction through surf schools, camps, and family-driven sports adoption. The market’s expansion is encouraged by brands offering age-specific sizing, safety gear, and inclusive campaigns, further widening accessibility and fueling demand across all demographics.
- For instance, Asahi Kasei the company confirmed that prototype cylindrical cells using this electrolyte demonstrated high power at a low temperature of –40 °C, and double the cycle life at a high temperature of 60 °C compared to conventional electrolytes.
By End User
The individual end-user segment leads the water sports products market with a 63% share. Its dominance is supported by personal ownership of surfboards, wetsuits, and other accessories driven by lifestyle preferences and rising outdoor recreation. Commercial end-users, including surf schools, resorts, and water sports clubs, contribute notably through bulk purchases and rental services. Growth in coastal tourism destinations continues to strengthen this segment. However, individual buyers maintain a stronger presence, as increasing disposable income, adventure tourism, and fitness awareness drive direct consumer demand for water sports products.
Market Overview
Rising Popularity of Adventure Tourism
The growing appeal of adventure tourism acts as a major driver for the water sports products market. Surfing, wakeboarding, and water skiing are increasingly sought after by travelers seeking unique recreational experiences. Expanding coastal tourism infrastructure and promotional campaigns by governments further stimulate demand. International sporting events and water festivals have also boosted participation rates. This rising tourism wave encourages higher purchases of surfboards, wetsuits, and related gear, thereby accelerating the overall growth of the water sports products industry.
- For instance, Body Glove offers its Phoenix hooded fullsuit in 5.5/4.5 mm thickness, designed for men to maintain core warmth. Women’s segment is growing rapidly, supported by increasing involvement in wellness-driven water activities and female-focused product lines.
Increasing Health and Fitness Awareness
Consumers increasingly view water sports as both fitness activity and lifestyle choice. Activities like surfing and wakeboarding offer full-body workouts, aligning with the global shift toward wellness and active living. Rising awareness of obesity and sedentary risks supports the adoption of outdoor recreational sports. Fitness-conscious individuals, especially younger demographics, drive sales of performance-oriented products. Manufacturers are introducing advanced wetsuits and surfboards tailored to enhance agility and stamina, directly tapping into this fitness-driven consumer base and strengthening market growth.
- For instance, Hobie’s Apex 4R SUP, in the 12'6" length, features a hull volume of 227.2 liters and a weight of 23 lbs / 10.43 kg. The board uses a BCX4R molded construction to optimize the strength-to-weight ratio for speed and stamina.
Product Innovation and Material Advancements
Continuous innovation in product design and materials significantly drives market expansion. Lightweight carbon fiber surfboards, eco-friendly wetsuits, and improved water skis provide enhanced performance and durability. Many brands invest in sustainable alternatives, such as neoprene-free wetsuits and recyclable surfboard materials, aligning with consumer preference for eco-friendly solutions. Integration of smart features, like performance trackers, adds appeal among professional athletes. These technological and material innovations not only enhance safety and comfort but also broaden consumer interest, securing long-term growth opportunities in the market.
Key Trends & Opportunities
Sustainability and Eco-Friendly Products
Eco-conscious consumer behavior is shaping the future of the water sports products market. Demand for recyclable, biodegradable, and non-toxic materials in surfboards, wetsuits, and water skis continues to rise. Brands adopting sustainable production practices gain a competitive edge by aligning with global environmental initiatives. Partnerships with marine conservation organizations further boost brand loyalty. This growing preference for green alternatives provides opportunities for companies to expand product portfolios, strengthen consumer trust, and position themselves as leaders in the sustainable sports equipment space.
- For instance, Mares offers the Pro Therm 8/7 men’s wetsuit with 8 mm neoprene core in key zones and 7 mm panels in high-mobility areas, reducing material bulk while still delivering thermal protection.
Expansion of Rental and Sharing Models
The increasing presence of rental services and water sports clubs creates new opportunities for market players. Tourists and beginners often prefer renting over purchasing, especially in surf schools and coastal resorts. This model expands access to high-quality products while promoting trial usage among new participants. Companies can leverage this trend by partnering with hospitality providers and tourism agencies to supply bulk equipment. The expansion of rental-based models not only generates recurring revenue but also enhances brand visibility in global tourism hubs.
- For instance, Airhead’s Mach 3 towable tube measures 107″ in length, 75″ in width, and weighs 33.9 pounds, supporting up to 510 pounds of rider weight. This model expands access to high-quality products while promoting trial usage among new participants.
Key Challenges
High Equipment Costs
The elevated cost of premium water sports products limits adoption, particularly among casual participants. Advanced surfboards, performance wetsuits, and specialized skis often come at high price points due to expensive materials and manufacturing processes. This cost barrier restricts access for middle-income consumers and creates dependence on rental models. Manufacturers face the challenge of balancing affordability with quality while maintaining margins. Without cost optimization, the market risks slower penetration in emerging regions where disposable income levels remain limited.
Seasonality and Weather Dependence
The water sports products market remains highly dependent on seasonal and climatic conditions. Participation peaks during favorable weather but declines significantly in colder months or regions with limited coastlines. Unpredictable weather patterns and climate change further disrupt planned sporting events and tourism activities. This seasonal nature reduces steady revenue flows for manufacturers and retailers. To counteract this challenge, companies must diversify offerings, target indoor water sports facilities, and expand into regions with year-round participation opportunities to maintain market resilience.
Regional Analysis
North America
North America leads the water sports products market with a 37% share, supported by strong participation in surfing, wakeboarding, and water skiing. The U.S. dominates due to well-developed coastal infrastructure, extensive water sports clubs, and strong retail channels. Canada contributes through growing adventure tourism and increased participation in recreational sports. Government initiatives promoting outdoor activities and investments in marine safety equipment further strengthen demand. High disposable incomes and strong cultural engagement with outdoor sports ensure North America maintains its leadership, while continuous product innovation attracts both professional athletes and casual consumers.
Europe
Europe holds a 29% share in the water sports products market, driven by its extensive coastline and high engagement in recreational water activities. Countries such as France, Spain, and Portugal act as surfing hubs, while Germany and the UK contribute through strong demand for wetsuits and water skis. The region benefits from established tourism infrastructure and rising interest in eco-friendly sports products. Seasonal demand peaks during summer months, supported by government initiatives for coastal sports. Europe’s cultural emphasis on outdoor recreation and sustainability continues to boost market adoption across both individual and commercial end users.
Asia Pacific
Asia Pacific accounts for a 22% share of the water sports products market and demonstrates the fastest growth potential. Rising disposable incomes, urbanization, and coastal tourism expansion in China, Australia, and Indonesia fuel demand. Surfing and wakeboarding are gaining popularity among younger demographics, supported by promotional events and international competitions. Australia remains a key contributor, with established surfing culture and high product adoption. Local manufacturers are expanding sustainable product offerings, while global brands target emerging economies. The region’s growing middle class, combined with government support for tourism, positions Asia Pacific as a critical growth hub.
Latin America
Latin America holds an 8% share of the water sports products market, with Brazil and Mexico leading adoption. The region benefits from vibrant coastal tourism and rising interest in surfing and recreational sports among younger populations. Brazil hosts international surfing events, further boosting surfboard and wetsuit demand. However, limited purchasing power in some countries restrains high-end equipment adoption. Rental services and surf schools play a major role in market expansion, making products accessible to wider audiences. Continued tourism growth and government initiatives to promote sports are expected to support long-term market development in the region.
Middle East & Africa
The Middle East & Africa region accounts for a 4% share in the water sports products market, driven by rising investments in coastal tourism and resort development. The UAE leads with luxury tourism projects that integrate water sports activities, creating strong demand for commercial equipment. Africa shows growing interest in recreational water activities, particularly in South Africa’s surfing hubs. However, limited infrastructure and seasonal challenges constrain wider adoption. Market growth is expected through government-backed tourism campaigns and partnerships with global brands to introduce high-quality products, particularly targeting adventure tourists in key coastal destinations.
Market Segmentations:
By Product Type:
- Wetsuits
- Surfboards
By Age Group:
- Kids
- Men
By End User:
- Individual
- Commercial
By Geography
- North America
- U.S.
- Canada
- Mexico
- Europe
- UK
- France
- Germany
- Italy
- Spain
- Russia
- Belgium
- Netherlands
- Austria
- Sweden
- Poland
- Denmark
- Switzerland
- Rest of Europe
- Asia Pacific
- China
- Japan
- South Korea
- India
- Australia
- Thailand
- Indonesia
- Vietnam
- Malaysia
- Philippines
- Taiwan
- Rest of Asia Pacific
- Latin America
- Brazil
- Argentina
- Peru
- Chile
- Colombia
- Rest of Latin America
- Middle East
- UAE
- KSA
- Israel
- Turkey
- Iran
- Rest of Middle East
- Africa
- Egypt
- Nigeria
- Algeria
- Morocco
- Rest of Africa
Competitive Landscape
The Water Sports Products Market players such as Naish International, Aqua Lung International, Hurley, Cressi, Body Glove, Hobie Cat Company, Mares, Airhead Sports Group, Beuchat, and Liquid Force. The competitive landscape of the water sports products market is defined by continuous innovation, brand differentiation, and expanding global reach. Companies focus on developing lightweight, durable, and eco-friendly equipment to meet the growing demand from both professional athletes and recreational users. Strategic partnerships with tourism operators, surf schools, and resorts help strengthen market presence, while rental models broaden accessibility in emerging regions. Marketing strategies emphasize lifestyle appeal and wellness benefits, attracting younger demographics. Sustainability, performance enhancement, and digital engagement remain central competitive factors, ensuring strong competition and driving further product diversification across the market.
Key Player Analysis
- Naish International
- Aqua Lung International
- Hurley
- Cressi
- Body Glove
- Hobie Cat Company
- Mares
- Airhead Sports Group
- Beuchat
- Liquid Force
Recent Developments
- In May 2025, Samsung Engineering & Architecture (Samsung E&A), a global energy solutions provider, has announced the launch of CompassH2, a next-generation green hydrogen production platform developed in partnership with Norwegian electrolyser leader Nel.
- In January 2025, Speedo unveiled the Vanquisher goggle, the Vanquisher 3.0. The advanced addition to Speedo's unparalleled goggle line is available for purchase. The Vanquisher 3.0 is the latest evolution of Speedo's No.1 training & racing goggles, empowering swimmers to train longer, stronger, and better than ever.
- In April 2024, Aqualung Group successfully solved its historic snorkeling brand, US Diver, to a California-based company, Aqua Master Sporting Technology Co LLC.
- In March 2024, Bote, LLC, a U.S.-based water sports gear company, launched a line of Rider Series paddleboards with three options: EasyRider Aero, LowRider Aero, and FlowRider Aero. These products are marketed as ideal for solo and tandem explorations
Report Coverage
The research report offers an in-depth analysis based on Product Type, Age Group, End-User and Geography. It details leading market players, providing an overview of their business, product offerings, investments, revenue streams, and key applications. Additionally, the report includes insights into the competitive environment, SWOT analysis, current market trends, as well as the primary drivers and constraints. Furthermore, it discusses various factors that have driven market expansion in recent years. The report also explores market dynamics, regulatory scenarios, and technological advancements that are shaping the industry. It assesses the impact of external factors and global economic changes on market growth. Lastly, it provides strategic recommendations for new entrants and established companies to navigate the complexities of the market.
Future Outlook
- The market will expand with rising participation in adventure and recreational water activities.
- Health and fitness awareness will drive greater adoption of water sports equipment.
- Eco-friendly product innovations will gain wider acceptance among environmentally conscious consumers.
- Tourism growth will increase demand for surfboards, wetsuits, and rental services.
- Technological advancements in lightweight and durable materials will enhance product performance.
- Online retail and e-commerce platforms will strengthen product accessibility worldwide.
- Customized products targeting kids and women will capture new consumer segments.
- Collaborations with surf schools and resorts will create recurring revenue streams.
- Seasonal challenges will push companies to diversify into indoor and year-round water sports.
- Growing investments in coastal infrastructure will boost long-term industry opportunities
Request a Free Sample
Fill in your details and we'll send you a free sample report.
- Sample data tables & charts
- Research methodology
Need a Custom Version of This Report?
Tailor the scope, geography, or segments to your exact requirements.
- Custom geography or segment scope
- Direct access to our analyst team
Frequently Asked Questions
What is the current market size for Water Sports Products Market, and what is its projected size in 2032?
At what Compound Annual Growth Rate is the Water Sports Products Market projected to grow between 2025 and 2032?
Which Water Sports Products Market segment held the largest share in 2024?
What are the primary factors fueling the growth of the Water Sports Products Market?
Who are the leading companies in the Water Sports Products Market?
Table of Content
Chapter 1. Report Introduction
- 1.1 Report Description & Purpose
- 1.1.1 Report Title & Market Definition
- 1.1.2 Unique Selling Propositions (USP) & Key Differentiators
- 1.1.3 Value Proposition for Stakeholders
- 1.2 Research Objectives
- 1.2.1 Market Sizing Objectives (Volume & Revenue)
- 1.2.2 Segmentation Objectives
- 1.2.3 Competitive Intelligence Objectives
- 1.2.4 Forecast & Scenario Objectives
- 1.3 Report Scope
- 1.3.1 Water Sports Products Scope – Types & Subtypes Covered
- 1.3.2 Geographic Scope – Regions & Countries Covered
- 1.3.3 Historical Period, Base Year & Forecast Period (2024; forecast to 2032)
- 1.3.4 Inclusions & Exclusions
- 1.4 HS Code & Classification Framework
- 1.5 Currency, Units & Pricing Basis
- 1.6 Target Stakeholders
- 1.7 Limitations & Assumptions
Chapter 2. Executive Summary
- 2.1 Global Water Sports Products Market Snapshot
- 2.1.1 Market Size – Historical (2024) & Forecast (2024-2032) (2024: USD 39.99 billion → 2032: USD 57.74 billion)
- 2.1.2 Volume & Revenue – Global Totals
- 2.1.3 Key Market Highlights – Top Five Facts
- 2.2 Water Sports Products Market Segmentation Snapshot
- 2.2.1 Market Split by Region – 2024 vs. 2032
- 2.3 Competitive Snapshot
- 2.3.1 Top 10 Players by Revenue Share – 2024
- 2.3.2 Top 10 Players by Volume Share – 2024
- 2.3.3 Recent Strategic Developments (18-Month Summary)
- 2.4 Key Investment Highlights & Strategic Conclusions
Chapter 3. Water Sports Products Market Dynamics & Industry Analysis
- 3.1 Market Overview & Context
- 3.1.1 Water Sports Products Market Position in the Broader Automotive Value Chain
- 3.1.2 OEM vs. Replacement Market Dynamics
- 3.1.3 Market Maturity & Development Stage by Region
- 3.2 Water Sports Products Market Drivers
- 3.3 Water Sports Products Market Restraints & Challenges
- 3.4 Water Sports Products Market Opportunities
- 3.5 Porter's Five Forces Analysis
- 3.5.1 Threat of New Entrants
- 3.5.2 Bargaining Power of Suppliers
- 3.5.3 Bargaining Power of Buyers
- 3.5.4 Threat of Substitutes
- 3.5.5 Competitive Rivalry – Intensity Assessment
- 3.6 Water Sports Products Value Chain Analysis
- 3.6.1 Upstream – Raw Material/Input Suppliers
- 3.6.1.1 Raw Material/Input 1
- 3.6.1.2 Raw Material/Input 2
- 3.6.1.3 Raw Material/Input 3
- 3.6.2 Midstream – Production/Manufacturing/Service Delivery
- 3.6.2.1 Production/Process Overview
- 3.6.2.2 Key Facility Locations & Capacity by Manufacturer
- 3.6.3 Downstream – Distribution & End Consumer
- 3.6.3.1 Primary Channel – B2B/OEM
- 3.6.3.2 Secondary Channels – Dealer, Retail, Online, Direct
- 3.6.4 Value Chain Profitability Analysis
- 3.6.1 Upstream – Raw Material/Input Suppliers
- 3.7 PESTEL Analysis
- 3.7.1 Political Factors
- 3.7.2 Economic Factors
- 3.7.3 Social Factors
- 3.7.4 Technological Factors
- 3.7.5 Environmental Factors
- 3.7.6 Legal Factors
- 3.8 Water Sports Products Supply Chain Analysis
- 3.8.1 Raw Material/Input Supply Risk Assessment
- 3.8.2 Manufacturing Concentration Risk (Geographic Exposure)
- 3.8.3 Trade Disruption Impact Analysis
- 3.9 Regulatory & Policy Landscape
Note: The regulatory and policy landscape section covers regulations based on their applicability to the market, Water Sports Products category, geography, and scope of the study. Only regulatory frameworks with a material impact on operations, compliance, trade, sustainability, or market access are analyzed in detail.
Chapter 4. Key Investment Pockets & Opportunity Analysis
- 4.1 Water Sports Products Market Attractiveness Analysis
- 4.1.1 By Region – Investment Attractiveness Matrix (Volume × CAGR)
- 4.2 Absolute Revenue Growth Opportunity
- 4.2.1 By Region – Absolute USD Growth Through 2032
- 4.3 Incremental Volume Opportunity
- 4.3.1 By Region – Incremental Volume Through 2032
- 4.3.2 Segment – Incremental Volume
- 4.4 Emerging Submarket Opportunity Deep Dive (Subject to Applicability)
- 4.5 Emerging Market Opportunity Scorecards
- 4.5.1 United States
- 4.5.2 Europe
- 4.5.3 Asia
- 4.5.4 Middle East & Africa
Note: Emerging Market Opportunity Scorecards will be included based on relevance and strategic importance. Regions listed are indicative and may vary depending on data availability and market dynamics.
Chapter 5. Water Sports Products Import-Export Analysis & Trade Flows
- 5.1 Global Trade Overview
- 5.1.1 Global Export Value by Country (2024)
- 5.1.2 Global Export Volume by Country (2024)
- 5.1.3 Global Import Value by Country (2024)
- 5.1.4 Global Import Volume by Country (2024)
- 5.1.5 Net Trade Balance by Country (2024)
- 5.2 Export Analysis – Segment
- 5.2.1 Type 1 (HS Code)
- 5.2.2 Type 2 (HS Code)
- 5.2.3 Type 3 (HS Code)
- 5.2.4 Type 4 (HS Code)
- 5.2.5 Type 5 (HS Code)
- 5.3 Import Analysis – Segment
- 5.3.1 Type 1 (HS Code)
- 5.3.2 Type 2 (HS Code)
- 5.3.3 Type 3 (HS Code)
- 5.3.4 Type 4 (HS Code)
- 5.3.5 Type 5 (HS Code)
- 5.4 Average Unit Trade Prices
- 5.4.1 Average Export Price – Segment & Country
- 5.4.2 Average Import Price – Segment & Source Country
- 5.4.3 Price Trends (2024)
- 5.5 Key Trade Route Analysis
- 5.5.1 Trade Route 1
- 5.5.2 Trade Route 2
- 5.5.3 Trade Route 3
- 5.5.4 Trade Route 4
- 5.5.5 Trade Route 5
- 5.6 Trade Policy Impact Assessment
- 5.6.1 US Anti-Dumping & Section 301 Tariffs
- 5.6.2 EU Customs Union Impact
- 5.6.3 Major Free Trade Agreements
- 5.6.4 USMCA Rules of Origin
Note: Trade policy analysis will be included only where relevant to the Water Sports Products market.
Chapter 6. Competitive Landscape & Company Benchmarking
- 6.1 Water Sports Products Market Concentration & Structure
- 6.1.1 Herfindahl-Hirschman Index (HHI) – vs. 2024
- 6.1.2 Tier 1, Tier 2 & Tier 3 Market Structure
- 6.1.3 Global, Regional & Local Player Dynamics
- 6.2 Water Sports Products Market Share Analysis – 2024
- 6.2.1 Global Revenue Share by Company
- 6.2.2 Global Volume Share by Company
- 6.2.3 Regional Revenue Share
- 6.2.4 Market Share Evolution ( vs. 2024)
- 6.2.5 OEM Segment Share by Company
- 6.2.6 Replacement Segment Share by Company
- 6.3 Production/Delivery Capacity & Facility Analysis
- 6.3.1 Global Installed Capacity
- 6.3.2 Capacity Utilization Rates
- 6.3.3 Production/Output Volume
- 6.3.4 Facility Locations & Capacity Map
- 6.3.5 Planned Capacity Additions
- 6.4 Water Sports Products Competitive Benchmarking Matrix
- 6.4.1 Revenue, Volume, CAGR & Profitability Comparison
- 6.4.2 Channel Revenue Mix
- 6.4.3 Geographic Revenue Exposure
- 6.4.4 R&D Intensity
- 6.4.5 Sustainability Maturity
- 6.5 Strategic Developments in Water Sports Products (Last 24 Months)
- 6.5.1 Mergers, Acquisitions & Divestments
- 6.5.2 New Water Sports Products Launches
- 6.5.3 Facility Expansions
- 6.5.4 Strategic Alliances, Joint Ventures & Partnerships
- 6.5.5 Distribution Expansion & Market Entry
- 6.5.6 Sustainability & ESG Initiatives
- 6.6 Competitive Strategy Mapping
- 6.6.1 Leader, Challenger, Follower & Niche Classification
- 6.6.2 Pricing Strategy Comparison
- 6.6.3 Channel Strategy Matrix
Note: Strategic developments are included based on their materiality and the availability of reliable information.
Chapter 7. Global Water Sports Products Market – By Distribution Channel
- 7.1 Segment Overview
- 7.1.1 Volume & Revenue Split by Channel (2024 & 2032)
- 7.1.2 Channel Mix Evolution (2024-2032)
Chapter 8. Regional Market Analysis – Global Overview
- 8.1 Global Regional Overview
- 8.1.1 Regional Volume Share
- 8.1.2 Regional Revenue Share
- 8.1.3 Regional Volume by Region
- 8.1.4 Regional Revenue by Region
- 8.1.5 Regional Forecast Through 2032
- 8.2 Cross-Regional Segment Analysis
- 8.2.1 By Distribution Channel
- 8.2.2 By Brand/Price Tier
Chapter 9. North America Water Sports Products Market
- 9.1 United States
- 9.2 Canada
- 9.3 Mexico
Chapter 10. Europe Water Sports Products Market
- 10.1 Germany
- 10.2 France
- 10.3 Italy
- 10.4 United Kingdom
- 10.5 Spain
- 10.6 Poland
- 10.7 Russia
- 10.8 Netherlands
- 10.9 Belgium
- 10.10 Sweden
- 10.11 Denmark
- 10.12 Norway
- 10.13 Rest of Europe
Chapter 11. Asia Pacific Water Sports Products Market
- 11.1 China
- 11.2 India
- 11.3 Japan
- 11.4 South Korea
- 11.5 Thailand
- 11.6 Indonesia
- 11.7 Vietnam
- 11.8 Malaysia
- 11.9 Australia
- 11.10 Rest of Asia Pacific
Chapter 12. Latin America Water Sports Products Market
- 12.1 Brazil
- 12.2 Argentina
- 12.3 Colombia
- 12.4 Chile
- 12.5 Rest of Latin America
Chapter 13. Middle East Water Sports Products Market
- 13.1 Saudi Arabia
- 13.2 United Arab Emirates
- 13.3 Turkey
- 13.4 Israel
- 13.5 Iran
- 13.6 Rest of the Middle East
Chapter 14. Africa Water Sports Products Market
- 14.1 South Africa
- 14.2 Egypt
- 14.3 Nigeria
- 14.4 Morocco
- 14.5 Rest of Africa
Chapter 15. Water Sports Products Company Profiles
- 15.1 [Company 01]
- 15.1.1 Company Overview
- 15.1.2 Key Management Personnel
- 15.1.3 Products & Services Portfolio
- 15.1.4 Financial Performance
- 15.1.5 Key Market Focus & Geographic Presence
- 15.1.6 Recent Developments & Strategic Initiatives
Note: The company profile list is preliminary and may change based on research findings, market developments, data availability, and client requirements.
Chapter 16. Appendices
- Appendix A – List of Abbreviations & Acronyms
- Appendix B – Industry Classification Code Reference – Full Series
- Appendix C – Production & Capacity Data Tables
- Appendix D – End-Use & Demand Base Tables
- Appendix E – Consumption & Replacement Rate Assumptions
- Appendix F – ASP Reference Tables
- Appendix G – Manufacturing & Facility Database
- Appendix H – Import-Export Data Tables
- Appendix I – Regulatory Summary Tables
- Appendix J – Primary Research Participant List (Anonymized)
- Appendix K – Primary Research Questionnaire Framework
- Appendix L – Data Sources & Bibliography
- Appendix M – Market Size Divergence & Source Comparison
Chapter 17. Research Methodology
- 17.1 Research Framework & Philosophy
- 17.2 Secondary Research – Sources, Hierarchy & Data Extraction
- 17.3 Data Modeling – Bottom-Up & Top-Down Market Sizing
- 17.4 Primary Research – Stakeholder Framework, LOI & Sample Sizes
- 17.5 Forecast Methodology – Regression, Scenario & Sensitivity Analysis
- 17.6 Quality Control – Four-Layer Validation Framework
- 17.7 Limitations & Standard Assumptions
- 17.8 Disclaimer
