Market Overview
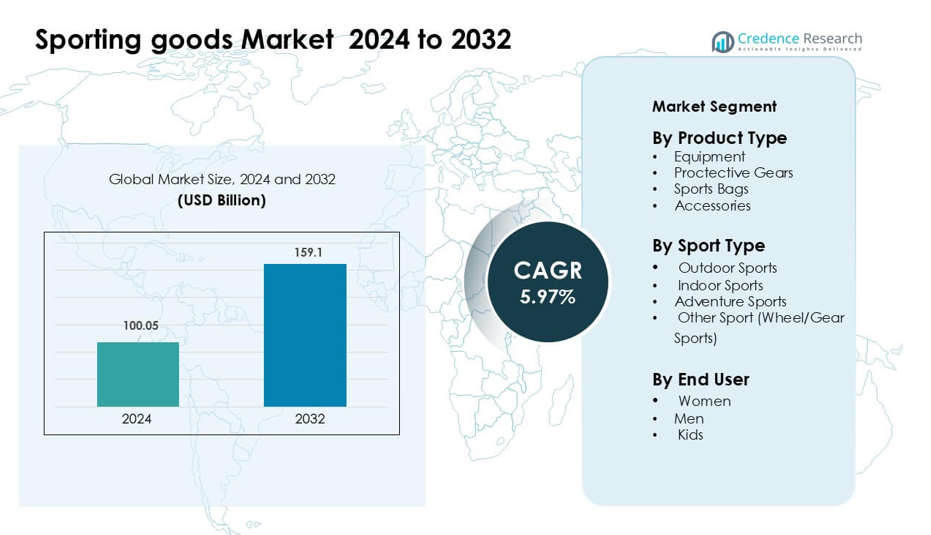
Sporting goods Market was valued at USD 100.05 billion in 2024 and is anticipated to reach USD 159.1 billion by 2032, growing at a CAGR of 5.97 % during the forecast period.
| REPORT ATTRIBUTE |
DETAILS |
| Historical Period |
2020-2023 |
| Base Year |
2024 |
| Forecast Period |
2025-2032 |
| Sporting goods Market Size 2024 |
USD 100.05 billion |
| Sporting goods Market, CAGR |
5.97% |
| Sporting goods Market Size 2032 |
USD 159.1 billion |
Top players in the sporting goods market include Ellesse, AMER Sports, Diadora S.p.A., Under Armour, Inc., Hummel International Sport & Leisure A/S, PUMA SE, Adidas AG, ODLO International AG, Admiral Sportswear Limited, and Nike, Inc., all competing through innovation, strong branding, and wide product portfolios. These companies focus on performance materials, sustainable designs, and digital engagement to strengthen consumer loyalty. North America led the market in 2024 with 34% share, supported by high participation in fitness programs, strong demand for premium sportswear, and a well-established retail ecosystem that drives steady adoption across major sporting categories.
Market Insights
- The sporting goods market reached USD 100.05 billion in 2024 and is projected to hit USD 159.1 billion by 2032, growing at a CAGR of 5.97 % during the forecast period.
- Rising fitness participation and higher spending on premium equipment and sportswear drive steady demand, with equipment leading the product segment with about 46% share in 2024.
- Key trends include the shift toward sustainable materials, smart wearables, and performance-enhancing product designs that encourage faster adoption across youth and adult groups.
- Competition remains strong as brands like Nike, Adidas, PUMA, Under Armour, AMER Sports, and others expand product innovation, digital engagement, and omnichannel strategies to maintain market presence.
- North America dominated the market in 2024 with 34% share, followed by Europe at 28%, while Asia Pacific remained the fastest-growing region, supported by rising participation in outdoor and indoor sports.
Access crucial information at unmatched prices!
Request your sample report today & start making informed decisions powered by Credence Research Inc.!
Download Sample
Market Segmentation Analysis:
By Product Type
Equipment led the product type segment in 2024 with about 46% share, supported by steady demand across fitness centers, schools, and organized sports clubs. Buyers preferred equipment due to wider product coverage, longer replacement cycles, and higher involvement in fitness routines. Growth in home workouts and rising participation in structured sports programs boosted sales of training kits, rackets, balls, and cardio machines. Protective gear, sports bags, and accessories followed, but equipment maintained a clear lead due to broader usage and strong adoption across amateur and professional groups.
- For instance, Technogym a leading fitness-equipment manufacturer reports more than 100,000 wellness centres globally using its machines and has over 500,000 private homes equipped with its gear.
By Sport Type
Outdoor sports dominated the sport type segment in 2024 with nearly 49% share, driven by rising interest in running, football, cricket, and cycling. Participation grew as people sought open-air activities, performance training, and community events. Outdoor categories benefited from large product volumes, frequent usage, and faster replacement rates. Indoor and adventure sports segments expanded at a steady pace, but outdoor sports stayed ahead due to larger user bases, strong media engagement, and broad availability of branded gear across retail and online channels.
- For instance, Amer Sports, parent company of outdoor gear brands like Salomon and Wilson, reported that in fiscal 2024, its Outdoor Performance segment generated US$1.836 billion in revenue.
By End User
Men remained the leading end-user group in 2024 with close to 52% share, supported by higher participation rates in competitive and recreational sports. Male buyers showed strong demand for equipment, footwear, and performance accessories across team and individual sports. Brands focused on men’s collections due to larger spending levels and quick adoption of premium gear. Women’s and kids’ categories gained traction, but the men’s segment continued to dominate because of established sports culture, wider product choices, and stronger engagement in fitness and outdoor activities.
Key Growth Drivers
Rising Sports Participation and Fitness Awareness
Growing interest in structured sports, fitness training, and outdoor activities acts as a major catalyst for the sporting goods market. People join gyms, take part in running events, and engage in recreational sports, which drives steady demand for equipment, apparel, and accessories. Social media fitness content encourages healthier routines, while schools and sports academies expand training programs. Governments promote community sports infrastructure, which increases accessibility. Rising youth engagement and a cultural shift toward active lifestyles further strengthen sales across both premium and mid-range categories. This broad participation base creates a stable and expanding customer pool for sporting goods brands.
- For instance, Nike integrated its Run Club (NRC) and Training Club (NTC) apps with Strava’s community, enabling millions of its members to seamlessly upload workouts and connect with more than 100 million athletes on Strava.
Expansion of E-commerce and Omnichannel Retailing
Online platforms support faster product discovery, price comparison, and wider brand visibility, boosting adoption across diverse buyer groups. Sporting goods companies use digital channels to launch new products, run targeted campaigns, and serve customers in remote regions. Omnichannel strategies integrate online and offline touchpoints, improving convenience and service quality. Same-day delivery, virtual fitting tools, and personalized recommendations enhance consumer confidence. Retailers also invest in exclusive online ranges, bundled offers, and loyalty programs to attract recurring buyers. This digital shift significantly enlarges the market reach for both global and regional sporting goods brands.
- For instance, in Q1 2024, Adidas’ own digital platform grew its e‑commerce sales by 34%, driven by full-price product propositions.
Product Innovation and Performance Enhancement Technologies
Innovation plays a key role as manufacturers introduce advanced materials, ergonomic designs, and durability-focused engineering. Lighter rackets, shock-absorbing footwear, weather-resistant fabrics, and smart training devices improve user experience and performance outcomes. Brands invest in R&D to meet rising expectations from professional athletes and fitness enthusiasts. Wearable integration and sensor-based insights also help users track form, speed, and body metrics. Eco-friendly materials gain traction among conscious buyers. These improvements foster premiumization and higher adoption rates, supporting long-term growth across multiple sporting goods categories.
Key Trends & Opportunities
Growing Demand for Premium and Sustainable Products
Consumers increasingly value high-performance gear that offers comfort, durability, and environmental benefits. Brands respond by developing lines based on recycled plastics, bio-based fabrics, and low-impact manufacturing. Premium collections attract buyers seeking better functionality, while sustainable products appeal to eco-aware customers. This dual trend supports brand differentiation and strengthens customer loyalty. Retailers highlight sustainable sourcing, repair programs, and eco-labels to build trust. As awareness grows, premium and green product categories gain momentum across both online and offline channels.
- For instance, Adidas produced almost 18 million pairs of shoes containing Parley Ocean Plastic in 2021.
Rising Influence of Athletes and Digital Communities
The market benefits from strong engagement driven by athletes, influencers, and sports communities on digital platforms. Training videos, product reviews, and event-focused content encourage users to adopt new gear. Brands collaborate with sports personalities to launch signature editions and promote lifestyle-driven collections. Online communities create a sense of belonging and motivate consistent sports participation. This social influence accelerates product adoption, especially among younger consumers, expanding sales for both mainstream and niche sporting categories.
- For instance, Nike’s lifetime agreement with Cristiano Ronaldo underpins its CR7 capsule, a line repeatedly refreshed across boots, apparel, and lifestyle gear.
Key Challenges
Price Sensitivity and Intense Competitive Pressure
Many buyers in emerging markets remain price-conscious, which limits adoption of premium products. Low-cost regional brands compete aggressively with global players by offering cheaper alternatives. This price pressure reduces margins and forces companies to balance innovation with affordability. Frequent discount cycles across e-commerce platforms also make it difficult to maintain consistent pricing. As competition increases, differentiation becomes challenging, and brands must invest more in marketing, quality improvement, and channel expansion to retain market share.
Supply Chain Disruptions and Raw Material Volatility
The sporting goods market faces challenges such as fluctuating raw material prices, extended shipping times, and unpredictable demand cycles. Shortages of rubber, polymers, and specialty fabrics impact manufacturing outputs and raise production costs. Global events, trade restrictions, and logistics bottlenecks further delay product availability. Brands adopt multi-sourcing strategies and near-shoring models to reduce risks, but disruptions still affect inventory planning and profitability. Ensuring stable supply while maintaining quality standards becomes a critical challenge for market players.
Regional Analysis
North America
North America led the sporting goods market in 2024 with about 34% share, driven by strong participation in fitness programs, organized school sports, and professional leagues. Consumers in the U.S. and Canada invested heavily in premium equipment, outdoor gear, and technologically enhanced products. Retailers expanded omnichannel networks, boosting convenience and product access. The region’s established sports culture supported consistent spending across categories such as running, team sports, and adventure activities. High disposable income and brand loyalty further reinforced North America’s leadership, keeping demand stable across both urban and suburban markets.
Europe
Europe held nearly 28% share of the sporting goods market in 2024, supported by strong interest in football, cycling, and outdoor recreation. Countries such as Germany, the U.K., France, and Italy showed steady demand for performance equipment and sustainable sportswear. Government-backed fitness campaigns and rising gym memberships expanded consumer engagement. European buyers favored quality-driven and eco-friendly products, encouraging brands to focus on recycled materials and durable designs. Broad distribution networks across specialty stores, sporting clubs, and online platforms helped Europe maintain solid growth across both mainstream and niche sport categories.
Asia Pacific
Asia Pacific accounted for roughly 25% share in 2024 and remained the fastest-growing region, driven by rising disposable income, urbanization, and expanding youth participation in sports. China, India, Japan, and South Korea saw higher adoption of home fitness equipment, outdoor gear, and branded sportswear. Government investment in sports infrastructure and school-level programs boosted demand further. E-commerce platforms widened product access for mid-income buyers. Rapid growth in badminton, cricket, running, and adventure sports strengthened market expansion, making Asia Pacific a key focus area for global and regional sporting goods manufacturers.
Latin America
Latin America captured about 8% share in 2024, supported by strong enthusiasm for football, running, and outdoor recreation. Brazil, Mexico, Argentina, and Chile showed rising interest in affordable equipment and mid-range sportswear. Economic recovery and improved retail penetration helped broaden product access. Local sports events and community leagues stimulated demand across youth and adult groups. Despite moderate spending power, consumers displayed steady engagement with global and domestic brands. Expansion of e-commerce logistics also enhanced market reach, encouraging consistent growth across core sporting categories.
Middle East & Africa
The Middle East & Africa region held close to 5% share in 2024, supported by rising fitness participation, expanding gyms, and increasing popularity of football, cricket, and outdoor activities. Countries such as UAE, Saudi Arabia, and South Africa led regional demand with growing interest in premium equipment and performance wear. Government wellness initiatives and sports tourism boosted consumer activity. Retailers expanded modern distribution channels, improving access to international brands. Although price sensitivity remained high in several markets, gradual lifestyle shifts and urban development supported stable long-term growth for sporting goods across the region.
Shape Your Report to Specific Countries or Regions & Enjoy 30% Off!
Market Segmentations:
By Product Type
- Equipment
- Proctective Gears
- Sports Bags
- Accessories
By Sport Type
- Outdoor Sports
- Indoor Sports
- Adventure Sports
- Other Sport (Wheel/Gear Sports)
By End User
By Geography
- North America
- Europe
- Germany
- France
- U.K.
- Italy
- Spain
- Rest of Europe
- Asia Pacific
- China
- Japan
- India
- South Korea
- South-east Asia
- Rest of Asia Pacific
- Latin America
- Brazil
- Argentina
- Rest of Latin America
- Middle East & Africa
- GCC Countries
- South Africa
- Rest of the Middle East and Africa
Competitive Landscape
Leading companies in the sporting goods market such as Ellesse, AMER Sports, Diadora S.p.A., Under Armour, Inc., Hummel International Sport & Leisure A/S, PUMA SE, Adidas AG, ODLO International AG, Admiral Sportswear Limited, and Nike, Inc. compete through product innovation, strong brand positioning, and multi-channel distribution. These players invest heavily in performance-focused materials, ergonomic designs, and sustainability-driven manufacturing to attract a broad consumer base. Many brands expand digital ecosystems through e-commerce platforms, athlete partnerships, and personalized training content. Companies also strengthen their global reach by entering emerging markets, enhancing retail footprints, and offering diverse product lines across equipment, footwear, and apparel. As competition intensifies, firms prioritize R&D, marketing, and supply chain resilience to maintain market share and support long-term growth.
Key Player Analysis
- Ellesse
- AMER Sports
- Diadora S.p.A.
- Under Armour, Inc.
- Hummel International Sport & Leisure A/S
- PUMA SE
- Adidas AG
- ODLO International AG
- Admiral Sportswear Limited
- Nike, Inc
Recent Developments
- In November 2025, Under Armour and Stephen Curry ended their 13-year partnership, separating Curry Brand from Under Armour while planning one final Curry 13 shoe release, marking a major shift in Under Armour’s basketball and footwear strategy.
- In 2025, PUMA SE announced a restructuring plan that includes cutting about 900 office jobs by 2026, aiming to refocus on core sports categories, strengthen fashion-led and premium products, and accelerate direct-to-consumer growth.
- In March 2025, Amer Sports published its 2024 annual report, reporting share gains in winter sports equipment and outlining a group-wide climate program targeting net-zero emissions across its sports and outdoor brands.
Report Coverage
The research report offers an in-depth analysis based on Product Type, Sport Type, End-User and Geography. It details leading market players, providing an overview of their business, product offerings, investments, revenue streams, and key applications. Additionally, the report includes insights into the competitive environment, SWOT analysis, current market trends, as well as the primary drivers and constraints. Furthermore, it discusses various factors that have driven market expansion in recent years. The report also explores market dynamics, regulatory scenarios, and technological advancements that are shaping the industry. It assesses the impact of external factors and global economic changes on market growth. Lastly, it provides strategic recommendations for new entrants and established companies to navigate the complexities of the market.
Future Outlook
- The Sporting Goods Market will see strong demand from growing global fitness engagement.
- Brands will expand sustainable product lines as eco-friendly materials gain more traction.
- Smart wearables and connected equipment will integrate deeper into mainstream sports routines.
- E-commerce platforms will drive higher sales through faster delivery and customization options.
- Premium performance gear will gain popularity among athletes and recreational users.
- Outdoor and adventure sports categories will expand as participation rises across age groups.
- Companies will invest more in R&D to improve durability, comfort, and ergonomic design.
- Emerging markets will contribute significantly due to rising income levels and youth interest.
- Athlete partnerships and digital influencers will shape new product trends and brand visibility.
- Supply chain optimization and regional manufacturing will help brands reduce risks and ensure steady product availability.


