Market Overview
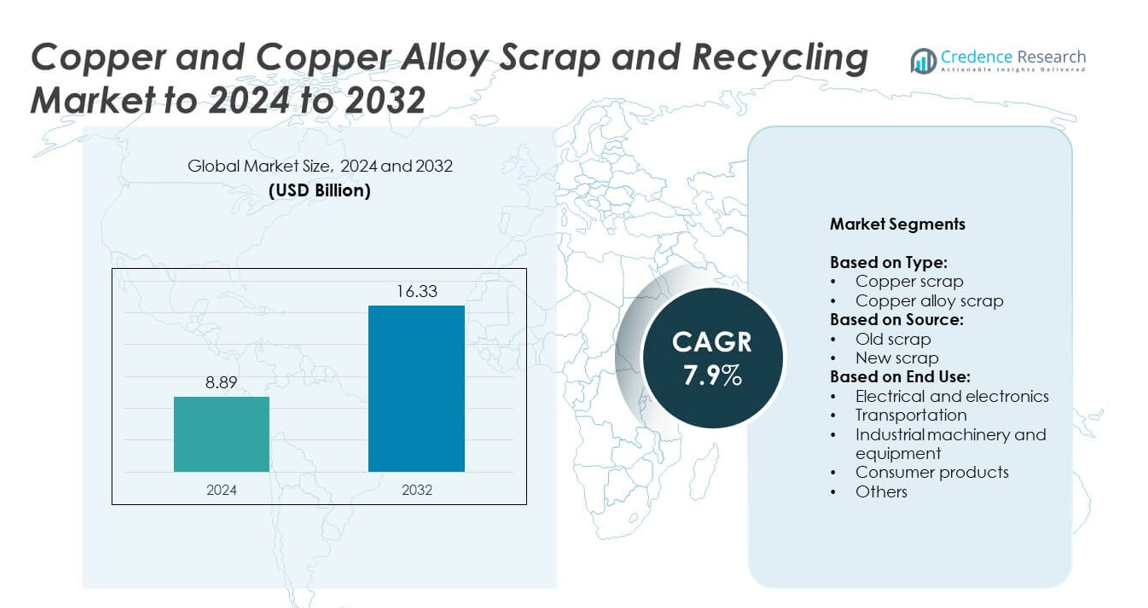
Copper and Copper Alloy Scrap and Recycling Market size was valued at USD 8.89 Billion in 2024 and is anticipated to reach USD 16.33 Billion by 2032, at a CAGR of 7.9% during the forecast period.
| REPORT ATTRIBUTE |
DETAILS |
| Historical Period |
2020-2023 |
| Base Year |
2024 |
| Forecast Period |
2025-2032 |
| Copper and Copper Alloy Scrap and Recycling Market Size 2024 |
USD 8.89 Billion |
| Copper and Copper Alloy Scrap and Recycling Market , CAGR |
7.9% |
| Copper and Copper Alloy Scrap and Recycling Market Size 2032 |
USD 16.33 Billion |
The Copper and Copper Alloy Scrap and Recycling market is led by major players such as Glencore, Aurubis AG, Hindalco Industries, OmniSource, LLC., and Elemental Holding Group. These companies focus on expanding recycling capacity, enhancing process efficiency, and integrating advanced smelting and sorting technologies to ensure high-quality metal recovery. Strategic collaborations with manufacturers and renewable energy sectors strengthen their material supply networks. Asia-Pacific dominated the global market in 2024 with a 35% share, driven by strong industrial output, rapid urbanization, and government-backed recycling initiatives across China, India, and Japan, followed by North America with 27%.
Market Insights
- The Copper and Copper Alloy Scrap and Recycling Market was valued at USD 8.89 billion in 2024 and is projected to reach USD 16.33 billion by 2032, growing at a CAGR of 7.9%.
- Growth is driven by strong demand from the electrical and electronics industry, rising adoption of circular economy policies, and expansion of industrial recycling networks.
- Advanced sorting and refining technologies, along with digital scrap tracking systems, are transforming recycling efficiency and improving metal purity.
- The market is competitive with key players such as Glencore, Aurubis AG, Hindalco Industries, OmniSource, LLC., and Elemental Holding Group focusing on technology-driven recovery and sustainability goals.
- Asia-Pacific led the market with a 35% share in 2024, followed by North America with 27% and Europe with 25%; the copper scrap segment dominated by type with 61% market share.
Access crucial information at unmatched prices!
Request your sample report today & start making informed decisions powered by Credence Research Inc.!
Download Sample
Market Segmentation Analysis:
By Type
The copper scrap segment dominated the market in 2024 with a 61% share, driven by high recyclability and consistent recovery rates. The segment benefits from the strong demand for pure copper in wire rods, cables, and tubes. Copper scrap recycling requires less energy than primary production, making it cost-effective and sustainable. Expanding urban mining and industrial recycling programs in China and India are further strengthening copper scrap collection networks. Meanwhile, copper alloy scrap continues to grow steadily due to rising brass and bronze recovery for automotive and construction applications.
- For instance, Aurubis’ Richmond plant is built to process 180,000 t/year of complex scrap and produce ~70,000 t/year blister copper at 98–99% purity. Start-up occurred in September 2025, with full run targeted H1 2026.
By Source
Old scrap held the leading share of 68% in 2024, supported by the large availability of discarded electrical equipment, wiring, and plumbing materials. The increasing replacement of aging infrastructure and obsolete electronic systems enhances recovery rates of old copper-based materials. Many recycling plants focus on refining old scrap to meet high-grade copper demand in electrical and industrial sectors. New scrap, mainly from manufacturing processes and production waste, is also growing due to improved collection systems and metal recovery efficiency across industrial clusters.
- For instance, Boliden’s Rönnskär facility recycles up to 120,000 t/year of e-scrap after expansions. The site upgraded from ~45,000 t/year to the current level.
By End Use
The electrical and electronics segment accounted for 44% of the market share in 2024, driven by the extensive use of recycled copper in wires, transformers, and printed circuit boards. Growing electrification projects and renewable energy expansion across Asia-Pacific have intensified copper demand. The recycling process helps manufacturers lower material costs while meeting sustainability targets. Transportation and industrial machinery sectors are also increasing recycled copper usage to reduce production emissions and comply with circular economy goals in Europe and North America.
Key Growth Drivers
Rising Demand from Electrical and Electronics Industry
The electrical and electronics sector remains the primary growth driver, consuming over 40% of recycled copper. Increased adoption of electric vehicles, renewable energy systems, and smart grid infrastructure has intensified copper usage. Recycled copper offers similar conductivity to virgin copper but with lower energy consumption, supporting sustainable manufacturing. Expanding renewable installations in Asia-Pacific and Europe further strengthen the recycling ecosystem, ensuring continuous material flow to cable, wiring, and transformer manufacturers seeking eco-efficient metal sources.
- For instance, According to Glencore’s Canadian website, the Horne smelter can process 820,000 tonnes of concentrates and recyclables per year.
Government Policies Promoting Circular Economy
Strict recycling mandates and sustainability programs across major economies are boosting copper scrap collection and reuse. The European Union’s Green Deal and the U.S. Infrastructure Investment Act emphasize resource efficiency and metal recovery. These regulations incentivize industries to adopt recycling-based production methods, reducing dependence on primary mining. Countries like Japan and South Korea have also introduced e-waste recycling initiatives to enhance copper recovery, creating consistent opportunities for recyclers and refining companies worldwide.
- For instance, SK TES processed 101,766,393 kg of equipment in 2023, including 6.2 million devices, under tightening e-waste programs. The firm targets one billion kg processed by 2030.
Growing Industrialization and Urban Infrastructure Development
Rapid urbanization and expansion of industrial infrastructure have significantly increased copper demand. Large-scale construction, power grid upgrades, and manufacturing modernization create abundant scrap streams from cables, motors, and industrial machinery. Developing nations like India and China are major contributors to copper scrap generation due to heavy industrial output. The rising number of refurbishment and dismantling projects also drives scrap recovery, reinforcing recycling capacity expansion and supporting sustainable metal supply chains across global industrial sectors.
Key Trends & Opportunities
Adoption of Advanced Sorting and Refining Technologies
The market is witnessing a strong shift toward automated and sensor-based sorting systems that improve copper purity. Technologies such as X-ray transmission, laser-induced breakdown spectroscopy, and AI-driven segregation enhance recovery efficiency. These advancements reduce processing losses and allow recyclers to meet the high-quality standards required by electrical and automotive industries. Investments in advanced refining equipment by leading recyclers are creating new opportunities for cost optimization and resource efficiency.
- For instance, TOMRA’s FINDER™ COLOR sorts copper, brass, and PCBs at up to 20–22.4 t/hour on zorba, with 6–120 mm grain sizes. AI-driven color detection improves purity and yield.
Rising Focus on Secondary Smelting Facilities
Expansion of secondary smelting operations presents a major opportunity for market growth. Several companies are building high-capacity smelters dedicated to processing copper and alloy scrap with reduced emissions. These facilities use renewable energy and closed-loop systems to minimize environmental impact. The growing investment in urban smelting units across Asia and Europe helps reduce dependency on imported raw materials, creating regional self-sufficiency in recycled copper production.
- For instance, Hindalco’s Dahej project is planned to process 300,000–350,000 t/year of scrap and recover 50,000 t/year copper in Phase 1, scaling toward 200,000 t/year.
Key Challenges
Fluctuating Scrap Availability and Quality
Inconsistent scrap supply and variable material quality remain major barriers to efficient recycling operations. The availability of high-grade copper scrap depends on industrial activity cycles and e-waste collection efficiency. Contamination from mixed materials and coatings often reduces recovery yield, requiring expensive purification. Limited organized collection networks in developing nations further constrain the flow of recyclable materials, affecting production consistency and increasing processing costs for recyclers.
Environmental Compliance and Operational Costs
Strict environmental standards and complex recycling regulations elevate operational expenses for processing plants. Copper recycling involves high-temperature furnaces and emission control systems, demanding significant capital investment. Smaller recyclers often struggle to meet waste treatment and emission compliance norms, limiting scalability. Rising energy prices and labor costs also add financial pressure, making it challenging for recycling facilities to maintain profitability while adhering to global sustainability frameworks.
Regional Analysis
North America
North America held a 27% market share in 2024, driven by well-established recycling infrastructure and strong demand from the electrical and transportation sectors. The U.S. leads regional growth due to increasing adoption of sustainable manufacturing and e-waste recycling initiatives. The region benefits from advanced sorting technologies and extensive metal recovery networks. Supportive government policies under the Infrastructure Investment and Jobs Act have encouraged large-scale recycling investments. Growing use of recycled copper in electric vehicle components and renewable energy projects continues to strengthen the region’s position in the global copper recycling market.
Europe
Europe accounted for 25% of the global market share in 2024, supported by stringent environmental policies and a strong circular economy framework. Nations such as Germany, Italy, and the Netherlands lead copper scrap collection and secondary smelting. The European Green Deal and Waste Electrical and Electronic Equipment Directive have accelerated recycling system upgrades. Increasing copper demand from renewable power, electric mobility, and building renovation projects drives scrap utilization. Expanding industrial recovery programs and innovations in clean smelting processes further enhance Europe’s dominance in sustainable metal recycling.
Asia-Pacific
Asia-Pacific dominated the global market with a 35% share in 2024, fueled by rapid industrialization, infrastructure growth, and strong manufacturing output. China, India, and Japan are the primary recycling hubs, benefiting from large scrap availability and government-backed sustainability programs. China’s National Sword policy reshaped the regional scrap trade, leading to more localized recycling operations. Growing copper use in electrical grids, consumer electronics, and EV manufacturing is further propelling demand. Expanding domestic processing capabilities and investments in advanced smelting technologies are consolidating Asia-Pacific’s leadership in global copper recycling activities.
Latin America
Latin America captured a 7% market share in 2024, driven by increasing industrialization and growing emphasis on sustainable resource recovery. Brazil, Mexico, and Chile are emerging as key contributors with expanding metal recovery plants and refining capacities. Rising investments in mining and metallurgical sectors have boosted scrap generation, enabling regional recyclers to strengthen supply chains. Governments are introducing extended producer responsibility frameworks to formalize recycling operations. Growing exports of secondary copper materials and cross-border collaborations with North American companies are enhancing regional competitiveness in the global recycling landscape.
Middle East & Africa
The Middle East & Africa accounted for a 6% market share in 2024, supported by rising investments in industrial recycling infrastructure and circular economy initiatives. The United Arab Emirates and South Africa are leading recyclers, expanding copper scrap processing capacity through public-private partnerships. The region’s growing construction and power sectors generate substantial copper waste streams. Efforts to reduce landfill use and promote metal recovery are gaining policy support. Increasing participation of global recycling firms and technology transfer agreements are helping modernize operations, improving copper recovery efficiency across developing economies.
Market Segmentations:
By Type:
- Copper scrap
- Copper alloy scrap
By Source:
By End Use:
- Electrical and electronics
- Transportation
- Industrial machinery and equipment
- Consumer products
- Others
By Geography:
- North America
- Europe
- Germany
- France
- U.K.
- Italy
- Spain
- Rest of Europe
- Asia Pacific
- China
- Japan
- India
- South Korea
- South-east Asia
- Rest of Asia Pacific
- Latin America
- Brazil
- Mexico
- Rest of Latin America
- Middle East & Africa
- GCC Countries
- South Africa
- Rest of the Middle East and Africa
Competitive Landscape
The Copper and Copper Alloy Scrap and Recycling market is characterized by strong competition among key players such as Glencore, Aurubis AG, Hindalco Industries, OmniSource, LLC., Elemental Holding Group, CMC, Ames Copper Group, KGHM METRACO S.A., Marex, Global Metals & Iron Inc., JAIN RESOURCE RECYCLING PVT LTD., S.I.C. Recycling, Inc., Pascha GmbH., and Perniagaan Logam Panchavarnam Sdn Bhd. These companies focus on expanding their recycling capacities, adopting advanced refining technologies, and securing consistent scrap supply through long-term procurement contracts. Many firms are integrating AI-based sorting and sensor-driven recovery systems to enhance purity and process efficiency. Strategic collaborations with industrial manufacturers and renewable energy projects are helping strengthen sustainable copper sourcing. Additionally, investments in secondary smelting units and digital scrap management platforms are driving operational transparency. The competitive landscape is expected to intensify as global demand for recycled copper grows across electrical, transportation, and industrial applications.
Shape Your Report to Specific Countries or Regions & Enjoy 30% Off!
Key Player Analysis
- Glencore
- Aurubis AG
- Hindalco Industries
- OmniSource, LLC.
- Elemental Holding Group
- CMC
- Ames Copper Group
- KGHM METRACO S.A.
- Marex
- Global Metals & Iron Inc.
- JAIN RESOURCE RECYCLING PVT LTD.
- I.C. Recycling, Inc.
- Pascha GmbH.
- Perniagaan Logam Panchavarnam Sdn Bhd
Recent Developments
- In 2023, Hindalco Industries, an Indian aluminum and copper manufacturer, announced an investment of INR 2,000 crore (~USD 240.2 million) to set up a copper and e-waste recycling unit in India.
- In 2023, Marex, a UK-based financial services company, acquired Global Metals Network (GMN), a recycled metals producer based in Hong Kong, for an undisclosed amount.
- In 2023, Elemental Holding Group, a Luxembourg-based mining company and e-waste recycler, acquired Colt Recycling LLC, a UK-based e-waste recycler having facilities in New Hampshire, UK, and North Carolina, U.S. for an undisclosed amount.
Report Coverage
The research report offers an in-depth analysis based on Type, Source, End-Use and Geography. It details leading market players, providing an overview of their business, product offerings, investments, revenue streams, and key applications. Additionally, the report includes insights into the competitive environment, SWOT analysis, current market trends, as well as the primary drivers and constraints. Furthermore, it discusses various factors that have driven market expansion in recent years. The report also explores market dynamics, regulatory scenarios, and technological advancements that are shaping the industry. It assesses the impact of external factors and global economic changes on market growth. Lastly, it provides strategic recommendations for new entrants and established companies to navigate the complexities of the market.
Future Outlook
- The market will expand due to rising copper demand in electric vehicles and renewable energy.
- Recycling efficiency will improve with wider use of AI-based and automated sorting systems.
- Government regulations promoting circular economy practices will strengthen global recycling infrastructure.
- Secondary smelting capacity will increase across Asia and Europe to meet domestic copper needs.
- E-waste recycling will become a key source of high-grade copper recovery.
- Industrial and construction waste management programs will enhance organized scrap collection.
- Collaboration between recyclers and manufacturers will reduce supply chain dependence on mined copper.
- Adoption of low-emission refining technologies will make recycling more environmentally sustainable.
- Digital tracking systems will improve traceability and transparency in copper scrap trade.
- Expanding industrialization in emerging economies will create new opportunities for scrap processing facilities.


