Market Overview
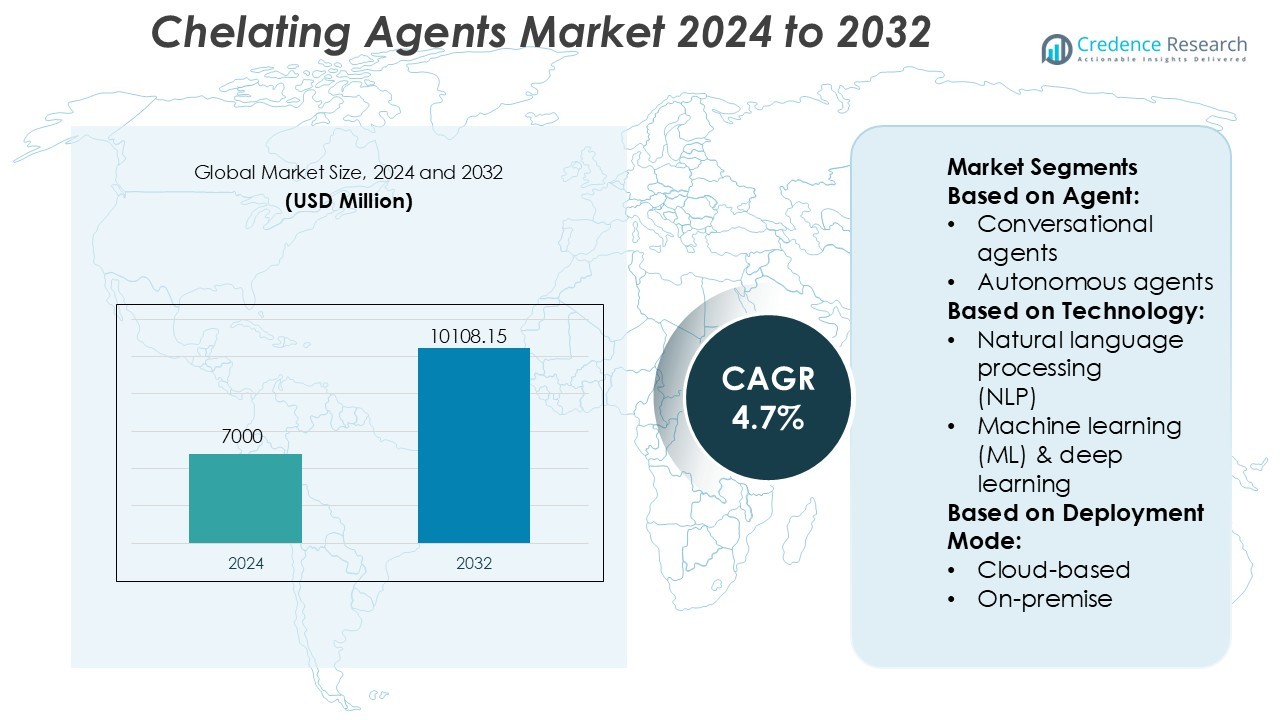
Chelating Agents Market size was valued USD 7000 million in 2024 and is anticipated to reach USD 10108.15 million by 2032, at a CAGR of 4.7% during the forecast period.
| REPORT ATTRIBUTE |
DETAILS |
| Historical Period |
2020-2023 |
| Base Year |
2024 |
| Forecast Period |
2025-2032 |
| Chelating Agents Market Size 2024 |
USD 7000 Million |
| Chelating Agents Market, CAGR |
4.7% |
| Chelating Agents Market Size 2032 |
USD 10108.15 Million |
The chelating agents market includes strong competition among global chemical and specialty ingredient manufacturers. Leading companies focus on biodegradable and phosphate-free formulations to meet strict environmental rules and rising demand from detergents, water treatment, food processing, and personal care. Many producers expand regional supply chains, launch application-specific grades, and invest in bio-based production to improve sustainability and product efficiency. North America holds the leading regional position with a 32% market share, supported by advanced manufacturing, strict wastewater regulations, and high consumption of premium cleaning and industrial chemicals. Growing investments in R&D and green formulations continue to shape competitive strategies across the market.
Market Insights
- Chelating Agents Market size was valued at USD 7000 million in 2024 and is projected to reach USD 10108.15 million by 2032 at a CAGR of 4.7%.
- Demand rises due to market drivers such as phosphate-free detergents, industrial water treatment, and food preservation, where chelating compounds improve filtration, stability, and cleaning performance.
- Market trends show strong adoption of biodegradable and bio-based formulations, with producers developing application-specific grades for cosmetics, agriculture, and pharmaceuticals to meet regulatory and consumer sustainability expectations.
- Competitive analysis highlights innovation and capacity expansion as key strategies, with major players focusing on green chemistry, advanced dosing systems, and wider global distribution networks.
- Regional analysis shows North America leading with a 32% share, followed by Europe and Asia-Pacific; conversational agents hold the dominant segment share as industries prefer cost-efficient and high-performance chelating solutions across water treatment, detergents, and food processing applications.
Access crucial information at unmatched prices!
Request your sample report today & start making informed decisions powered by Credence Research Inc.!
Download Sample
Market Segmentation Analysis:
By Agent
Conversational agents hold the leading share in the Australia industrial gases chelating agents market. Businesses in oil refining, metal cleaning, and chemical processing rely on conversational interfaces to guide operators, manage alarms, and track equipment status. These systems reduce downtime and improve workflow transparency. Their adoption rises as plants shift from manual reporting to automated interaction platforms. Demand grows in logistics, asset maintenance, and safety monitoring, where operators use voice or chat-based systems to access real-time instructions. The need for faster decision-making and fewer human errors drives continued dominance of conversational agents.
- For instance, BASF commissioned a new supercomputer features computing power of 3 petaflops, has more than 1,000 compute nodes, and possesses 3,000 terabytes of storage capacity.
By Technology
Machine learning and deep learning represent the dominant technology segment with the highest market share. Industrial users analyze gas quality, leak patterns, and predictive failure data using ML-driven chelating agent management tools. These models process large volumes of sensor information and improve accuracy over time. Gas manufacturers deploy ML systems to optimize chemical dosing, storage conditions, and pipeline safety. The rapid shift toward automated analytics, energy efficiency, and real-time monitoring supports strong uptake. ML-enabled platforms allow predictive maintenance and reduce operational risk, making this technology segment the core growth driver.
- For instance, PPG’s FLO-GARD™ precipitated silica products achieved carrying capacities above 66% by weight of sunflower oil in bulk food trials, compared with maltodextrin at 3.75% by weight.
By Deployment Mode
Cloud-based deployment leads the market with the largest share due to scalability and lower upfront costs. Gas producers and industrial users adopt cloud platforms to manage dosing analytics, asset tracking, and remote equipment diagnostics. Engineers access dashboards from multiple sites without heavy hardware investment. Cloud integration improves response time and supply planning across distributed facilities. Adoption rises as companies digitize supply chains and automate compliance reporting. The flexibility to update systems remotely and deploy new analytics modules drives continued preference for cloud-based solutions over on-premise or edge infrastructure.
Key Growth Drivers
Rising Use in Water Treatment and Industrial Cleaning
Demand increases because water utilities and factories need better scale control and metal ion removal. Chelating agents help maintain equipment life and reduce corrosion in boilers, pipelines, and cooling towers. Municipal plants use them to improve filtration and limit heavy metal residue. Growing investments in wastewater recycling support higher consumption. Power plants and chemical factories prefer chelating compounds over traditional phosphates due to stronger binding efficiency and safer disposal. Industrial cleaning products also rely on these agents to remove rust and mineral deposits without damaging metal surfaces.
- For instance, Univar Solutions opened a 120 m² (1,292 ft²) Foodology kitchen and R&D lab in Essen, Germany in October 2025 to accelerate ingredient innovation and test advanced food formulations.
Growing Adoption in Detergents and Household Products
Laundry detergents, dishwashing liquids, and surface cleaners now use chelating agents to enhance stain removal and prevent mineral buildup. Manufacturers shift to phosphate-free formulations to meet environmental rules. Chelating chemicals boost detergent performance in hard water areas by stabilizing surfactant activity. Personal care brands add them to shampoos and lotions for product stability and improved shelf life. Rising hygiene awareness and premium cleaning products increase demand. The shift toward concentrated and cold-wash detergents further strengthens usage of high-efficiency chelating compounds.
- For instance, Evonik’s anti-caking silica solutions require an addition rate of less than 1.5 % by weight to achieve effective clump prevention in powdered food systems.
Expansion in Food Processing and Agriculture
Food processors use chelating agents to preserve color, flavor, and texture in packaged products. They control metal-catalyzed oxidation in beverages and canned foods. Agriculture depends on chelated micronutrients to improve nutrient uptake in crops and enhance soil health. Demand rises in greenhouse farming, hydroponics, and precision agriculture, where micronutrient delivery needs higher stability. Chelated fertilizers help reduce nutrient loss during irrigation. Strong focus on crop yield, food safety, and export quality supports steady market growth across both small and large farming operations.
Key Trends & Opportunities
Shift Toward Biodegradable and Sustainable Chelates
Regulators discourage phosphate-based and non-biodegradable chemicals, pushing producers to develop eco-friendly alternatives. Biodegradable chelating agents such as EDDS and GLDA gain momentum in detergents, personal care, and agriculture. Brands market “green cleaning” solutions to meet rising consumer expectations. Industrial buyers prefer sustainable chelates to reduce wastewater impact and meet ESG goals. Growing investment in bio-based chemistry offers long-term opportunities for innovation and premium pricing. Adoption expands as companies commit to circular manufacturing and low-toxicity ingredients.
- For instance, Huber’s “HuberCal® Elite” calcium carbonate product states its lead level is below 0.12 µg/g, enabling very high-purity formulations for food and nutrition applications.
High Demand from Pharmaceutical and Cosmetics Formulation
Chelating compounds stabilize drug formulations by binding metal ions that degrade active ingredients. Pharmaceutical contract manufacturers use them to maintain purity in injectable and liquid drugs. In personal care, they improve shelf life, prevent discoloration, and enhance product feel. Anti-aging creams, sunscreens, and hair care products rely on chelating blends for better performance. The rise of premium skincare, organic cosmetics, and strict quality standards increases usage. Growing local manufacturing and exports in emerging regions make this segment a strong opportunity.
- For instance, Tixosil® 68B FCC grade features a particle size (D50) of 16 µm, designed to cover host-powder particles and prevent clumping by creating particle surface roughness.
Technological Advances in Industrial Automation
Process industries use digital monitoring systems to track chemical dosing and optimize metal ion control. Automation reduces waste and improves regulatory compliance. Smart dosing units adjust chelating agent use based on real-time data from sensors in pipelines and cooling systems. As factories adopt Industry 4.0, chelating agents integrate into predictive maintenance models that minimize downtime. This trend creates new demand for specialized formulations designed for advanced automated environments.
Key Challenges
Price Volatility of Raw Materials
Most leading chelating agents depend on petrochemical derivatives and specialty intermediates. Fluctuating costs of raw materials affect pricing for manufacturers and end users. Producers face pressure to stabilize costs while meeting demand for high-purity and biodegradable formulations. Supply chain disruptions, transport delays, and global energy price shifts add further uncertainty. Smaller players struggle to compete with large suppliers that secure long-term contracts. These cost variations limit profit margins and slow product adoption in price-sensitive industries.
Regulatory Restrictions and Environmental Scrutiny
Non-biodegradable chelating agents raise concerns about persistence in water bodies. Some regions impose strict discharge norms and chemical safety rules. Manufacturers must modify formulations or invest in costly waste treatment systems to comply. Food and personal care applications face tighter approval standards, which prolong product development cycles. Companies shifting from legacy formulations to bio-based alternatives require new certifications and customer testing. These regulatory hurdles increase compliance costs and slow market expansion in high-risk categories.
Regional Analysis
North America
North America holds the leading share of the chelating agents market at 32%. Demand increases across water treatment plants, household detergents, and industrial cleaning chemicals. Stringent wastewater regulations push factories to use high-efficiency biodegradable chelates. The United States drives most consumption due to strong manufacturing, food processing, and oil refinery activity. Producers introduce eco-friendly formulations to meet sustainability goals and reduce phosphate use. Growth also comes from pharmaceutical and personal care production, where chelating compounds improve formulation stability and product shelf life. Strong R&D spending and advanced supply chains support regional expansion.
Europe
Europe accounts for 28% of the global market, supported by strict environmental rules and high adoption of biodegradable agents. The region sees strong consumption in detergents, textile processing, pulp and paper, and wastewater treatment. Germany, France, Italy, and the U.K. lead usage due to strong chemical and manufacturing sectors. Green cleaning products grow rapidly as consumers favor low-toxicity household chemicals. Food processing and beverage manufacturing also drive demand for chelating compounds that control oxidation and metal contamination. Sustainability policies boost replacement of traditional phosphates with bio-based alternatives across industrial and consumer applications.
Asia-Pacific
Asia-Pacific holds 24% of the market and remains the fastest-growing region. China, India, Japan, and South Korea expand usage in detergents, textile dyes, agriculture, and industrial water treatment. Rapid urbanization and strong manufacturing volumes drive bulk demand. Crop nutrition brands introduce chelated fertilizers for higher yields and micronutrient efficiency. Paper mills and chemical factories adopt chelating solutions to reduce scale deposits and extend equipment life. Rising personal care consumption also supports market penetration. Investments in local production and lower labor costs make the region a competitive base for global supply.
Latin America
Latin America captures 9% of the chelating agents market, led by Brazil and Mexico. Food and beverage processors use chelating compounds to maintain color, flavor, and shelf life in packaged goods. Growing detergent and household cleaner consumption supports steady demand. Agriculture adopts chelated micronutrients to improve crop quality in sugarcane, soy, and fruit cultivation. Industrial cleaning applications rise in oil refining, petrochemicals, and mining. However, slower regulatory modernization and cost sensitivity limit high-priced biodegradable alternatives. Increasing urban population and expansion of consumer product manufacturing create future growth opportunities.
Middle East & Africa
The Middle East & Africa represent 7% of the global market. Oil and gas processing drives industrial demand due to high corrosion control and water treatment needs. Refineries use chelating agents to reduce metal fouling in pipelines and cooling systems. Desalination plants adopt chelates for membrane cleaning and scale prevention. South Africa leads regional consumption, followed by UAE and Saudi Arabia. Agriculture and food processing show rising adoption of chelated fertilizers and preservative applications. Limited local production increases reliance on imports, but new manufacturing projects and industrial expansion offer long-term growth potential.
 Market Segmentations:
By Agent:
- Conversational agents
- Autonomous agents
By Technology:
- Natural language processing (NLP)
- Machine learning (ML) & deep learning
By Deployment Mode:
By Geography
- North America
- Europe
- Germany
- France
- U.K.
- Italy
- Spain
- Rest of Europe
- Asia Pacific
- China
- Japan
- India
- South Korea
- South-east Asia
- Rest of Asia Pacific
- Latin America
- Brazil
- Argentina
- Rest of Latin America
- Middle East & Africa
- GCC Countries
- South Africa
- Rest of the Middle East and Africa
Competitive Landscape
The competitive landscape in the chelating agents market players such as Kemira Oyj, Sigma-Aldrich, BASF SE, Tate & Lyle, Lanxess, AkzoNobel, Archer Daniels Midland (ADM) Company, The Dow Chemical Company, EMD Millipore, and Mitsubishi Rayon. The chelating agents market focuses on innovation, regulatory compliance, and wider industry adoption. Manufacturers expand product lines with biodegradable and phosphate-free solutions to meet strict environmental rules and growing demand from green cleaning brands. Many companies upgrade production capacity and develop application-specific formulations for detergents, water treatment, cosmetics, and pharmaceuticals. Strategic partnerships, research collaborations, and regional distribution networks strengthen market presence, especially in fast-growing Asian and Latin American markets. Firms also invest in bio-based chemistry and advanced manufacturing to reduce toxicity and improve metal binding efficiency. Continuous product innovation and sustainability commitments drive long-term competitiveness.
Key Player Analysis
- Kemira Oyj
- Sigma-Aldrich
- BASF SE
- Tate & Lyle
- Lanxess
- AkzoNobel
- Archer Daniels Midland (ADM) Company
- The Dow Chemical Company
- EMD Millipore
- Mitsubishi Rayon
Recent Developments
- In February 2025, GitHub introduced Agent Mode for GitHub Copilot, enhancing the AI-powered coding assistant’s ability to independently iterate on code, identify errors, and implement fixes. This upgrade allows Copilot to interpret high-level requests, generate code across multiple files, and debug its output with minimal human intervention.
- In October 2025, Microsoft launched Microsoft 365 Copilot innovations, including new Copilot agents that automate and streamline processes. The AI agent offers users the capability to develop a range of AI assistants capable of performing tasks within Microsoft’s proprietary software and software from third-party vendors.
- In September 2024, Salesforce and Google Cloud announced the partnership in order to create Salesforce Agentforce Agents. This will allow consumers to deploy autonomous agents that can take action and seamlessly work with the apps utilized by consumers every day.
- In July 2024, BRYTER, an AI workflow automation provider, launched AI Agents, a new product suite, and major updates to its no-code platform. Utilizing specialized trained AI, BRYTER’s AI Agents assist law firms and legal departments in handling their tasks’ repetitive and laborious aspects.
Shape Your Report to Specific Countries or Regions & Enjoy 30% Off!
Report Coverage
The research report offers an in-depth analysis based on Agent, Technology, Deployment Mode and Geography. It details leading market players, providing an overview of their business, product offerings, investments, revenue streams, and key applications. Additionally, the report includes insights into the competitive environment, SWOT analysis, current market trends, as well as the primary drivers and constraints. Furthermore, it discusses various factors that have driven market expansion in recent years. The report also explores market dynamics, regulatory scenarios, and technological advancements that are shaping the industry. It assesses the impact of external factors and global economic changes on market growth. Lastly, it provides strategic recommendations for new entrants and established companies to navigate the complexities of the market.
Future Outlook
- Demand will rise as industries adopt biodegradable and phosphate-free formulations.
- Water treatment plants will increase usage to improve filtration and heavy metal removal.
- Food and beverage processors will use more chelating blends to maintain color and product stability.
- Agriculture will expand adoption of chelated micronutrients to improve crop yields and soil health.
- Pharmaceutical and cosmetic formulators will rely on high-purity grades for longer shelf life and better product performance.
- Digital monitoring and smart dosing systems will improve efficiency in industrial cleaning and cooling towers.
- Expansion of green cleaning brands will create new opportunities for bio-based chelating agents.
- Manufacturers will invest in local production facilities to reduce supply chain costs in emerging markets.
- Regulatory pressure will accelerate replacement of traditional phosphates with eco-friendly alternatives.
- Continuous innovation in formulation chemistry will enhance metal binding strength and application versatility.


