Market Overview:
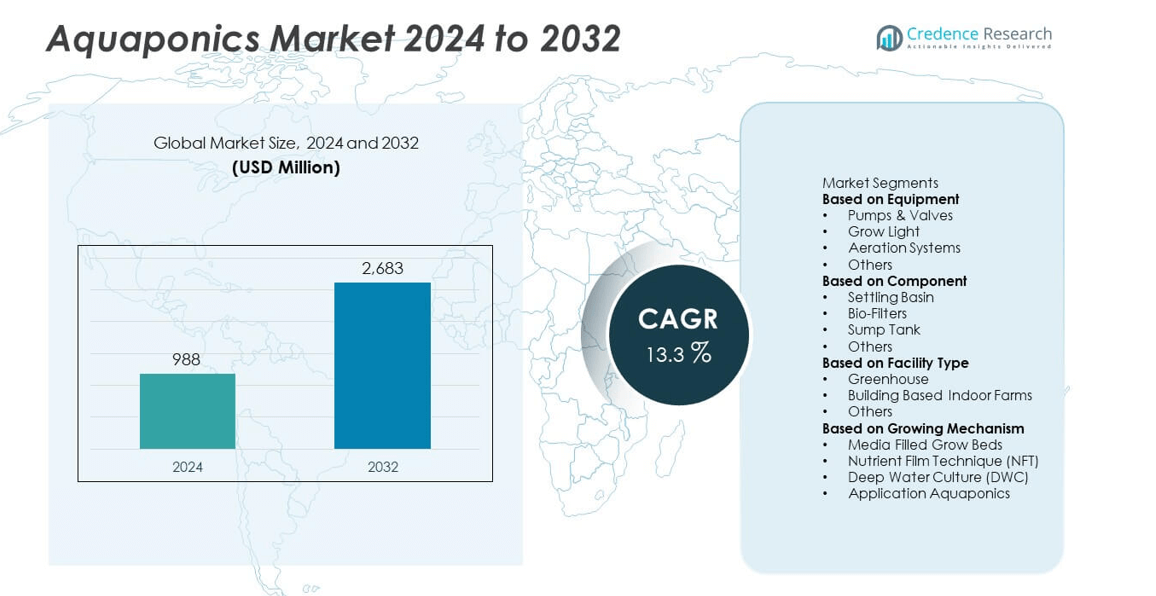
The global aquaponics market was valued at USD 988 million in 2024 and is projected to reach USD 2,683 million by 2032, expanding at a CAGR of 13.3% during the forecast period.
| REPORT ATTRIBUTE |
DETAILS |
| Historical Period |
2020-2023 |
| Base Year |
2024 |
| Forecast Period |
2025-2032 |
| Aquaponics Market Size 2024 |
USD 988 million |
| Aquaponics Market, CAGR |
13.3% |
| Aquaponics Market Size 2032 |
USD 2,683 million |
The aquaponics market is led by key players including Hydrofarm Holdings Group, Inc., Practical Aquaponics (Pty) Ltd, My Aquaponics, Aquaponic Lynx LLC, Greenlife Aquaponics, Portable Farms Aquaponics Systems, Nelson and Pade Aquaponics, Pentair Aquatic Eco-System, Inc. (PAES), Backyard Aquaponics Pty Ltd, and The Aquaponic Source. These companies focus on developing efficient, automated, and sustainable aquaponic systems for commercial and urban farming applications. North America dominated the global market with a 38.4% share in 2024, driven by strong investments in indoor and greenhouse aquaponics. Europe followed with 28.9%, emphasizing circular food systems, while Asia Pacific held 24.7% and emerged as the fastest-growing region due to rising food security initiatives and increasing adoption of urban aquaponics farms.
Market Insights
- The aquaponics market was valued at USD 988 million in 2024 and is projected to reach USD 2,683 million by 2032, growing at a CAGR of 13.3%.
- Rising demand for sustainable and pesticide-free food production is driving aquaponics adoption across both commercial and urban farming sectors.
- Technological advancements in smart sensors, automated control systems, and renewable-powered greenhouses are shaping market growth trends.
- Key players such as Pentair Aquatic Eco-System, Hydrofarm Holdings, and Nelson and Pade are investing in modular systems and global expansion to strengthen competitiveness.
- North America led with a 38.4% share in 2024, followed by Europe with 28.9% and Asia Pacific with 24.7%, while the greenhouse facility type segment accounted for a 47.5% share of the global aquaponics market.
Access crucial information at unmatched prices!
Request your sample report today & start making informed decisions powered by Credence Research Inc.!
Download Sample
Market Segmentation Analysis:
By Equipment
Pumps and valves dominated the aquaponics market in 2024, as they are essential for maintaining water flow, oxygenation, and nutrient exchange between tanks and grow beds. Reliable pump systems ensure optimal fish and plant health, reducing maintenance downtime and operational risks. The rising demand for energy-efficient and automated pumping solutions is driving innovation in this category. Pentair’s precision water management systems feature variable speed drives and real-time flow optimization, lowering energy use and improving system reliability. Growing adoption of automation and IoT-based monitoring further supports the expansion of this segment in commercial aquaponic farms.
- For instance, Pentair’s precision water management systems incorporate variable speed drives capable of reducing energy consumption by up to 90% versus traditional pumps. The company focuses its efforts on core water solutions for residential, commercial, and industrial applications.
By Component
Bio-filters held the largest market share in 2024, driven by their ability to convert toxic ammonia from fish waste into plant nutrients through nitrification. These systems play a vital role in maintaining stable water chemistry and ensuring nutrient availability for plants. Modern bio-filters are designed for low maintenance and high conversion efficiency, making them ideal for closed-loop aquaponic systems. The Aquaponic Source developed modular filtration units that achieve ammonia conversion rates above 90% under continuous operation. Rising focus on sustainable water use and improved biological efficiency continues to strengthen this component’s role in system design.
- For instance, The Aquaponic Source offers educational materials explaining that the natural biological filtration in an aquaponic system allows plants to act as a water filtration system by absorbing nitrogenous waste.
By Facility Type
Greenhouses led the aquaponics market in 2024, as controlled environmental conditions enable consistent year-round crop production. These facilities allow optimized control over temperature, humidity, and light exposure, maximizing yield quality and minimizing resource consumption. Greenhouse-based systems are widely used for commercial farming due to their scalability and integration with renewable energy systems. Nelson and Pade, Inc. operates large-scale aquaponic greenhouses across North America, combining climate control automation and nutrient monitoring for enhanced productivity. Growing demand for efficient food production in urban and peri-urban regions continues to accelerate greenhouse-based aquaponic adoption worldwide.
Key Growth Drivers
Rising Demand for Sustainable Food Production
The growing global focus on sustainable and resource-efficient food systems continues to drive the aquaponics market. This integrated method combines aquaculture and hydroponics to produce fish and plants with minimal resource use. It recycles nutrients, reduces water consumption by nearly 90%, and eliminates the need for synthetic fertilizers. Countries such as Singapore and the Netherlands have invested heavily in urban aquaponic farms. One 450 m² farm in Singapore produces about 1,300 kg of vegetables and 200 kg of fish annually, showing how the model supports food security and sustainable production.
- For instance, VertiVegies is a Singapore-based agricultural company that uses advanced technology, including AI and IoT systems, in its operations to contribute to the nation’s food security goals.
Technological Advancements in Controlled Environment Agriculture
Advances in automation, IoT sensors, and data-driven control systems are improving aquaponics performance and scalability. Real-time monitoring of temperature, dissolved oxygen, and nutrient concentration allows farmers to maintain precise environmental conditions. Automated systems now manage feeding, lighting, and aeration efficiently, reducing manual effort and improving yield stability. Research shows IoT-based aquaponic systems can increase feed efficiency by 20 kg of fish per 1,000 liters of water. These innovations make aquaponics more adaptable for large-scale urban and commercial food operations.
- For instance, Pentair’s integrated control dashboard supports commercial facilities worldwide, leveraging smart technologies such as various IoT sensors to monitor essential water parameters, which enables efficient system management and optimized performance.
Government Support and Urban Farming Initiatives
Supportive government policies and food security initiatives are accelerating aquaponics adoption worldwide. National programs offering grants, training, and subsidies encourage sustainable farming technologies in both developed and emerging economies. The U.S. Department of Agriculture and European Commission continue funding pilot-scale aquaponic projects to enhance local food supply chains. Urbanization has also increased interest in rooftop and indoor farms. Across Asia and Europe, these efforts have enabled hundreds of small aquaponic enterprises to expand, boosting local employment and promoting circular economy practices.
Key Trends & Opportunities
Integration of Renewable Energy Systems
Renewable energy integration in aquaponic systems is emerging as a major trend. Solar and geothermal power are being adopted to reduce reliance on conventional electricity sources and lower carbon emissions. Solar-driven systems can save up to 5 MWh of grid energy per year for medium-scale farms, while geothermal units help stabilize water temperatures in colder climates. These technologies ensure continuous system operation with reduced costs, aligning aquaponics with global goals for carbon neutrality and climate-resilient agriculture.
- For instance, Nelson and Pade, Inc. designs aquaponic systems that use approximately 90% less water than conventional soil-based farming methods by continuously recycling water within a closed-loop system, which enhances production output in a relatively small area.
Expansion of Commercial and Urban Aquaponics
The shift toward localized food production and vertical farming is fueling urban aquaponics expansion. Rooftop and indoor aquaponic systems allow year-round cultivation of vegetables and fish using limited space. Advanced LED lighting and automated climate control can produce about 25 kg of vegetables per square meter annually. Cities such as New York and Tokyo now feature large-scale indoor aquaponic farms that integrate fish and crop production efficiently. This trend offers new business opportunities for investors focusing on sustainable urban agriculture.
- For instance, Traders Hill Farm in Hilliard, Florida operates an aquaponic farm that produces over 1,800 kg (4,000 lbs) of lettuce and over 450 kg (1,000 lbs) of fish (tilapia) every month.
Key Challenges
High Initial Setup and Operational Costs
High installation and maintenance costs remain a major barrier to aquaponics adoption. Commercial systems require significant investment in water circulation units, filtration systems, sensors, lighting, and greenhouse structures. Setting up a mid-sized aquaponic farm can cost several hundred thousand dollars, limiting access for small producers. Operational expenses, including electricity and nutrient supplementation, also add to financial challenges. However, modular system designs and prefabricated components are gradually reducing costs by up to 20%, making commercial adoption more feasible.
Lack of Technical Expertise and Standardization
Limited technical know-how and lack of standard operating procedures hinder aquaponics scalability. Managing the balance between aquaculture and hydroponics demands expertise in nutrient cycles, water chemistry, and system biology. Inadequate monitoring of ammonia or nitrate levels often leads to reduced yields and system inefficiencies. Studies indicate inexperienced operators can face yield losses of up to 30 kg of fish per cycle. Expanding training programs, certifications, and research collaborations is essential to improve technical capacity and maintain consistent global production standards.
Regional Analysis
North America
North America held a 38.4% share of the aquaponics market in 2024, driven by strong demand for sustainable and locally grown produce. The United States leads with extensive adoption of commercial and community-based aquaponic farms supported by advanced technology and government funding. Favorable policies promoting urban agriculture and sustainable food systems enhance regional growth. For instance, companies like Upward Farms and Superior Fresh are expanding large-scale indoor aquaponic facilities. Rising consumer awareness of pesticide-free foods and growing investments in controlled environment agriculture continue to strengthen North America’s leadership in the global market.
Europe
Europe accounted for a 28.9% share in 2024, supported by strict environmental standards and increasing adoption of resource-efficient farming methods. Countries such as the Netherlands, Germany, and the United Kingdom are leading innovators in integrating aquaponics with renewable energy systems. Government incentives for low-carbon food production and research funding for circular agriculture models are driving adoption. For instance, Urban Farmers AG in Switzerland operates rooftop aquaponic systems that supply fresh vegetables and fish to urban markets. The region’s focus on sustainable urban farming and carbon-neutral food systems supports steady market expansion.
Asia Pacific
Asia Pacific captured a 24.7% market share in 2024 and is projected to record the fastest growth through 2032. Expanding population, rising seafood consumption, and limited arable land are fueling aquaponics adoption across China, India, Japan, and Australia. Government programs promoting food security and water-efficient agriculture are further stimulating market development. For instance, Japan’s ECF Farmsystems and China’s Green Renaissance are investing in modular aquaponic units for urban areas. Increasing interest from agritech startups and strong investments in greenhouse technology position Asia Pacific as a key growth region for future aquaponic development.
Latin America
Latin America held a 5.2% share in 2024, driven by growing interest in sustainable farming across Brazil, Mexico, and Chile. Rising awareness of resource-efficient cultivation methods and the expansion of urban agriculture initiatives are fueling demand. Countries are investing in aquaponics to enhance food independence and reduce import reliance. For instance, Brazilian startups are deploying small-scale aquaponic systems for organic produce in urban regions. Supportive educational programs and international collaborations are helping strengthen local expertise, driving the region’s gradual integration of aquaponic systems into commercial and community farming.
Middle East & Africa
The Middle East & Africa accounted for a 2.8% share in 2024, reflecting steady progress in sustainable agriculture initiatives. Water scarcity and arid conditions have encouraged the adoption of aquaponics as an alternative food production method. Countries such as the UAE, Saudi Arabia, and South Africa are investing in smart farming projects to enhance local food production. For instance, Emirates Aquatech operates advanced aquaponic farms integrating solar power for water circulation and temperature control. Increasing investments in agri-tech and public-private partnerships are expected to support long-term market growth across this region.
Market Segmentations:
By Equipment
- Pumps & Valves
- Grow Light
- Aeration Systems
- Others
By Component
- Settling Basin
- Bio-Filters
- Sump Tank
- Others
By Facility Type
- Greenhouse
- Building Based Indoor Farms
- Others
By Growing Mechanism
- Media Filled Grow Beds
- Nutrient Film Technique (NFT)
- Deep Water Culture (DWC)
- Application Aquaponics
By Geography
- North America
- Europe
- Germany
- France
- U.K.
- Italy
- Spain
- Rest of Europe
- Asia Pacific
- China
- Japan
- India
- South Korea
- South-east Asia
- Rest of Asia Pacific
- Latin America
- Brazil
- Argentina
- Rest of Latin America
- Middle East & Africa
- GCC Countries
- South Africa
- Rest of the Middle East and Africa
Competitive Landscape
The competitive landscape of the aquaponics market is defined by innovation, sustainability, and strategic partnerships among leading players such as Hydrofarm Holdings Group, Inc., Practical Aquaponics (Pty) Ltd, My Aquaponics, Aquaponic Lynx LLC, Greenlife Aquaponics, Portable Farms Aquaponics Systems, Nelson and Pade Aquaponics, Pentair Aquatic Eco-System, Inc. (PAES), Backyard Aquaponics Pty Ltd, and The Aquaponic Source. These companies focus on developing efficient and scalable aquaponic systems tailored for both commercial and residential applications. Continuous investment in automated monitoring technologies, energy-efficient pumps, and biofiltration systems drives market competitiveness. Firms are expanding their global footprint through distribution partnerships, R&D collaborations, and product diversification in modular and greenhouse-based systems. The integration of IoT-enabled sensors and renewable energy solutions is further enhancing operational efficiency. With rising demand for sustainable farming practices, players are prioritizing cost reduction, environmental optimization, and education-based outreach to strengthen their market positioning worldwide.
Shape Your Report to Specific Countries or Regions & Enjoy 30% Off!
Key Player Analysis
Recent Developments
- In November 2025, Hydrofarm Holdings Group, Inc. reduced its manufacturing footprint by nearly 60 % since early 2023 while shifting toward proprietary brands—part of its strategy to support controlled-environment agriculture including aquaponics.
- In March 2025, Nelson and Pade, Inc. introduced its “Aquaponics 360” system, which integrates IoT-enabled sensors and AI-driven monitoring to optimise fish and plant production.
- In November 2024, Nelson and Pade introduced new aquaponic systems designed to make starting an aquaponic farm more accessible.
Report Coverage
The research report offers an in-depth analysis based on Equipment, Component, Facility Type, Growing Mechanism and Geography. It details leading market players, providing an overview of their business, product offerings, investments, revenue streams, and key applications. Additionally, the report includes insights into the competitive environment, SWOT analysis, current market trends, as well as the primary drivers and constraints. Furthermore, it discusses various factors that have driven market expansion in recent years. The report also explores market dynamics, regulatory scenarios, and technological advancements that are shaping the industry. It assesses the impact of external factors and global economic changes on market growth. Lastly, it provides strategic recommendations for new entrants and established companies to navigate the complexities of the market.
Future Outlook
- Growing global focus on sustainable agriculture will continue to drive aquaponics adoption.
- Technological integration of IoT and AI will enhance system efficiency and real-time monitoring.
- Expansion of commercial greenhouse-based farms will boost large-scale production capacity.
- Increasing urban farming initiatives will promote compact and modular aquaponic systems.
- Government incentives for water-efficient farming will accelerate market penetration.
- Rising consumer preference for organic and locally grown produce will support market growth.
- Collaboration between agri-tech startups and research institutions will drive innovation.
- Integration of renewable energy sources will reduce operational costs and improve sustainability.
- Educational programs and training centers will strengthen awareness and adoption among small farmers.
- Asia Pacific will emerge as the fastest-growing market due to strong investments in smart and sustainable food systems.


