
Market Overview
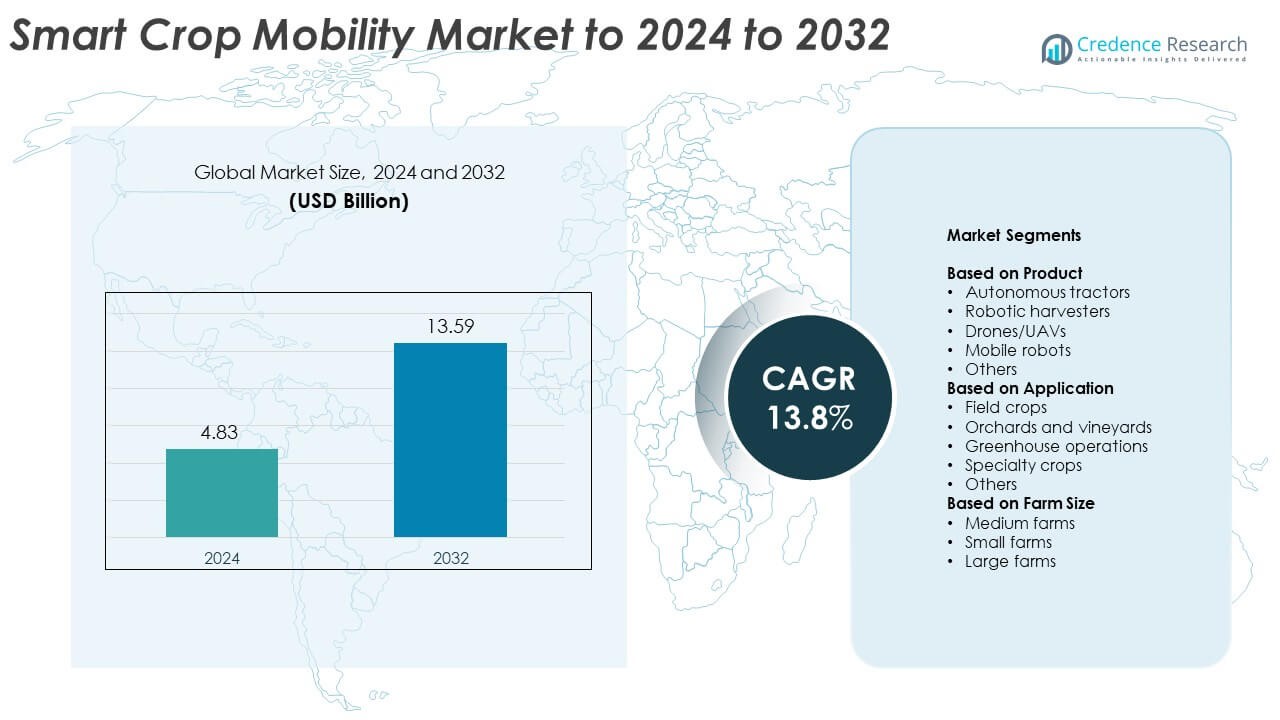
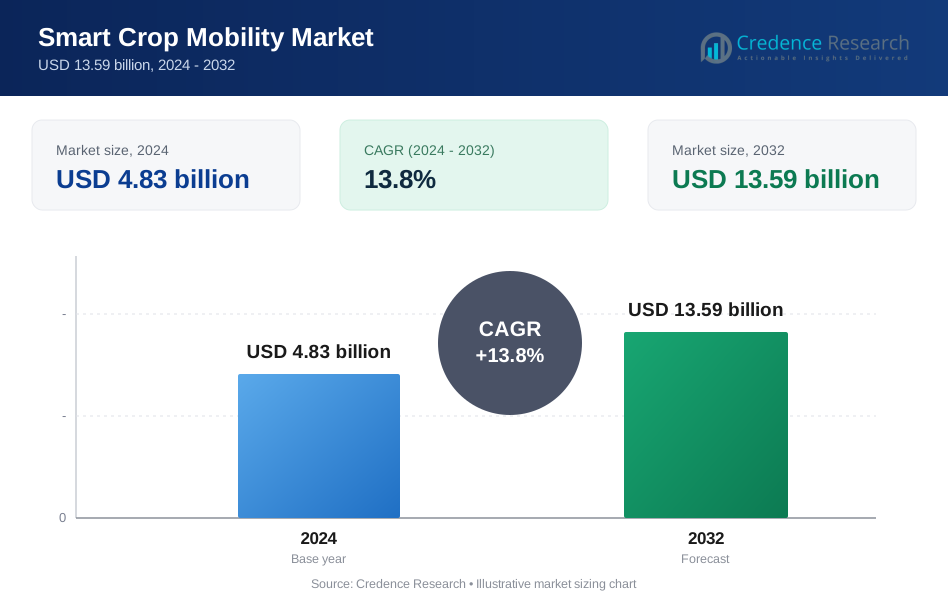
The Smart Crop Mobility Market size was valued at USD 4.83 billion in 2024 and is anticipated to reach USD 13.59 billion by 2032, at a CAGR of 13.8% during the forecast period.
| REPORT ATTRIBUTE | DETAILS |
|---|---|
| Historical Period | 2020-2023 |
| Base Year | 2024 |
| Forecast Period | 2025-2032 |
| Smart Crop Mobility Market Size 2024 | USD 4.83 Billion |
| Smart Crop Mobility Market, CAGR | 13.8% |
| Smart Crop Mobility Market Size 2032 | USD 13.59 Billion |
The Smart Crop Mobility market is led by major players such as Blue River Technology, Yara, Raven Industries, CNH Industrial, AgEagle Aerial Systems, Ag Leader Technology, BlueWhite, AGCO, Syngenta, Deere & Company, and Biz4Intellia. These companies focus on developing AI-driven autonomous tractors, drones, and robotic harvesters to enhance precision farming and operational efficiency. Strategic partnerships and technological advancements in IoT-enabled farm mobility systems strengthen their global competitiveness. North America emerged as the leading region in 2024, holding around 37.4% share, supported by large-scale adoption of smart agricultural machinery and strong digital infrastructure across the United States and Canada.
Market Insights
- The Smart Crop Mobility market was valued at USD 4.83 billion in 2024 and is projected to reach USD 13.59 billion by 2032, growing at a CAGR of 13.8%.
- Rising adoption of precision agriculture, automation in farming, and AI-based crop monitoring systems are key drivers boosting market growth globally.
- Integration of IoT, drones, and machine learning for data-driven crop management is a major trend improving productivity and sustainability.
- The market is highly competitive with leading companies focusing on AI-enabled machinery, sustainability, and strategic collaborations to enhance product performance.
- North America led with 37.4% share in 2024, followed by Europe with 28.6% and Asia-Pacific with 24.8%, while the drones/UAVs segment dominated overall with 36.8% share due to its efficiency in precision farming applications.
Market Segmentation Analysis:
By Product
The drones/UAVs segment dominated the Smart Crop Mobility market in 2024, accounting for around 36.8% share. This dominance is driven by their efficiency in crop monitoring, spraying, and precision mapping. Drones enable real-time data collection, improving yield forecasting and resource optimization. The segment benefits from the rapid adoption of AI-enabled imaging and GPS-based control systems. Autonomous tractors and robotic harvesters are also gaining traction as farms automate labor-intensive tasks, but drones remain preferred due to their versatility and lower operational cost in both large and small-scale agriculture.
- For instance, DJI’s Agras T40 has a 40 kg liquid spray load and a 50 kg solid spread load. The drone's maximum flight radius can be set to 2,000 meters. Under ideal conditions, the hovering time is 7 minutes when spraying with a full payload.
By Application
The field crops segment held the largest share of approximately 41.5% in 2024, supported by extensive deployment of smart mobility tools for cereals, grains, and oilseed cultivation. Automated tractors and drones enhance seeding precision, soil analysis, and pest control efficiency. Rising global demand for high-yield food crops and the need for sustainable farming practices continue to drive this segment. Meanwhile, greenhouse operations and orchards are adopting robotic harvesters and mobile platforms for selective picking and environmental monitoring, further expanding automation adoption across diverse crop environments.
- For instance, John Deere’s See & Spray Select reports an average 77% herbicide savings on fallow fields using camera-based weed detection.
By Farm Size
Large farms dominated the market in 2024 with nearly 44.2% share, owing to higher capital investment capacity and greater demand for automation in extensive agricultural areas. These farms leverage autonomous machinery and UAV systems to manage large-scale field operations efficiently. The shift toward digital farm management and cost reduction in long-term operations further drives adoption. Medium farms are increasingly integrating mobile robots for targeted crop management, while small farms remain slower adopters due to financial limitations but are expected to grow with the rise of affordable autonomous solutions.
Key Growth Drivers
Rising Adoption of Precision Agriculture
Precision agriculture adoption is a major growth driver for the Smart Crop Mobility market. Farmers increasingly use autonomous tractors, UAVs, and mobile robots for targeted spraying, soil monitoring, and planting optimization. This shift improves productivity and minimizes resource waste. Integration of IoT and AI technologies enables data-driven farming decisions, reducing dependency on manual labor. Governments and agritech firms promoting digital agriculture further strengthen this trend, ensuring wider deployment across developed and emerging regions.
- For instance, Trimble CenterPoint RTX guidance delivers <2.5 cm pass-to-pass accuracy for planting, spraying, and strip-till operations.
Labor Shortages in Agriculture
The growing shortage of skilled agricultural labor significantly drives automation in crop management. Autonomous machines such as robotic harvesters and drones offer efficient solutions for planting, monitoring, and harvesting. These systems ensure consistency and higher output with reduced workforce requirements. Rising operational costs and rural migration accelerate the adoption of mobile farming technologies. Agribusinesses are increasingly investing in automation to sustain yield levels and improve profitability across large and medium-scale farms.
- For instance, Carbon Robotics’ LaserWeeder uses AI-powered laser technology to eliminate weeds with sub-millimeter accuracy. Recent models, like the LaserWeeder G2 series, have significantly increased performance, with top-tier configurations capable of eliminating up to 10,000 weeds per minute and covering between 0.61 and 1.21 hectares (1.5 to 3.0 acres) per hour.
Government Support and Smart Farming Initiatives
Increasing government incentives for agricultural modernization serve as a strong growth driver. Policies promoting mechanization, digital farming infrastructure, and sustainable practices encourage farmers to invest in smart mobility systems. Subsidies for drones, GPS-guided tractors, and AI-based analytics tools accelerate technology adoption. Public-private collaborations also expand R&D efforts in robotics and data analytics for agriculture. These initiatives collectively foster growth and help bridge the digital divide in global farming ecosystems.
Key Trends & Opportunities
Integration of AI and Machine Learning
AI and machine learning are reshaping the Smart Crop Mobility market through predictive analytics and automation. Advanced algorithms help optimize crop health monitoring, pest detection, and irrigation scheduling. AI-enabled drones and robotic harvesters improve yield estimation accuracy. Continuous data analysis supports smarter decisions, lowering input costs. The trend enhances precision, sustainability, and profitability, making farms more resilient to environmental fluctuations and labor constraints.
- For instance, Ecorobotix’s ARA precision sprayer achieved 60–98% herbicide savings across nearly 3,000 onion-field missions, with many missions around 80% savings.
Expansion of IoT-Enabled Farming Networks
IoT integration is creating connected farming ecosystems that enhance mobility and real-time management. Smart sensors, GPS units, and mobile robots share continuous data to improve operational efficiency. These networks help farmers track machinery performance, soil conditions, and weather data remotely. The trend promotes scalability and better resource use across different farm sizes. Partnerships between agritech startups and telecom firms are further expanding IoT adoption in rural and semi-urban regions.
- For instance, Bayer’s Climate FieldView operates in 23 countries on more than 250 million subscribed acres, enabling machine-to-cloud agronomic data flow.
Emergence of Energy-Efficient Autonomous Machines
Energy-efficient robotic systems are gaining traction as sustainability becomes a global agricultural priority. Manufacturers are developing battery-powered and solar-assisted mobility systems to reduce fuel dependency. These advancements lower emissions and operational costs while improving endurance and field coverage. The opportunity lies in aligning automation with clean energy transitions, creating eco-friendly, cost-effective farming solutions that appeal to environmentally conscious producers.
Key Challenges
High Initial Investment and Maintenance Cost
The high cost of autonomous machinery, UAVs, and related technologies remains a major challenge. Small and medium farmers face financial constraints in acquiring and maintaining advanced systems. Integration of AI and IoT also demands skilled operation and regular software updates. Limited financing options and slow ROI hinder widespread adoption. Reducing hardware costs and expanding leasing or cooperative ownership models could help bridge this affordability gap.
Data Privacy and Connectivity Issues
Data security and limited internet access pose significant challenges in smart agriculture deployment. Farms rely heavily on cloud-based analytics and GPS systems for mobility management. Weak network infrastructure in rural areas affects data transmission reliability. Additionally, concerns about ownership and misuse of collected farm data deter adoption. Strengthening data protection frameworks and improving rural broadband coverage are essential for long-term scalability of smart crop mobility solutions.
Regional Analysis
North America North America dominated the Smart Crop Mobility market in 2024, holding around 37.4% share. The region’s leadership stems from widespread adoption of autonomous tractors, drones, and robotic harvesters across the United States and Canada. Strong investment in digital agriculture technologies, government support for precision farming, and large-scale farms drive regional demand. Collaborations between agritech firms and research institutions further promote innovation in AI-based mobility systems. The presence of advanced connectivity infrastructure and high awareness among farmers also contribute to the region’s continued dominance in smart agricultural solutions.
Europe
Europe accounted for approximately 28.6% share of the Smart Crop Mobility market in 2024. The region benefits from strong sustainability regulations and funding for precision farming under the EU’s Common Agricultural Policy. Farmers in countries such as Germany, France, and the Netherlands are rapidly deploying drones and autonomous machinery to enhance productivity and reduce carbon emissions. Growing focus on smart irrigation and resource efficiency accelerates adoption. The demand for AI-integrated crop management tools continues to expand as European farms shift toward digital and eco-friendly agricultural practices.
Asia-Pacific
Asia-Pacific held a 24.8% share of the Smart Crop Mobility market in 2024, driven by rapid adoption of robotics and IoT-enabled solutions in countries like China, Japan, and India. The region’s vast agricultural base and government programs promoting smart farming technologies support strong market growth. Increasing demand for food security and labor efficiency is fueling investments in drones and autonomous machinery. Rising agritech startups and pilot projects under national digital agriculture initiatives are further expanding adoption. The region’s focus on modernizing small and medium farms continues to boost market penetration.
Latin America
Latin America captured around 6.3% share of the Smart Crop Mobility market in 2024, supported by increasing use of drones and GPS-guided tractors for large-scale farming. Countries like Brazil, Argentina, and Mexico are embracing precision farming to improve crop yield and soil management. Rising agricultural exports and regional collaborations with global agritech providers are enhancing adoption rates. However, high equipment costs and limited digital infrastructure constrain faster growth. Ongoing government programs and agribusiness modernization efforts are expected to expand the deployment of smart mobility solutions in the coming years.
Middle East & Africa
The Middle East & Africa region held nearly 2.9% share of the Smart Crop Mobility market in 2024. Adoption is gradually increasing, particularly in Gulf nations and South Africa, due to growing interest in sustainable and automated farming. Water scarcity challenges are encouraging the use of AI-driven irrigation and monitoring systems. Governments are investing in agricultural innovation zones and pilot projects to boost productivity. Although adoption remains limited by infrastructure and capital constraints, the region shows strong potential for future growth as smart farming technologies become more affordable and accessible.
Market Segmentations:
By Product
- Autonomous tractors
- Robotic harvesters
- Drones/UAVs
- Mobile robots
- Others
By Application
- Field crops
- Orchards and vineyards
- Greenhouse operations
- Specialty crops
- Others
By Farm Size
- Medium farms
- Small farms
- Large farms
By Geography
- North America
- U.S.
- Canada
- Mexico
- Europe
- Germany
- France
- U.K.
- Italy
- Spain
- Rest of Europe
- Asia Pacific
- China
- Japan
- India
- South Korea
- South-east Asia
- Rest of Asia Pacific
- Latin America
- Brazil
- Argentina
- Rest of Latin America
- Middle East & Africa
- GCC Countries
- South Africa
- Rest of the Middle East and Africa
Competitive Landscape
The Smart Crop Mobility market features key players such as Blue River Technology, Yara, Raven Industries, CNH Industrial, AgEagle Aerial Systems, Ag Leader Technology, BlueWhite, AGCO, Syngenta, Deere & Company, and Biz4Intellia. The competitive landscape is shaped by continuous innovation in autonomous machinery, AI-enabled drones, and smart sensors that enhance precision farming. Companies focus on integrating advanced analytics, GPS navigation, and IoT connectivity into mobility systems to improve efficiency and reduce labor dependency. Strategic collaborations with agritech startups and agricultural cooperatives are strengthening market reach across regions. Firms are also expanding R&D investments to develop energy-efficient and sustainable solutions aligned with eco-friendly agricultural goals. Growing emphasis on digital farm management platforms and subscription-based models further intensifies competition. The market remains dynamic as players pursue partnerships, mergers, and technological advancements to gain a competitive edge in automation-driven crop management.
Key Player Analysis
- Blue River Technology
- Yara
- Raven Industries
- CNH Industrial
- AgEagle Aerial Systems
- Ag Leader Technology
- BlueWhite
- AGCO
- Syngenta
- Deere & Company
- Biz4Intellia
Recent Developments
- In 2025, Bluewhite launched its GEN 4 autonomous solution, powered by the NVIDIA AGX Orin platform. This AI-driven technology is designed for large-scale farming applications.
- In 2023, CNH Industrial won a Good Design Award for its CR11 Combine Harvester and T4 Electric Power Tractor
- In 2023, AGCO and Trimble announced a joint venture to create a new global leader in mixed-fleet precision agriculture technology, named PTx Trimble
Report Coverage
The research report offers an in-depth analysis based on Product, Application, Farm Size and Geography. It details leading market players, providing an overview of their business, product offerings, investments, revenue streams, and key applications. Additionally, the report includes insights into the competitive environment, SWOT analysis, current market trends, as well as the primary drivers and constraints. Furthermore, it discusses various factors that have driven market expansion in recent years. The report also explores market dynamics, regulatory scenarios, and technological advancements that are shaping the industry. It assesses the impact of external factors and global economic changes on market growth. Lastly, it provides strategic recommendations for new entrants and established companies to navigate the complexities of the market.
Future Outlook
- The market will expand rapidly as precision farming becomes essential for global food security.
- AI and machine learning integration will enhance autonomous decision-making in crop management.
- Demand for drones and mobile robots will rise due to their versatility and low operating cost.
- Governments will increase subsidies and digital farming initiatives to promote technology adoption.
- Connectivity improvements in rural areas will accelerate real-time data sharing and smart monitoring.
- Partnerships between agritech startups and equipment manufacturers will boost innovation.
- Energy-efficient and solar-powered autonomous machines will gain strong traction.
- Medium and small farms will increasingly adopt shared or leasing models for automation.
- Data analytics will drive predictive farming, improving yield and reducing waste.
- Emerging markets in Asia-Pacific and Latin America will become major growth contributors.
Request a Free Sample
Fill in your details and we'll send you a free sample report.
- Sample data tables & charts
- Research methodology
Need a Custom Version of This Report?
Tailor the scope, geography, or segments to your exact requirements.
- Custom geography or segment scope
- Direct access to our analyst team
Frequently Asked Questions
What is the current market size for Smart Crop Mobility Market, and what is its projected size in 2032?
At what Compound Annual Growth Rate is the Smart Crop Mobility Market projected to grow between 2025 and 2032?
Which Smart Crop Mobility Market segment held the largest share in 2024?
What are the primary factors fueling the growth of the Smart Crop Mobility Market?
Who are the leading companies in the Smart Crop Mobility Market?
Which region commanded the largest share of the Smart Crop Mobility Market in 2024?
Table of Content
Chapter 1. Report Introduction
- 1.1 Report Description & Purpose
- 1.1.1 Report Title & Market Definition
- 1.1.2 Unique Selling Propositions (USP) & Key Differentiators
- 1.1.3 Value Proposition for Stakeholders
- 1.2 Research Objectives
- 1.2.1 Market Sizing Objectives (Volume & Revenue)
- 1.2.2 Segmentation Objectives
- 1.2.3 Competitive Intelligence Objectives
- 1.2.4 Forecast & Scenario Objectives
- 1.3 Report Scope
- 1.3.1 Smart Crop Mobility Scope – Types & Subtypes Covered
- 1.3.2 Geographic Scope – Regions & Countries Covered
- 1.3.3 Historical Period, Base Year & Forecast Period (2024; forecast to 2032)
- 1.3.4 Inclusions & Exclusions
- 1.4 HS Code & Classification Framework
- 1.5 Currency, Units & Pricing Basis
- 1.6 Target Stakeholders
- 1.7 Limitations & Assumptions
Chapter 2. Executive Summary
- 2.1 Global Smart Crop Mobility Market Snapshot
- 2.1.1 Market Size – Historical (2024) & Forecast (2024-2032) (2024: USD 4.83 billion → 2032: USD 13.59 billion)
- 2.1.2 Volume & Revenue – Global Totals
- 2.1.3 Key Market Highlights – Top Five Facts
- 2.2 Smart Crop Mobility Market Segmentation Snapshot
- 2.2.1 Market Split by Region – 2024 vs. 2032
- 2.3 Competitive Snapshot
- 2.3.1 Top 10 Players by Revenue Share – 2024
- 2.3.2 Top 10 Players by Volume Share – 2024
- 2.3.3 Recent Strategic Developments (18-Month Summary)
- 2.4 Key Investment Highlights & Strategic Conclusions
Chapter 3. Smart Crop Mobility Market Dynamics & Industry Analysis
- 3.1 Market Overview & Context
- 3.1.1 Smart Crop Mobility Market Position in the Broader Automotive Value Chain
- 3.1.2 OEM vs. Replacement Market Dynamics
- 3.1.3 Market Maturity & Development Stage by Region
- 3.2 Smart Crop Mobility Market Drivers
- 3.3 Smart Crop Mobility Market Restraints & Challenges
- 3.4 Smart Crop Mobility Market Opportunities
- 3.5 Porter's Five Forces Analysis
- 3.5.1 Threat of New Entrants
- 3.5.2 Bargaining Power of Suppliers
- 3.5.3 Bargaining Power of Buyers
- 3.5.4 Threat of Substitutes
- 3.5.5 Competitive Rivalry – Intensity Assessment
- 3.6 Smart Crop Mobility Value Chain Analysis
- 3.6.1 Upstream – Raw Material/Input Suppliers
- 3.6.1.1 Raw Material/Input 1
- 3.6.1.2 Raw Material/Input 2
- 3.6.1.3 Raw Material/Input 3
- 3.6.2 Midstream – Production/Manufacturing/Service Delivery
- 3.6.2.1 Production/Process Overview
- 3.6.2.2 Key Facility Locations & Capacity by Manufacturer
- 3.6.3 Downstream – Distribution & End Consumer
- 3.6.3.1 Primary Channel – B2B/OEM
- 3.6.3.2 Secondary Channels – Dealer, Retail, Online, Direct
- 3.6.4 Value Chain Profitability Analysis
- 3.6.1 Upstream – Raw Material/Input Suppliers
- 3.7 PESTEL Analysis
- 3.7.1 Political Factors
- 3.7.2 Economic Factors
- 3.7.3 Social Factors
- 3.7.4 Technological Factors
- 3.7.5 Environmental Factors
- 3.7.6 Legal Factors
- 3.8 Smart Crop Mobility Supply Chain Analysis
- 3.8.1 Raw Material/Input Supply Risk Assessment
- 3.8.2 Manufacturing Concentration Risk (Geographic Exposure)
- 3.8.3 Trade Disruption Impact Analysis
- 3.9 Regulatory & Policy Landscape
Note: The regulatory and policy landscape section covers regulations based on their applicability to the market, Smart Crop Mobility category, geography, and scope of the study. Only regulatory frameworks with a material impact on operations, compliance, trade, sustainability, or market access are analyzed in detail.
Chapter 4. Key Investment Pockets & Opportunity Analysis
- 4.1 Smart Crop Mobility Market Attractiveness Analysis
- 4.1.1 By Region – Investment Attractiveness Matrix (Volume × CAGR)
- 4.2 Absolute Revenue Growth Opportunity
- 4.2.1 By Region – Absolute USD Growth Through 2032
- 4.3 Incremental Volume Opportunity
- 4.3.1 By Region – Incremental Volume Through 2032
- 4.3.2 Segment – Incremental Volume
- 4.4 Emerging Submarket Opportunity Deep Dive (Subject to Applicability)
- 4.5 Emerging Market Opportunity Scorecards
- 4.5.1 United States
- 4.5.2 Europe
- 4.5.3 Asia
- 4.5.4 Middle East & Africa
Note: Emerging Market Opportunity Scorecards will be included based on relevance and strategic importance. Regions listed are indicative and may vary depending on data availability and market dynamics.
Chapter 5. Smart Crop Mobility Import-Export Analysis & Trade Flows
- 5.1 Global Trade Overview
- 5.1.1 Global Export Value by Country (2024)
- 5.1.2 Global Export Volume by Country (2024)
- 5.1.3 Global Import Value by Country (2024)
- 5.1.4 Global Import Volume by Country (2024)
- 5.1.5 Net Trade Balance by Country (2024)
- 5.2 Export Analysis – Segment
- 5.2.1 Type 1 (HS Code)
- 5.2.2 Type 2 (HS Code)
- 5.2.3 Type 3 (HS Code)
- 5.2.4 Type 4 (HS Code)
- 5.2.5 Type 5 (HS Code)
- 5.3 Import Analysis – Segment
- 5.3.1 Type 1 (HS Code)
- 5.3.2 Type 2 (HS Code)
- 5.3.3 Type 3 (HS Code)
- 5.3.4 Type 4 (HS Code)
- 5.3.5 Type 5 (HS Code)
- 5.4 Average Unit Trade Prices
- 5.4.1 Average Export Price – Segment & Country
- 5.4.2 Average Import Price – Segment & Source Country
- 5.4.3 Price Trends (2024)
- 5.5 Key Trade Route Analysis
- 5.5.1 Trade Route 1
- 5.5.2 Trade Route 2
- 5.5.3 Trade Route 3
- 5.5.4 Trade Route 4
- 5.5.5 Trade Route 5
- 5.6 Trade Policy Impact Assessment
- 5.6.1 US Anti-Dumping & Section 301 Tariffs
- 5.6.2 EU Customs Union Impact
- 5.6.3 Major Free Trade Agreements
- 5.6.4 USMCA Rules of Origin
Note: Trade policy analysis will be included only where relevant to the Smart Crop Mobility market.
Chapter 6. Competitive Landscape & Company Benchmarking
- 6.1 Smart Crop Mobility Market Concentration & Structure
- 6.1.1 Herfindahl-Hirschman Index (HHI) – vs. 2024
- 6.1.2 Tier 1, Tier 2 & Tier 3 Market Structure
- 6.1.3 Global, Regional & Local Player Dynamics
- 6.2 Smart Crop Mobility Market Share Analysis – 2024
- 6.2.1 Global Revenue Share by Company
- 6.2.2 Global Volume Share by Company
- 6.2.3 Regional Revenue Share
- 6.2.4 Market Share Evolution ( vs. 2024)
- 6.2.5 OEM Segment Share by Company
- 6.2.6 Replacement Segment Share by Company
- 6.3 Production/Delivery Capacity & Facility Analysis
- 6.3.1 Global Installed Capacity
- 6.3.2 Capacity Utilization Rates
- 6.3.3 Production/Output Volume
- 6.3.4 Facility Locations & Capacity Map
- 6.3.5 Planned Capacity Additions
- 6.4 Smart Crop Mobility Competitive Benchmarking Matrix
- 6.4.1 Revenue, Volume, CAGR & Profitability Comparison
- 6.4.2 Channel Revenue Mix
- 6.4.3 Geographic Revenue Exposure
- 6.4.4 R&D Intensity
- 6.4.5 Sustainability Maturity
- 6.5 Strategic Developments in Smart Crop Mobility (Last 24 Months)
- 6.5.1 Mergers, Acquisitions & Divestments
- 6.5.2 New Smart Crop Mobility Launches
- 6.5.3 Facility Expansions
- 6.5.4 Strategic Alliances, Joint Ventures & Partnerships
- 6.5.5 Distribution Expansion & Market Entry
- 6.5.6 Sustainability & ESG Initiatives
- 6.6 Competitive Strategy Mapping
- 6.6.1 Leader, Challenger, Follower & Niche Classification
- 6.6.2 Pricing Strategy Comparison
- 6.6.3 Channel Strategy Matrix
Note: Strategic developments are included based on their materiality and the availability of reliable information.
Chapter 7. Global Smart Crop Mobility Market – By Distribution Channel
- 7.1 Segment Overview
- 7.1.1 Volume & Revenue Split by Channel (2024 & 2032)
- 7.1.2 Channel Mix Evolution (2024-2032)
Chapter 8. Regional Market Analysis – Global Overview
- 8.1 Global Regional Overview
- 8.1.1 Regional Volume Share
- 8.1.2 Regional Revenue Share
- 8.1.3 Regional Volume by Region
- 8.1.4 Regional Revenue by Region
- 8.1.5 Regional Forecast Through 2032
- 8.2 Cross-Regional Segment Analysis
- 8.2.1 By Distribution Channel
- 8.2.2 By Brand/Price Tier
Chapter 9. North America Smart Crop Mobility Market
- 9.1 United States
- 9.2 Canada
- 9.3 Mexico
Chapter 10. Europe Smart Crop Mobility Market
- 10.1 Germany
- 10.2 France
- 10.3 Italy
- 10.4 United Kingdom
- 10.5 Spain
- 10.6 Poland
- 10.7 Russia
- 10.8 Netherlands
- 10.9 Belgium
- 10.10 Sweden
- 10.11 Denmark
- 10.12 Norway
- 10.13 Rest of Europe
Chapter 11. Asia Pacific Smart Crop Mobility Market
- 11.1 China
- 11.2 India
- 11.3 Japan
- 11.4 South Korea
- 11.5 Thailand
- 11.6 Indonesia
- 11.7 Vietnam
- 11.8 Malaysia
- 11.9 Australia
- 11.10 Rest of Asia Pacific
Chapter 12. Latin America Smart Crop Mobility Market
- 12.1 Brazil
- 12.2 Argentina
- 12.3 Colombia
- 12.4 Chile
- 12.5 Rest of Latin America
Chapter 13. Middle East Smart Crop Mobility Market
- 13.1 Saudi Arabia
- 13.2 United Arab Emirates
- 13.3 Turkey
- 13.4 Israel
- 13.5 Iran
- 13.6 Rest of the Middle East
Chapter 14. Africa Smart Crop Mobility Market
- 14.1 South Africa
- 14.2 Egypt
- 14.3 Nigeria
- 14.4 Morocco
- 14.5 Rest of Africa
Chapter 15. Smart Crop Mobility Company Profiles
- 15.1 [Company 01]
- 15.1.1 Company Overview
- 15.1.2 Key Management Personnel
- 15.1.3 Products & Services Portfolio
- 15.1.4 Financial Performance
- 15.1.5 Key Market Focus & Geographic Presence
- 15.1.6 Recent Developments & Strategic Initiatives
Note: The company profile list is preliminary and may change based on research findings, market developments, data availability, and client requirements.
Chapter 16. Appendices
- Appendix A – List of Abbreviations & Acronyms
- Appendix B – Industry Classification Code Reference – Full Series
- Appendix C – Production & Capacity Data Tables
- Appendix D – End-Use & Demand Base Tables
- Appendix E – Consumption & Replacement Rate Assumptions
- Appendix F – ASP Reference Tables
- Appendix G – Manufacturing & Facility Database
- Appendix H – Import-Export Data Tables
- Appendix I – Regulatory Summary Tables
- Appendix J – Primary Research Participant List (Anonymized)
- Appendix K – Primary Research Questionnaire Framework
- Appendix L – Data Sources & Bibliography
- Appendix M – Market Size Divergence & Source Comparison
Chapter 17. Research Methodology
- 17.1 Research Framework & Philosophy
- 17.2 Secondary Research – Sources, Hierarchy & Data Extraction
- 17.3 Data Modeling – Bottom-Up & Top-Down Market Sizing
- 17.4 Primary Research – Stakeholder Framework, LOI & Sample Sizes
- 17.5 Forecast Methodology – Regression, Scenario & Sensitivity Analysis
- 17.6 Quality Control – Four-Layer Validation Framework
- 17.7 Limitations & Standard Assumptions
- 17.8 Disclaimer
