
Market Overview
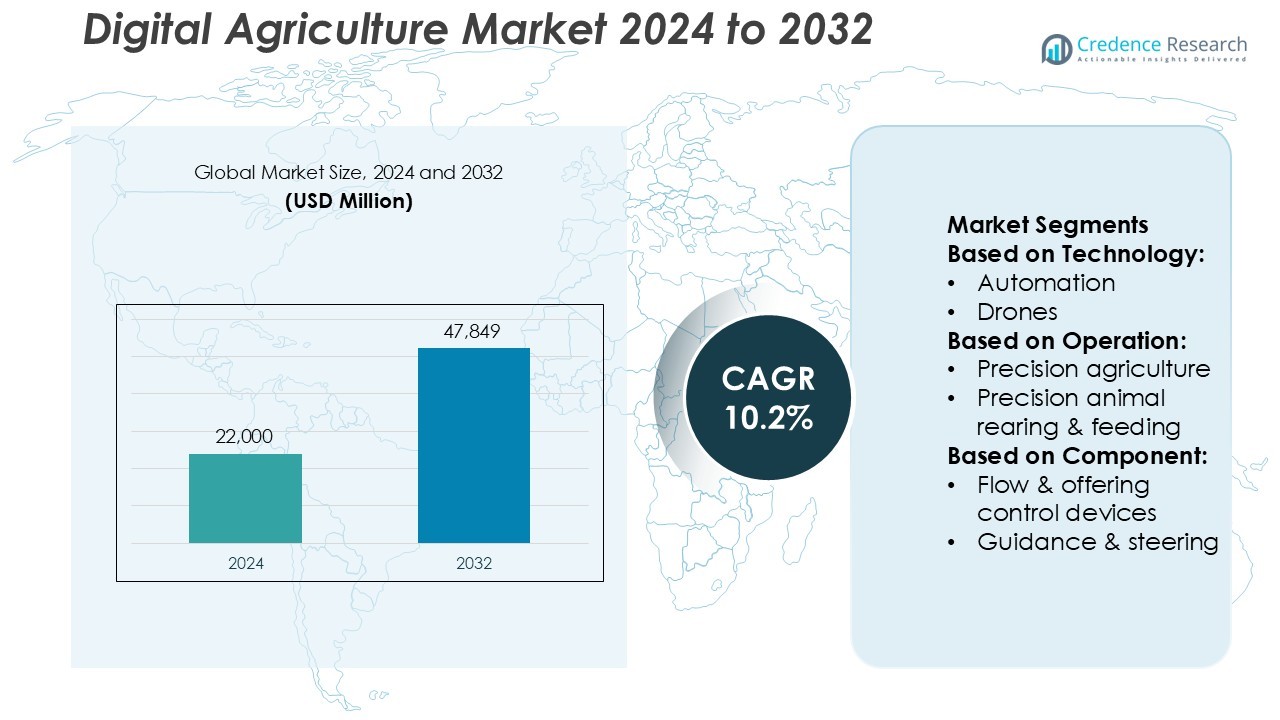
Digital Agriculture Market size was valued USD 22,000 million in 2024 and is anticipated to reach USD 47,849 million by 2032, at a CAGR of 10.2% during the forecast period.
| REPORT ATTRIBUTE | DETAILS |
|---|---|
| Historical Period | 2020-2023 |
| Base Year | 2024 |
| Forecast Period | 2025-2032 |
| Digital Agriculture Market Size 2024 | USD 22,000 Million |
| Digital Agriculture Market, CAGR | 10.2% |
| Digital Agriculture Market Size 2032 | USD 47,849 Million |
The Digital Agriculture Market is driven by major players including IBM Corporation, Trimble Inc., Syngenta AG, Bayer AG, Cisco Systems, Inc., Accenture, AGCO Corporation, Farmers Edge Inc., AKVA Group, and Deere & Company. These companies focus on integrating advanced technologies such as AI, IoT, robotics, and cloud computing to enhance productivity and sustainability across farming operations. North America leads the global market with a 36% share, supported by strong technological infrastructure, government initiatives promoting smart farming, and high adoption of precision agriculture systems. Continuous innovation, strategic collaborations, and digital transformation efforts further strengthen the region’s dominance in digital agriculture advancements.
Market Insights
- The Digital Agriculture Market was valued at USD 22,000 million in 2024 and is projected to reach USD 47,849 million by 2032, growing at a CAGR of 10.2%.
- Rising adoption of precision agriculture and AI-based analytics drives efficiency in resource management and crop yield optimization.
- Advancements in IoT connectivity, drones, and cloud-based platforms continue to shape emerging market trends and enhance digital integration across farming operations.
- High implementation costs and limited digital infrastructure in developing regions remain major restraints to widespread adoption.
- North America leads the market with a 36% share, while the hardware segment dominates overall revenue due to increasing use of automation systems, GPS units, and UAVs in modern agriculture.
Market Segmentation Analysis:
By Technology
The core technology segment dominates the Digital Agriculture Market with the largest market share, driven by widespread use of automation, robotics, drones, and AI/ML systems. These technologies enhance operational precision, optimize input usage, and improve crop and livestock management efficiency. Automation and AI integration enable real-time decision-making through predictive analytics, improving yield forecasting and disease detection. Drone-based imaging and robotic machinery further support precision farming by reducing manual intervention and operational costs, positioning core technology as the foundation of digital transformation across modern agriculture systems.
- For instance, AKVA Group’s environmental sensor network “Akvasmart Multi Sensor” deploys up to six water-quality sensors and logs 12 parameters (including dissolved oxygen, salinity, temperature, depth/pressure) per instrument.
By Operation
Precision agriculture leads the market under the operation segment, accounting for the highest share due to its data-driven approach in optimizing field-level management. It relies on sensors, GPS mapping, and AI analytics to monitor soil conditions, crop growth, and irrigation needs. The technology helps farmers maximize yield and minimize waste by applying precise amounts of water, fertilizer, and pesticides. This approach also supports sustainability goals by reducing environmental impact. The rise of connected devices and cloud platforms continues to expand adoption among large-scale and smallholder farmers alike.
- For instance, Trimble’s NAV-900 guidance controller supports full multi-constellation GNSS (GPS, GLONASS, Galileo, BDS-III) and delivers positioning accuracy of better than 2.5 cm (≈1 inch) when used with the CenterPoint® RTX correction service.
By Component
Hardware represents the dominant component in the Digital Agriculture Market, contributing the largest revenue share. It includes automation and control systems, UAVs, GPS/GNSS units, irrigation controllers, and handheld devices that form the operational backbone of smart farming. Among these, drones and GPS systems drive the most adoption due to their accuracy in mapping, spraying, and navigation. The growing demand for connected equipment and sensor-based monitoring tools supports scalability in precision agriculture. Continuous innovation in automation and IoT-integrated devices strengthens hardware’s critical role in digital farm management.
Key Growth Drivers
- Rising Need for Precision and Resource Efficiency The growing pressure to optimize agricultural productivity with minimal input waste drives digital agriculture adoption. Technologies such as AI-driven analytics, IoT sensors, and satellite monitoring enable precise water, fertilizer, and pesticide management. These innovations improve crop yield while reducing environmental impact. Government programs supporting smart farming tools and sustainable practices further accelerate this transition. Farmers increasingly rely on data-based insights to boost profitability and manage unpredictable weather conditions effectively.
- For instance, Syngenta’s Cropwise® digital platform now integrates high-resolution satellite imagery at 3-metre spatial resolution with near-daily capture frequency, via its partnership with Planet Labs PBC, enabling farmers to monitor crop health globally.
- Expansion of IoT and Connected Devices in Agriculture The proliferation of IoT and connected devices is transforming farm operations through real-time monitoring and predictive analysis. Smart sensors track soil health, weather, and equipment efficiency, helping farmers make faster and more accurate decisions. Integration with mobile and cloud platforms ensures seamless data access across multiple devices. This connectivity enhances operational efficiency and reduces downtime. Continuous advances in sensor miniaturization and communication technologies further expand IoT integration across both large and small-scale farms.
- For instance, Cisco Systems, Inc. partnered with the ConSenso Project at the Tunasikia Farm in Utengule, Tanzania, deploying 65 solar-powered IoT sensors which collect data on soil conditions, sun exposure, carbon capture, insect activity and plants’ electrical fields.
- Growing Demand for Sustainable and Climate-Smart Farming Rising concerns about climate change and food security drive the shift toward sustainable farming practices. Digital agriculture tools such as smart irrigation, remote sensing, and automated machinery support resource conservation and emission reduction. Farmers adopt precision techniques to maintain soil health and biodiversity while meeting regulatory standards. Corporations and governments increasingly promote carbon-neutral farming initiatives. These developments create new opportunities for technology providers offering environmentally aligned agricultural solutions.
Key Trends & Opportunities
- Integration of Artificial Intelligence and Machine Learning AI and ML technologies are enhancing predictive modeling, crop health monitoring, and yield optimization. Machine learning algorithms analyze historical and real-time data to identify pest outbreaks, nutrient deficiencies, and ideal planting schedules. Automated decision-support systems empower farmers with actionable insights. Companies developing AI-driven farm management software experience growing demand from both commercial and smallholder farms. The trend supports greater scalability and precision in digital agriculture applications worldwide.
- For instance, Accenture’s report found that organisations with fully modernised, AI-led processes achieved 2.5 × higher revenue growth, 2.4 × greater productivity, and 3.3 × greater success at scaling generative-AI use cases compared to peers.
- Adoption of Drones and Robotics in Farm Operations The use of drones and robotic equipment for crop spraying, seeding, and surveillance continues to grow rapidly. Drones provide aerial imagery for accurate field mapping, while robotic harvesters improve operational speed and labor efficiency. These technologies address labor shortages and improve productivity. The expansion of autonomous systems in large-scale agriculture reflects ongoing investment in farm automation. Lower equipment costs and better battery life further enhance adoption across developing regions.
- For instance, Deere revealed its second-generation autonomy kit in January 2025 at CES 2025, featuring 16 individual cameras arranged to enable a full 360-degree field of view in large-scale agriculture machines.
- Growth of Data-Driven Agricultural Platforms Cloud-based data management platforms are emerging as key enablers of connected agriculture. These systems integrate farm data from IoT devices, satellite feeds, and sensors into unified dashboards. The trend supports predictive analytics and informed decision-making at scale. Agritech firms are partnering with software providers to offer customized digital ecosystems for farmers. As connectivity improves in rural regions, the use of digital platforms is expected to expand significantly.
Key Challenges
- High Implementation Costs and Limited Access Adoption of digital agriculture tools remains constrained by high upfront investment and infrastructure costs. Small and medium-scale farmers often face challenges in affording precision equipment, drones, and advanced analytics software. Lack of financing options and digital literacy widens the adoption gap between regions. These barriers slow market growth, particularly in developing economies with limited broadband coverage and technological readiness.
- Data Security and Interoperability Issues The increasing use of cloud and connected devices raises concerns regarding data privacy and interoperability. Farmers are cautious about sharing sensitive farm data with technology vendors due to security risks. Additionally, incompatibility between different software systems limits the efficiency of data integration. Establishing common data standards and improving cybersecurity frameworks remain key to building user trust and ensuring smooth operation across diverse agricultural technologies.
Regional Analysis
North America
North America holds the dominant position in the Digital Agriculture Market with a 36% share, driven by strong technological adoption and advanced farming infrastructure. The U.S. and Canada lead in precision agriculture, leveraging IoT sensors, AI analytics, and autonomous machinery for crop and livestock management. Government programs supporting smart farming and sustainability further accelerate digitalization. The region’s focus on optimizing yields and reducing operational costs fosters continuous innovation. Major agritech companies and research institutions actively invest in data-driven solutions, reinforcing North America’s leadership in digital transformation across agriculture.
Europe
Europe accounts for a 28% share of the global Digital Agriculture Market, supported by strong regulatory frameworks and sustainability-focused initiatives. The European Union’s Common Agricultural Policy encourages precision farming, smart irrigation, and eco-friendly resource use. Countries such as Germany, France, and the Netherlands invest heavily in automation and farm robotics. Adoption of satellite-based monitoring systems and data analytics enhances operational efficiency. Increasing demand for traceable, organic, and sustainable produce also drives technological implementation. Partnerships between agritech firms and research institutions continue to shape Europe’s advanced digital agriculture ecosystem.
Asia-Pacific
Asia-Pacific captures a 25% market share, emerging as the fastest-growing region due to rapid digitalization in agriculture. Countries like China, Japan, and India are adopting drones, IoT-based soil monitoring, and AI-powered farm analytics. Government-led programs promoting smart farming and rural connectivity strengthen adoption among smallholder farmers. Rising food demand, limited arable land, and climate variability drive innovation in precision technologies. Local startups and global corporations collaborate to develop cost-efficient digital farming solutions, enhancing productivity and sustainability across large agricultural economies in the region.
Latin America
Latin America represents a 7% share of the Digital Agriculture Market, with Brazil, Argentina, and Mexico leading adoption. Expanding agribusiness operations and a growing focus on precision farming drive regional growth. The use of GPS-guided equipment, smart irrigation, and crop monitoring drones supports yield optimization in large-scale farms. Limited digital infrastructure in remote areas remains a challenge but ongoing investments in connectivity and farm management software are improving access. Public-private partnerships and agritech innovation hubs are expected to accelerate the region’s shift toward data-driven agricultural practices.
Middle East & Africa
The Middle East & Africa region holds a 4% market share, showing gradual progress in adopting digital farming solutions. Smart irrigation, remote sensing, and greenhouse automation are key focus areas in countries such as Israel, the UAE, and South Africa. Water scarcity and climate variability drive the adoption of precision irrigation and controlled-environment agriculture. Regional governments are investing in agritech startups and training initiatives to improve digital literacy among farmers. While infrastructure limitations persist, rising food security concerns and technology partnerships are paving the way for long-term market growth.
Market Segmentations:
By Technology:
- Automation
- Drones
By Operation:
- Precision agriculture
- Precision animal rearing & feeding
By Component:
- Flow & offering control devices
- Guidance & steering
By Geography
- North America
- U.S.
- Canada
- Mexico
- Europe
- Germany
- France
- U.K.
- Italy
- Spain
- Rest of Europe
- Asia Pacific
- China
- Japan
- India
- South Korea
- South-east Asia
- Rest of Asia Pacific
- Latin America
- Brazil
- Argentina
- Rest of Latin America
- Middle East & Africa
- GCC Countries
- South Africa
- Rest of the Middle East and Africa
Competitive Landscape
The Digital Agriculture Market is highly competitive, featuring key players such as IBM Corporation, AKVA Group, Trimble Inc., Syngenta AG, Cisco Systems, Inc., Bayer AG, Accenture, AGCO Corporation, Farmers Edge Inc., and Deere & Company. The Digital Agriculture Market is characterized by intense competition and rapid technological advancement. Companies are focusing on integrating artificial intelligence, IoT, and automation to enhance agricultural productivity and sustainability. Strategic collaborations between technology firms, agribusinesses, and research institutions are fostering innovation in precision farming and data analytics. Continuous investments in cloud-based platforms, smart sensors, and autonomous machinery are transforming traditional farming into data-driven operations. The market also witnesses growing emphasis on sustainability, with companies developing solutions that reduce resource use and environmental impact. Strong R&D capabilities and regional expansion strategies remain central to maintaining a competitive edge.
Key Player Analysis
- IBM Corporation
- AKVA Group
- Trimble Inc.
- Syngenta AG
- Cisco Systems, Inc.
- Bayer AG
- Accenture
- AGCO Corporation
- Farmers Edge Inc.
- Deere & Company
Recent Developments
- In June 2025, Union Agriculture Minister Shri Shivraj Singh Chouhan proposed field-mounted solar panels under the PM-KUSUM scheme to transform farmers into renewable-energy suppliers.
- In April 2025, Farmers Edge Inc. partnered with Taurus Ag Marketing Inc. to expand access to high-quality soil testing solutions across Canada. Taurus will improve the availability of advanced lab services, delivering industry-leading turnaround times and tailored insights to support data-driven decisions for growers, agronomists, and agri-businesses.
- In July 2023, Deere & Company announced the acquisition of Smart Apply, Inc. The company planned to leverage Smart Apply’s precision spraying to assist growers in addressing the challenges associated with input costs, labor, regulatory requirements, and environmental goals.
Report Coverage
The research report offers an in-depth analysis based on Technology, Operation, Component and Geography. It details leading market players, providing an overview of their business, product offerings, investments, revenue streams, and key applications. Additionally, the report includes insights into the competitive environment, SWOT analysis, current market trends, as well as the primary drivers and constraints. Furthermore, it discusses various factors that have driven market expansion in recent years. The report also explores market dynamics, regulatory scenarios, and technological advancements that are shaping the industry. It assesses the impact of external factors and global economic changes on market growth. Lastly, it provides strategic recommendations for new entrants and established companies to navigate the complexities of the market.
Future Outlook
- The adoption of AI and machine learning will enhance predictive analytics in farming operations.
- Increasing use of IoT devices will improve real-time monitoring of crops and livestock.
- Drone and robotics technology will expand, reducing manual labor and improving precision.
- Cloud-based data platforms will streamline farm management and decision-making processes.
- Governments will introduce more incentives to promote smart and sustainable agriculture practices.
- Startups and tech companies will collaborate to develop affordable digital farming solutions.
- Demand for climate-smart technologies will grow as farmers adapt to changing weather patterns.
- Connectivity improvements in rural areas will accelerate the adoption of digital tools.
- Integration of blockchain will enhance transparency and traceability in the agricultural supply chain.
- Farmers will increasingly rely on data-driven insights to boost productivity and profitability.

Request a Free Sample
Fill in your details and we'll send you a free sample report.
- Sample data tables & charts
- Research methodology
Need a Custom Version of This Report?
Tailor the scope, geography, or segments to your exact requirements.
- Custom geography or segment scope
- Direct access to our analyst team
Frequently Asked Questions
What is the current market size for the Digital Agriculture Market, and what is its projected size in 2032?
At what Compound Annual Growth Rate is the Digital Agriculture Market projected to grow between 2025 and 2032?
Which Digital Agriculture Market segment held the largest share in 2024?
What are the primary factors fueling the growth of the Digital Agriculture Market?
Who are the leading companies in the Digital Agriculture Market?
Which region commanded the largest share of the Digital Agriculture Market in 2024?
Table of Content
Chapter 1. Report Introduction
- 1.1 Report Description & Purpose
- 1.1.1 Report Title & Market Definition
- 1.1.2 Unique Selling Propositions (USP) & Key Differentiators
- 1.1.3 Value Proposition for Stakeholders
- 1.2 Research Objectives
- 1.2.1 Market Sizing Objectives (Volume & Revenue) (Volume Where Applicable)
- 1.2.2 Segmentation Objectives
- 1.2.3 Competitive Intelligence Objectives
- 1.2.4 Forecast & Scenario Objectives
- 1.3 Report Scope
- 1.3.1 Digital Agriculture Scope – Segments & Subsegments Covered
- 1.3.2 Geographic Scope – Regions & Countries Covered
- 1.3.3 Historical Period, Base Year & Forecast Period (2024; forecast to 2032)
- 1.3.4 Inclusions & Exclusions
- 1.4 Industry Classification & Applicable Codes
- 1.5 Currency, Measurement Units & Valuation Basis
- 1.6 Target Stakeholders
- 1.7 Limitations & Assumptions
Chapter 2. Executive Summary
- 2.1 Global Digital Agriculture Market Snapshot
- 2.1.1 Market Size – Historical (2024) & Forecast (2024-2032) (2024: USD 22,000 million → 2032: USD 47,849 million)
- 2.1.2 Volume & Revenue – Global Totals (Volume Where Applicable)
- 2.1.3 Key Market Highlights – Top Five Facts
- 2.2 Digital Agriculture Market Segmentation Snapshot
- 2.2.1 Market Split by Region – 2024 vs. 2032
- 2.3 Competitive Snapshot
- 2.3.1 Top 10 Players by Revenue Share – 2024
- 2.3.2 Top 10 Players by Volume Share – 2024 (Volume Where Applicable)
- 2.3.3 Recent Strategic Developments (18-Month Summary)
- 2.4 Key Investment Highlights & Strategic Conclusions
Chapter 3. Digital Agriculture Market Dynamics & Industry Analysis
- 3.1 Market Overview & Context
- 3.1.1 Digital Agriculture Market Position in the Broader Industry Value Chain
- 3.1.2 Demand Structure & Purchasing Dynamics
- 3.1.3 Market Maturity & Development Stage by Region
- 3.2 Digital Agriculture Market Drivers
- 3.3 Digital Agriculture Market Restraints & Challenges
- 3.4 Digital Agriculture Market Opportunities
- 3.5 Porter's Five Forces Analysis
- 3.5.1 Threat of New Entrants
- 3.5.2 Bargaining Power of Suppliers
- 3.5.3 Bargaining Power of Buyers
- 3.5.4 Threat of Substitutes
- 3.5.5 Competitive Rivalry – Intensity Assessment
- 3.6 Digital Agriculture Value Chain Analysis
- 3.6.1 Upstream – Key Inputs, Resources & Suppliers
- 3.6.1.1 Key Input/Resource 1
- 3.6.1.2 Key Input/Resource 2
- 3.6.1.3 Key Input/Resource 3
- 3.6.2 Midstream – Core Operations & Value Creation
- 3.6.2.1 Operating Model & Process Overview
- 3.6.2.2 Key Operating Locations & Capabilities by Company
- 3.6.3 Downstream – Market Channels & End Users
- 3.6.3.1 Direct Sales & Customer Engagement Channels
- 3.6.3.2 Indirect Sales, Intermediaries & Partner Channels
- 3.6.4 Value Chain Profitability Analysis
- 3.6.1 Upstream – Key Inputs, Resources & Suppliers
- 3.7 PESTEL Analysis
- 3.7.1 Political Factors
- 3.7.2 Economic Factors
- 3.7.3 Social Factors
- 3.7.4 Technological Factors
- 3.7.5 Environmental Factors
- 3.7.6 Legal Factors
- 3.8 Digital Agriculture Supply Chain Analysis
- 3.8.1 Critical Input & Resource Availability Risk Assessment
- 3.8.2 Supplier & Operational Concentration Risk (Geographic Exposure)
- 3.8.3 Supply & Service Disruption Impact Analysis
- 3.9 Regulatory & Policy Landscape
Note: The regulatory and policy landscape section covers regulations based on their applicability to the market, Digital Agriculture category, geography, and scope of the study. Only regulatory frameworks with a material impact on operations, compliance, trade, sustainability, or market access are analyzed in detail.
Chapter 4. Key Investment Pockets & Opportunity Analysis
- 4.1 Digital Agriculture Market Attractiveness Analysis
- 4.1.1 By Region – Investment Attractiveness Matrix (Market Size × CAGR)
- 4.2 Absolute Revenue Growth Opportunity
- 4.2.1 By Region – Absolute Revenue Growth Through 2032
- 4.3 Incremental Demand Opportunity
- 4.3.1 By Region – Incremental Demand Through 2032
- 4.3.2 Segment – Incremental Demand
- 4.4 Emerging Submarket Opportunity Deep Dive (Subject to Applicability)
- 4.5 Priority Market Opportunity Scorecards
- 4.5.1 United States
- 4.5.2 Europe
- 4.5.3 Asia
- 4.5.4 Middle East & Africa
Note: Priority market opportunity scorecards reflect the geographic scope and strategic relevance of the study. Listed markets are indicative and may be adapted to the industry.
Chapter 5. Digital Agriculture Cross-Border Trade & Market Access Analysis
- 5.1 International Trade & Cross-Border Activity Overview
- 5.1.1 Global Export Value by Country (2024)
- 5.1.2 Global Export Volume by Country (2024) (Volume Where Applicable)
- 5.1.3 Global Import Value by Country (2024)
- 5.1.4 Global Import Volume by Country (2024) (Volume Where Applicable)
- 5.1.5 Net Trade Balance by Country (2024)
- 5.2 Export Analysis – Segment
- 5.2.1 Category 1 (Applicable Classification Code)
- 5.2.2 Category 2 (Applicable Classification Code)
- 5.2.3 Category 3 (Applicable Classification Code)
- 5.2.4 Category 4 (Applicable Classification Code)
- 5.2.5 Category 5 (Applicable Classification Code)
- 5.3 Import Analysis – Segment
- 5.3.1 Category 1 (Applicable Classification Code)
- 5.3.2 Category 2 (Applicable Classification Code)
- 5.3.3 Category 3 (Applicable Classification Code)
- 5.3.4 Category 4 (Applicable Classification Code)
- 5.3.5 Category 5 (Applicable Classification Code)
- 5.4 Cross-Border Pricing & Transaction Benchmarks
- 5.4.1 Export Pricing – Segment & Country
- 5.4.2 Import Pricing – Segment & Source Country
- 5.4.3 Price Trends (2024)
- 5.5 Key Cross-Border Trade & Delivery Routes
- 5.5.1 Cross-Border Trade/Delivery Route 1
- 5.5.2 Cross-Border Trade/Delivery Route 2
- 5.5.3 Cross-Border Trade/Delivery Route 3
- 5.5.4 Cross-Border Trade/Delivery Route 4
- 5.5.5 Cross-Border Trade/Delivery Route 5
- 5.6 Trade Policy & Market Access Impact Assessment
- 5.6.1 Tariff & Non-Tariff Barriers
- 5.6.2 Regional Trade & Economic Integration Frameworks
- 5.6.3 Bilateral & Multilateral Trade Agreements
- 5.6.4 Cross-Border Operating, Licensing & Localization Requirements
Note: This chapter applies where cross-border trade or delivery is relevant to Digital Agriculture. Goods, services, and digital offerings are assessed using applicable classifications and transaction measures. Import-export volumes, trade balances, and route analyses are included only where meaningful to the market.
Chapter 6. Competitive Landscape & Company Benchmarking
- 6.1 Digital Agriculture Market Concentration & Structure
- 6.1.1 Herfindahl-Hirschman Index (HHI) – vs. 2024
- 6.1.2 Leading, Mid-Sized & Emerging Player Structure
- 6.1.3 Global, Regional & Local Player Dynamics
- 6.2 Digital Agriculture Market Share Analysis – 2024
- 6.2.1 Global Revenue Share by Company
- 6.2.2 Global Volume Share by Company (Volume Where Applicable)
- 6.2.3 Regional Revenue Share
- 6.2.4 Market Share Evolution ( vs. 2024)
- 6.2.5 Company Market Share by Key Segment
- 6.2.6 Company Market Share by Customer Group
- 6.3 Operating Scale, Capacity & Infrastructure Analysis
- 6.3.1 Global Operating Scale & Supply Capacity
- 6.3.2 Resource Utilization & Operating Efficiency
- 6.3.3 Output, Service Delivery & Activity Metrics
- 6.3.4 Operating Footprint & Infrastructure Map
- 6.3.5 Planned Operational & Capacity Expansion
- 6.4 Digital Agriculture Competitive Benchmarking Matrix
- 6.4.1 Revenue, Growth, Profitability & Operating Metric Comparison
- 6.4.2 Channel Revenue Mix
- 6.4.3 Geographic Revenue Exposure
- 6.4.4 R&D Intensity
- 6.4.5 Sustainability Maturity
- 6.5 Strategic Developments in Digital Agriculture (Last 24 Months)
- 6.5.1 Mergers, Acquisitions & Divestments
- 6.5.2 New Products, Services & Solutions in Digital Agriculture
- 6.5.3 Operational & Infrastructure Expansions
- 6.5.4 Strategic Alliances, Joint Ventures & Partnerships
- 6.5.5 Distribution Expansion & Market Entry
- 6.5.6 Sustainability & ESG Initiatives
- 6.6 Competitive Strategy Mapping
- 6.6.1 Leader, Challenger, Follower & Niche Classification
- 6.6.2 Pricing Strategy Comparison
- 6.6.3 Channel Strategy Matrix
Note: Strategic developments are included based on their materiality and the availability of reliable information.
Chapter 7. Global Digital Agriculture Market – By Sales & Delivery Channel
- 7.1 Segment Overview
- 7.1.1 Volume & Revenue Split by Channel (2024 & 2032) (Volume Where Applicable)
- 7.1.2 Channel Mix Evolution (2024-2032)
Chapter 8. Regional Market Analysis – Global Overview
- 8.1 Global Regional Overview
- 8.1.1 Regional Volume Share (Volume Where Applicable)
- 8.1.2 Regional Revenue Share
- 8.1.3 Regional Volume by Region (Volume Where Applicable)
- 8.1.4 Regional Revenue by Region
- 8.1.5 Regional Forecast Through 2032
- 8.2 Cross-Regional Segment Analysis
- 8.2.1 By Sales & Delivery Channel
- 8.2.2 By Competitive Positioning & Price Tier
Chapter 9. North America Digital Agriculture Market
- 9.1 United States
- 9.2 Canada
- 9.3 Mexico
Chapter 10. Europe Digital Agriculture Market
- 10.1 Germany
- 10.2 France
- 10.3 Italy
- 10.4 United Kingdom
- 10.5 Spain
- 10.6 Poland
- 10.7 Russia
- 10.8 Netherlands
- 10.9 Belgium
- 10.10 Sweden
- 10.11 Denmark
- 10.12 Norway
- 10.13 Rest of Europe
Chapter 11. Asia Pacific Digital Agriculture Market
- 11.1 China
- 11.2 India
- 11.3 Japan
- 11.4 South Korea
- 11.5 Thailand
- 11.6 Indonesia
- 11.7 Vietnam
- 11.8 Malaysia
- 11.9 Australia
- 11.10 Rest of Asia Pacific
Chapter 12. Latin America Digital Agriculture Market
- 12.1 Brazil
- 12.2 Argentina
- 12.3 Colombia
- 12.4 Chile
- 12.5 Rest of Latin America
Chapter 13. Middle East Digital Agriculture Market
- 13.1 Saudi Arabia
- 13.2 United Arab Emirates
- 13.3 Turkey
- 13.4 Israel
- 13.5 Iran
- 13.6 Rest of the Middle East
Chapter 14. Africa Digital Agriculture Market
- 14.1 South Africa
- 14.2 Egypt
- 14.3 Nigeria
- 14.4 Morocco
- 14.5 Rest of Africa
Chapter 15. Digital Agriculture Company Profiles
- 15.1 [Company 01]
- 15.1.1 Company Overview
- 15.1.2 Key Management Personnel
- 15.1.3 Products & Services Portfolio
- 15.1.4 Financial Performance
- 15.1.5 Key Market Focus & Geographic Presence
- 15.1.6 Recent Developments & Strategic Initiatives
Note: The company profile list is preliminary and may change based on research findings, market developments, data availability, and client requirements.
Chapter 16. Appendices
- Appendix A – List of Abbreviations & Acronyms
- Appendix B – Industry Classification Code Reference – Full Series
- Appendix C – Supply, Output & Operating Capacity Data Tables
- Appendix D – End-Use & Demand Base Tables
- Appendix E – Demand, Adoption & Usage Assumptions
- Appendix F – Pricing & Revenue Metric Reference Tables
- Appendix G – Company Operations & Infrastructure Database
- Appendix H – Cross-Border Trade & Activity Data Tables (Where Applicable)
- Appendix I – Regulatory Summary Tables
- Appendix J – Primary Research Participant List (Anonymized)
- Appendix K – Primary Research Questionnaire Framework
- Appendix L – Data Sources & Bibliography
- Appendix M – Market Size Divergence & Source Comparison
Chapter 17. Research Methodology
- 17.1 Research Framework & Philosophy
- 17.2 Secondary Research – Sources, Hierarchy & Data Extraction
- 17.3 Data Modeling – Bottom-Up & Top-Down Market Sizing
- 17.4 Primary Research – Stakeholder Framework, LOI & Sample Sizes
- 17.5 Forecast Methodology – Regression, Scenario & Sensitivity Analysis
- 17.6 Quality Control – Four-Layer Validation Framework
- 17.7 Limitations & Standard Assumptions
- 17.8 Disclaimer
