Home » Agriculture » Smart Plantation Management Systems Market

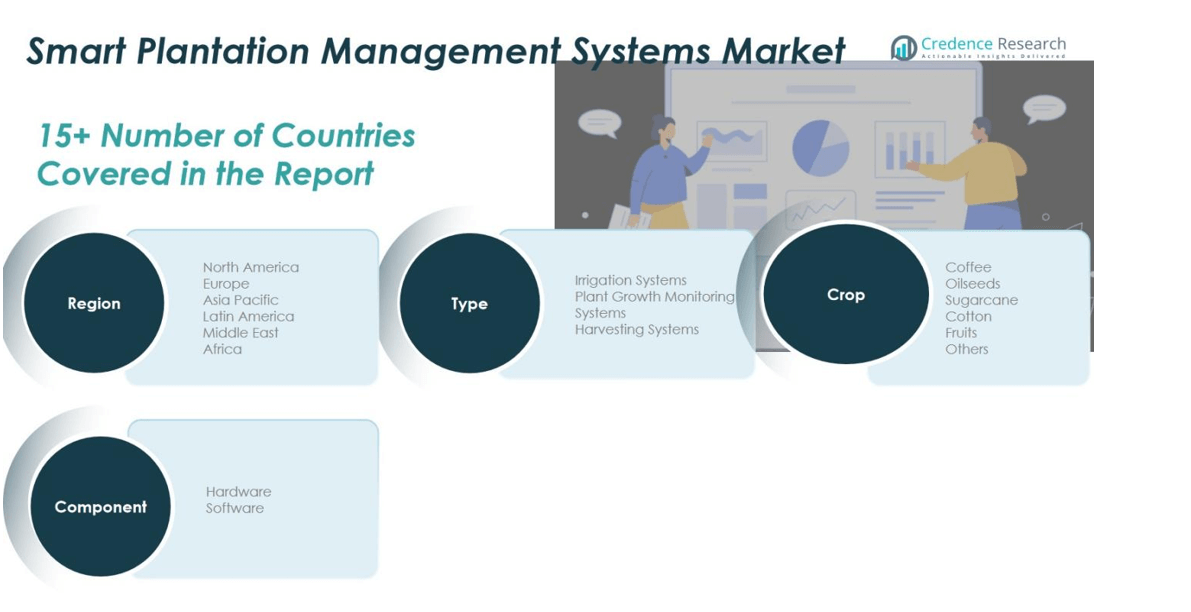
Smart Plantation Management Systems Market By Type (Irrigation System, Harvesting System, Plantation Growth Monitoring System), By Crop (Coffee, Oilseeds, Sugarcane, Fruits, Cotton, Others), By Component (Hardware, Software) – Growth, Share, Opportunities & Competitive Analysis, 2019 -2027

Price: $4699

Published: | Report ID: 10296 | Report Format : PDF

Rising investments towards smart plantation farming and growing awareness for optimized plantation system will boost the market.

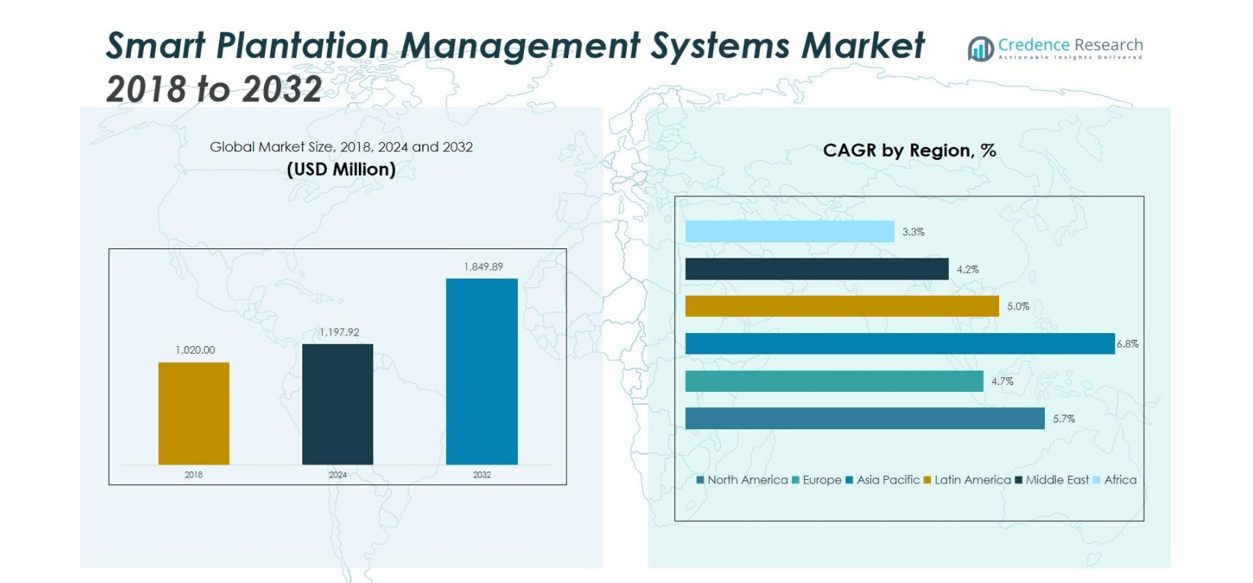
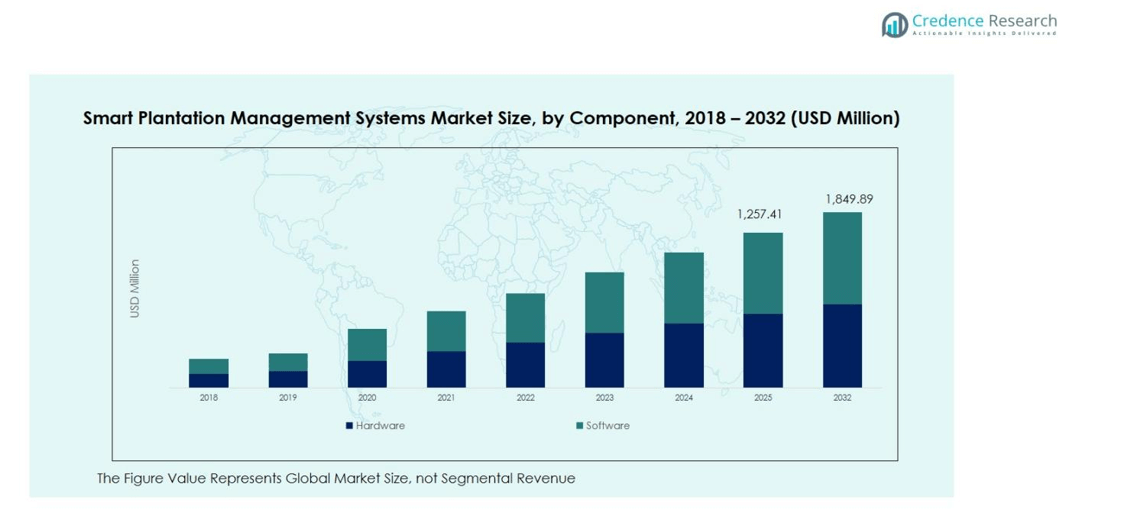
The global smart plantation management systems market is growing competently, expected to grow at a CAGR of 9.0% during the estimated period from 2019 to 2027, starting from US$ 1.26 Bn in 2018.

Rising adoption of new technologies like cloud computing and the internet of things (IoT) coupled with the introduction of the robotic system. Technological development like electronic systems and data transmission introduced essential changes to the agricultural working environment in recent years. In addition, the development of unmanned aerial vehicles (UAVs) with autonomous flight control systems and powerful and lightweight hyperspectral snapshot cameras is expected to improve the plantation management system. Moreover, the application of decision-tree models and advanced software platforms in smart plantation management systems allows farmers to differentiate between plant diseases based on optical information. For instance, Shivrai Technologies Private Limited, an IT solutions service provider, offers various integrated software platforms such as “FarmERP,” “FarmERP Lite,” and “Farm Gyan,” which provides an advanced level of analytics to support smart plantation management system.

Smart plantation management systems are projected to boost the market owing to site-specific weather forecasts, probability maps for diseases, yield projections, and disaster-based information, allowing the cultivation of crops optimally. Additionally, the application of technologies like supply chain farm robotics, machine learning, blockchain, and remote sensing in plantation management systems offers information regarding waste reduction, environmental sustainability, soil optimization, and analysis of agricultural facts.

Design Element 2

Access crucial information at unmatched prices!

Request your free sample report today & start making informed decisions powered by Credence Research!

Download Free Sample

CTA Design Element 3

Market Synopsis

Type Analysis

Increasing adoption of smart irrigation technologies and various government initiatives accounts to hold a higher revenue share across the market.

The irrigation systems segment is projected to hold the largest market value and dominate the smart plantation management systems market in 2019. Smart irrigation systems use sensors to control and monitor the watering schedule, thereby enhancing an optimized utilization of water required by plantation crops. Furthermore, the use of smart irrigation systems moderates the water requirements, owing to the reduction of operating costs for large farmland. For instance, according to the International Center for Water Technology and Irrigation Association, smart irrigation systems are used to save water around 25% as compared to customary irrigation systems. The aforementioned factors are expected to boost the market on a global scale over the forecast period.

Applying the internet of things (IoT) in the agriculture industry enables farmers to overcome a few challenges like limited availability of lands, increasing water shortages, difficulty in managing costs, and meeting consumption needs. Moreover, the rising adoption of new technologies such as “3NV Nozzle System”, “Pivot Control Panel,” Soil Moisture Sensors,” and “Remote Sensing Technology” in irrigation systems will enhance the market growth. In addition, automation in the nursery and farm irrigation system will reduce the mistreatment of automation instrumentation, thereby allowing farmers towards optimal use of water at a precise time.

Regional Analysis

Dominance is led by the growing implementation towards new technologies and government initiatives for large scale agriculture business.

The Asia Pacific market is accounted to hold the largest share in 2018, and the dominance is accredited to favorable climatic conditions for plantation and other fruits. In addition, the bulky cultivation of agricultural crops created a huge potential, including sugarcane, tea, and cotton. Furthermore, the wide-scale adoption of smart plantation management systems across the region is projected to witness robust growth, improving crop yield with enhanced usage of resources. On the other hand, China clamps the foremost market share, owing to a large cultivable area for tea, fruits, sugarcane, and plantation crops. Furthermore, this region is characterized by government supports to promote the Internet of Things (IoT) in farming, a rise in concerns toward the environment, adverse climatic conditions, and reduction in the number of farmlands, and a decrease in productivity.

Introduction of industrialization, digital agriculture, and mechanization of production processes, data management, and connectivity unleased the agriculture and plantation sector. Advancement in new technologies such as “Agriculture 4.0”, “Robotics,” “artificial intelligence (AI),” “Big Data,” “Precision Farming,” and R&D investments is projected to drive the demand for smart plantation management systems across the region.

List of Companies Covered:

  • Robert Bosch
  • Deere & Company
  • Netafim
  • Synelixis Solutions
  • DTN
  • Tevatronics
  • Semiosbio Technologies
  • Jain Irrigation Systems
  • Hidrosoph
  • Aquasky
  • AG Leader Technology
  • Teejet Technologies
  • Crop Metrics
  • Topcon Group
  • Raven Industries

Key Industry Development:

  • In June 2019, DTN, a U.S.-based Minneapolis acquired PraxSoft, a communications technology and sensor interface company, to provide more accurate data by using communication and sensors technology. This acquisition will hasten data acquisition from a wide range of sensors across different industries and facilitate insights to drive better business decisions.
  • In April 2019, DTN partnered with Decisive Farming to provide a comprehensive solution for both organizations towards the real-time decision for crop yields.
  • In December 2018, Netafim, an Israeli irrigation equipment manufacturer, formed an association with ACOM, a technology firm, and Khang Thinh Irrigation Technology JSC, a distributor of irrigation equipment, to offer new technologies and a database system that offers real-time data for coffee planters in Vietnam.

Historical & Forecast Period

This study report represents analysis for each segment from 2017 to 2027, considering 2018to be the base year. Compounded Annual Growth Rate (CAGR) for each of the respective segments estimated for the forecast period from 2019 to 2027.

SegmentationType (2017–2027; US$ Bn)

  • Irrigation System
  • Harvesting System
  • Plantation Growth Monitoring System

 Crop (2017–2027; US$ Bn)

  • Coffee
  • Oilseeds
  • Sugarcane
  • Fruits
  • Cotton
  • Others

 Component (2017–2027; US$ Bn)

  • Hardware
  • Software

 Geography (2017–2027; US$ Bn)

  • North America (the U.S., Rest of North America)
  • Europe (U.K., Germany, France, Rest of Europe)
  • Asia Pacific (Japan, China, India, Rest of Asia Pacific)
  • Rest of the World (Latin America, Middle East & Africa)

Shape Your Report to Specific Countries or Regions & Enjoy 30% Off!

The current report also comprehends qualitative and qualitative market valuation factors such as key market drivers, market trends, restraints, and opportunities that give a better market understanding of the overall foundation repair services market. In addition, the global report also comprises a graphical representation of the competitive landscape based on their market initiatives and strategies, product portfolio, and business strengths.

1. Preface
1.1. Report Description
1.1.1. Purpose of the Report
1.1.2. Target Audience
1.1.3. USP and Key Offerings
1.2. Research Scope
1.3. Research Methodology
1.3.1. Phase I – Secondary Research
1.3.2. Phase II – Primary Research
1.3.3. Phase III – Expert Panel Review
1.3.4. Approach Adopted
1.3.4.1. Top-Down Approach
1.3.4.2. Bottom-Up Approach
1.3.5. Assumptions
1.4. Market Segmentation

2. Executive Summary
2.1. Market Snapshot: Global Smart Plantation Management Systems (SPMS) Market
2.2. Global SPMS Market, by Type, 2018 (US$ Bn)
2.3. Global SPMS Market, by Crop, 2018 (US$ Bn)
2.4. Global SPMS Market, by Component, 2018 (US$ Bn)
2.5. Global SPMS Market, by Geography, 2018 (US$ Bn)

3. Market Dynamics
3.1. Introduction
3.1.1. Global SPMS Market Value, 2017-2027, (US$ Bn)
3.2. Market Dynamics
3.2.1. Market Drivers
3.2.2. Market Restraints
3.3. Attractive Investment Proposition, by Geography, 2018
3.4. Market Positioning of Key Players, 2018
3.4.1. Major Strategies Adopted by Key Players

4. Global Smart Plantation Management Systems (SPMS) Market, by Type , 2017-2027 (US$ Bn)
4.1. Overview
4.2. Irrigation System
4.3. Harvesting System
4.4. Plantation Growth Monitoring System

5. Global Smart Plantation Management Systems (SPMS) Market, by Crop, 2017-2027 (US$ Bn)
5.1. Overview
5.2. Coffee
5.3. Oilseeds
5.4. Sugarcane
5.5. Fruits
5.6. Cotton
5.7. Others

6. Global Smart Plantation Management Systems (SPMS) Market, by Component, 2017-2027 (US$ Bn)
6.1. Overview
6.2. Hardware
6.3. Software

7. North America Smart Plantation Management Systems (SPMS) Market Analysis, 2017-2027 (US$ Bn)
7.1. Overview
7.1.1. North America SPMS Market Value and Growth, 2017-2027, (US$ Bn)
7.2. North America SPMS Market Value, By Type, 2017-2027 (US$ Bn)
7.2.1. Market Analysis
7.3. North America SPMS Market Value, By Crop, 2017-2027 (US$ Bn)
7.3.1. Market Analysis
7.4. North America SPMS Market Value, By Component, 2017-2027 (US$ Bn)
7.4.1. Market Analysis
7.5. North America SPMS Market Value, By Region/Country, 2017-2027 (US$ Bn)
7.5.1. Market Analysis
7.5.2. U.S.
7.5.3. Rest of North America

8. Europe Smart Plantation Management Systems (SPMS) Market Analysis, 2017-2027 (US$ Bn)
8.1. Overview
8.1.1. Europe SPMS Market Value and Growth, 2017-2027, (US$ Bn)
8.2. Europe SPMS Market Value, By Type, 2017-2027 (US$ Bn)
8.2.1. Market Analysis
8.3. Europe SPMS Market Value, By Crop, 2017-2027 (US$ Bn)
8.3.1. Market Analysis
8.4. Europe SPMS Market Value, By Component, 2017-2027 (US$ Bn)
8.4.1. Market Analysis
8.5. Europe SPMS Market Value, By Region/Country, 2017-2027 (US$ Bn)
8.5.1. Market Analysis
8.5.2. U.K.
8.5.3. Germany
8.5.4. France
8.5.5. Rest of Europe

9. Asia Pacific Smart Plantation Management Systems (SPMS) Market Analysis, 2017-2027 (US$ Bn)
9.1. Overview
9.1.1. Asia Pacific SPMS Market Value and Growth, 2017-2027, (US$ Bn)
9.2. Asia Pacific SPMS Market Value, By Type, 2017-2027 (US$ Bn)
9.2.1. Market Analysis
9.3. Asia Pacific SPMS Market Value, By Crop, 2017-2027 (US$ Bn)
9.3.1. Market Analysis
9.4. Asia Pacific SPMS Market Value, By Component, 2017-2027 (US$ Bn)
9.4.1. Market Analysis
9.5. Asia Pacific SPMS Market Value, By Region/Country, 2017-2027 (US$ Bn)
9.5.1. Market Analysis
9.5.2. Japan
9.5.3. China
9.5.4. India
9.5.5. Rest of Asia Pacific

10. Rest of the World Smart Plantation Management Systems (SPMS) Market Analysis, 2017-2027 (US$ Bn)
10.1. Overview
10.1.1. Rest of the World SPMS Market Value and Growth, 2017-2027, (US$ Bn)
10.2. Rest of the World SPMS Market Value, By Type, 2017-2027 (US$ Bn)
10.2.1. Market Analysis
10.3. Rest of the World SPMS Market Value, By Crop, 2017-2027 (US$ Bn)
10.3.1. Market Analysis
10.4. Rest of the World SPMS Market Value, By Component, 2017-2027 (US$ Bn)
10.4.1. Market Analysis
10.5. Rest of the World SPMS Market Value, By Region, 2017-2027 (US$ Bn)
10.5.1. Market Analysis
10.5.2. Middle East & Africa
10.5.3. Latin America

11. Company Profiles
11.1. Robert Bosch
11.2. Deere & Company
11.3. Netafim
11.4. Synelixis Solutions
11.5. DTN
11.6. Tevatronics
11.7. Semiosbio Technologies
11.8. Jain Irrigation Systems
11.9. Hidrosoph
11.10. Aquaspy
11.11. AG Leader Technology
11.12. Teejet Technologies
11.13. Crop Metrics
11.14. Topcon Group
11.15. Raven Industries

List of Figures

FIG. 1 Global Smart Plantation Management Systems (SPMS) Market: Research Methodology
FIG. 2 Market Size Estimation – Top Down & Bottom up Approach
FIG. 3 Global SPMS Market Segmentation
FIG. 4 Global SPMS Market, by Type, 2018 (US$ Bn)
FIG. 5 Global SPMS Market, by Crop, 2018 (US$ Bn)
FIG. 6 Global SPMS Market, by Component, 2018 (US$ Bn)
FIG. 7 Global SPMS Market, by Geography, 2018 (US$ Bn)
FIG. 8 Attractive Investment Proposition, by Geography, 2018
FIG. 9 Global Market Positioning of Key SPMS Market Manufacturers, 2018
FIG. 10 Global SPMS Market Value Contribution, By Type, 2018 & 2027 (Value %)
FIG. 11 Global SPMS Market, by Irrigation System, Value, 2017–2027 (US$ Bn)
FIG. 12 Global SPMS Market, by Harvesting System, Value, 2017–2027 (US$ Bn)
FIG. 13 Global SPMS Market, by Plantation Growth Monitoring System, Value, 2017–2027 (US$ Bn)
FIG. 14 Global SPMS Market Value Contribution, By Crop, 2018 & 2027 (Value %)
FIG. 15 Global SPMS Market, by Coffee, Value, 2017–2027 (US$ Bn)
FIG. 16 Global SPMS Market, by Oilseeds, Value, 2017–2027 (US$ Bn)
FIG. 17 Global SPMS Market, by Sugarcane, Value, 2017–2027 (US$ Bn)
FIG. 18 Global SPMS Market, by Fruits, Value, 2017–2027 (US$ Bn)
FIG. 19 Global SPMS Market, by Cotton, Value, 2017–2027 (US$ Bn)
FIG. 20 Global SPMS Market, by Other Application, Value, 2017–2027 (US$ Bn)
FIG. 21 Global SPMS Market Value Contribution, By Componet, 2018 & 2027 (Value %)
FIG. 22 Global SPMS Market, by Hardware, Value, 2017–2027 (US$ Bn)
FIG. 23 Global SPMS Market, by Software, Value, 2017–2027 (US$ Bn)
FIG. 24 U.S. SPMS Market, 2017–2027 (US$ Bn)
FIG. 25 Rest of North America SPMS Market, 2017–2027 (US$ Bn)
FIG. 26 U.K. SPMS Market, 2017–2027 (US$ Bn)
FIG. 27 Germany SPMS Market, 2017–2027 (US$ Bn)
FIG. 28 France SPMS Market, 2017–2027 (US$ Bn)
FIG. 29 Rest of Europe SPMS Market, 2017–2027 (US$ Bn)
FIG. 30 Japan SPMS Market, 2017–2027 (US$ Bn)
FIG. 31 China SPMS Market, 2017–2027 (US$ Bn)
FIG. 32 India SPMS Market, 2017–2027 (US$ Bn)
FIG. 33 Rest of Asia Pacific SPMS Market, 2017–2027 (US$ Bn)
FIG. 34 Middle East & Africa SPMS Market, 2017–2027 (US$ Bn)
FIG. 35 Latin America SPMS Market, 2017–2027 (US$ Bn)

List of Tables

TABLE 1 Market Snapshot: Global Smart Plantation Management Systems (SPMS ) Market
TABLE 2 Global SPMS Market, by Type, 2017–2027 (US$ Bn)
TABLE 3 Global SPMS Market, by Crop, 2017–2027 (US$ Bn)
TABLE 4 Global SPMS Market, by Component, 2017–2027 (US$ Bn)
TABLE 5 Global SPMS Market, by Geography, 2017–2027 (US$ Bn)
TABLE 6 North America SPMS Market, by Type, 2017–2027 (US$ Bn)
TABLE 7 North America SPMS Market, by Crop, 2017–2027 (US$ Bn)
TABLE 8 North America SPMS Market, by Component, 2017–2027 (US$ Bn)
TABLE 9 North America SPMS Market, by Country, 2017–2027 (US$ Bn)
TABLE 10 Europe SPMS Market, by Type, 2017–2027 (US$ Bn)
TABLE 11 Europe SPMS Market, by Crop, 2017–2027 (US$ Bn)
TABLE 12 Europe SPMS Market, by Component, 2017–2027 (US$ Bn)
TABLE 13 Europe SPMS Market, by Country/Region, 2017–2027 (US$ Bn)
TABLE 14 Asia Pacific SPMS Market, by Type, 2017–2027 (US$ Bn)
TABLE 15 Asia Pacific SPMS Market, by Crop, 2017–2027 (US$ Bn)
TABLE 16 Asia Pacific SPMS Market, by Component, 2017–2027 (US$ Bn)
TABLE 17 Asia Pacific SPMS Market, by Country/Region, 2017–2027 (US$ Bn)
TABLE 18 RoW SPMS Market, by Type, 2017–2027 (US$ Bn)
TABLE 19 RoW SPMS Market, by Crop, 2017–2027 (US$ Bn)
TABLE 20 RoW SPMS Market, by Component, 2017–2027 (US$ Bn)
TABLE 21 RoW SPMS Market, by Country/Region, 2017–2027 (US$ Bn)
TABLE 22 Robert Bosch: Company Snapshot (Company Overview; Product Portfolio; Financial Information; Key Developments)
TABLE 23 Deere & Company: Company Snapshot (Company Overview; Product Portfolio; Financial Information; Key Developments)
TABLE 24 Netafim: Company Snapshot (Company Overview; Product Portfolio; Financial Information; Key Developments)
TABLE 25 Synelixis Solutions: Company Snapshot (Company Overview; Product Portfolio; Financial Information; Key Developments)
TABLE 26 DTN: Company Snapshot (Company Overview; Product Portfolio; Financial Information; Key Developments)
TABLE 27 Tevatronics: Company Snapshot (Company Overview; Product Portfolio; Financial Information; Key Developments)
TABLE 28 Semiosbio Technologies: Company Snapshot (Company Overview; Product Portfolio; Financial Information; Key Developments)
TABLE 29 Jain Irrigation Systems: Company Snapshot (Company Overview; Product Portfolio; Financial Information; Key Developments)
TABLE 30 Hidrosoph: Company Snapshot (Company Overview; Product Portfolio; Financial Information; Key Developments)
TABLE 31 Aquaspy: Company Snapshot (Company Overview; Product Portfolio; Financial Information; Key Developments)
TABLE 32 AG Leader Technology: Company Snapshot (Company Overview; Product Portfolio; Financial Information; Key Developments)
TABLE 33 Teejet Technologies: Company Snapshot (Company Overview; Product Portfolio; Financial Information; Key Developments)
TABLE 34 Crop Metrics: Company Snapshot (Company Overview; Product Portfolio; Financial Information; Key Developments)
TABLE 35 Topcon Group: Company Snapshot (Company Overview; Product Portfolio; Financial Information; Key Developments)
TABLE 36 Raven Industries: Company Snapshot (Company Overview; Product Portfolio; Financial Information; Key Developments)

Frequently Asked Questions:

What is the size of Smart Plantation Management Systems Market?

The market for Smart Plantation Management Systems is expected to reach US$ 1.26 Bn in 2028.

What is the Smart Plantation Management Systems Market CAGR?

The Smart Plantation Management Systems market is expected to see significant CAGR growth over the coming years, at 9.0%.

What is the Forecast period considered for Smart Plantation Management Systems Market?

The report is forecasted from 2019-2027.

What is the base year considered for Smart Plantation Management Systems Market?

The base year of this report is 2018.

Who are the major players in this market?

Robert Bosch, Deere & Company, Netafim, Synelixis Solutions, DTN, Tevatronics, Semiosbio Technologies, Jain Irrigation Systems, Hidrosoph, Aquasky, AG Leader Technology are some of the major players in the global market.

Non-Agriculture Smart Irrigation Controllers Market

Published:
Report ID: 63707

Voice Activated Smart Assistant Gadgets Devices Market

Published:
Report ID: 63193

Refurbished Smartphone Market

Published:
Report ID: 62000

Smart Sensors Market

Published:
Report ID: 10311

Public Transport Smart Cards Market

Published:
Report ID: 8306

Smart Speakers Market

Published:
Report ID: 10343

Smartphones Antenna Market

Published:
Report ID: 10402

Smart Baggage Handling System Market

Published:
Report ID: 10062

Smart Fabric Market

Published:
Report ID: 10130

Non-Agriculture Smart Irrigation Controllers Market

Published:
Report ID: 63707

Seed Coating Market

Published:
Report ID: 10586

Soil Moisture Sensors Market

Published:
Report ID: 10500

Lambda Cyhalothrin Market

Published:
Report ID: 7999

Agriculture Sensors Market

Published:
Report ID: 2814

Hay and Forage Rakes Market

Published:
Report ID: 57572

Soil Stabilization Market

Published:
Report ID: 6181

Farm Tractors Market

Published:
Report ID: 6140

Controlled-Release Fertilizers Market

Published:
Report ID: 12437

Oilseeds Market

Published:
Report ID: 7681

Genetically Modified Crops Market

Published:
Report ID: 52028

MENA Drip Irrigation Systems Market

Published:
Report ID: 52865

Purchase Options

The report comes as a view-only PDF document, optimized for individual clients. This version is recommended for personal digital use and does not allow printing.
$4699

To meet the needs of modern corporate teams, our report comes in two formats: a printable PDF and a data-rich Excel sheet. This package is optimized for internal analysis and multi-location access, making it an excellent choice for organizations with distributed workforce.
$5699

The report will be delivered in printable PDF format along with the report’s data Excel sheet. This license offers 100 Free Analyst hours where the client can utilize Credence Research Inc.’s research team. It is highly recommended for organizations seeking to execute short, customized research projects related to the scope of the purchased report.
$7699

Smallform of Sample request

Have a question?

User Profile

Don’t settle for less – trust Mitul to help you find the best solution.

Report delivery within 24 to 48 hours

– Other Info –

What people say?-

User Review

I am very impressed with the information in this report. The author clearly did their research when they came up with this product and it has already given me a lot of ideas.

Jana Schmidt
CEDAR CX Technologies

– Connect with us –

Phone

+91 6232 49 3207


support

24/7 Research Support


sales@credenceresearch.com

– Research Methodology –

Going beyond the basics: advanced techniques in research methodology

– Trusted By –

Pepshi, LG, Nestle
Motorola, Honeywell, Johnson and johnson
LG Chem, SIEMENS, Pfizer
Unilever, Samsonite, QIAGEN