Market Overview
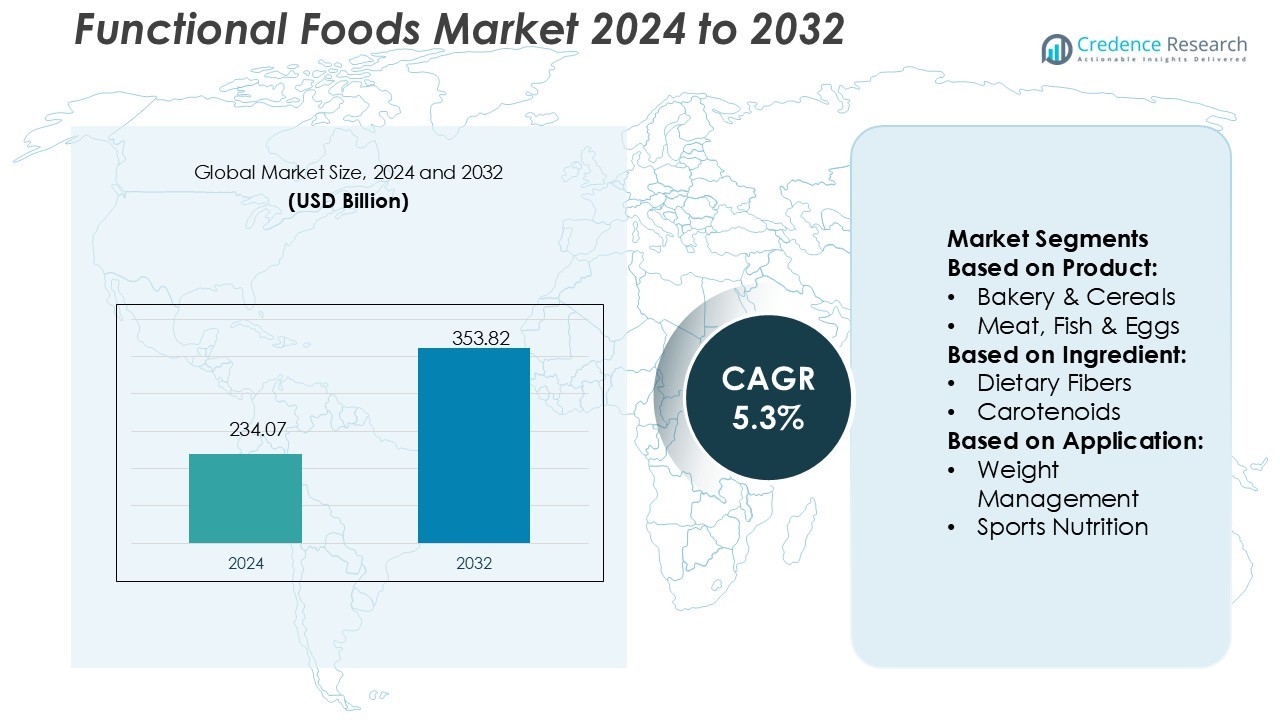
Functional Foods Market size was valued USD 234.07 billion in 2024 and is anticipated to reach USD 353.82 billion by 2032, at a CAGR of 5.3% during the forecast period.
| REPORT ATTRIBUTE |
DETAILS |
| Historical Period |
2020-2023 |
| Base Year |
2024 |
| Forecast Period |
2025-2032 |
| Functional Foods Market Size 2024 |
USD 234.07 Billion |
| Functional Foods Market, CAGR |
5.3% |
| Functional Foods Market Size 2032 |
USD 353.82 Billion |
The functional foods market features strong competition from leading players such as GFR Pharma, Herbalife, General Mills Inc., Coca-Cola Co., Amway, Cargill, KFSU, BASF, Nutri-Nation, and Standard Functional Foods Group Inc. These companies drive market growth through innovation, ingredient development, and strategic partnerships, focusing on products that enhance digestive health, immunity, and overall wellness. North America leads the global functional foods market with a 34% share, supported by advanced product portfolios, strong regulatory frameworks, and high consumer awareness of preventive healthcare. This leadership is reinforced by significant investment in research, product diversification, and widespread retail penetration.
Access crucial information at unmatched prices!
Request your sample report today & start making informed decisions powered by Credence Research Inc.!
Download Sample
Market Insights
- The Functional Foods Market size was USD 234.07 billion in 2024 and will reach USD 353.82 billion by 2032, growing at a CAGR of 5.3%.
- Rising health awareness, aging populations, and demand for preventive nutrition are the major drivers fueling adoption of fortified dairy, cereals, and probiotic-based products.
- Plant-based functional foods, clean-label offerings, and personalized nutrition represent key market trends, creating opportunities for companies to innovate and capture evolving consumer preferences.
- The market faces restraints such as high R&D costs, strict regulatory frameworks, and challenges in validating health claims, which can limit entry for smaller players.
- North America leads with a 34% share, followed by Europe at 28% and Asia Pacific at 24%, while digestive health dominates application segments with 28% share, supported by growing consumer focus on probiotics and dietary fibers.
Market Segmentation Analysis:
By Product
In the functional foods market, dairy products lead with a 34% share due to their established consumer trust, wide availability, and integration of probiotics. Yogurt and fortified milk remain popular, driven by demand for digestive health and immunity support. Bakery and cereals follow, supported by fortified bread and cereals catering to convenience-driven lifestyles. Meat, fish, and eggs contribute through protein enrichment, while soy products gain traction among plant-based consumers. Fats and oils infused with omega-3s also expand steadily. The broad product variety ensures growing adoption across diverse consumer preferences.
- For instance, HeatGen’s self-heating can warms a beverage in just 2 minutes, with its heater weighing about 3 ounces and displacing only 10% of the can’s volume, offering compact and dependable portability.
By Ingredient
Prebiotics and probiotics dominate this segment, accounting for 31% of market share. Rising awareness of gut health and immunity has accelerated their use in dairy, beverages, and supplements. Vitamins and minerals remain strong contributors, addressing nutrient deficiencies and preventive healthcare needs. Dietary fibers gain prominence for weight management, while carotenoids and fatty acids strengthen cardiovascular and eye health applications. Ingredient innovation supports fortified offerings, ensuring long-term growth. The rising prevalence of lifestyle-related disorders reinforces the adoption of functional ingredients across global markets.
- For instance, LMK Thermosafe’s Thermosafe Type B Induction Drum Heater warms a 205-liter steel drum using an alternating current power source, such as a 110/120V supply rated at 1,500 watts. Two units can be stacked to cover the full drum height safely in Zone 2 areas.
By Application
Digestive health is the leading application, holding 28% market share, driven by rising gastrointestinal concerns and consumer awareness of gut microbiome benefits. Products fortified with probiotics and fibers dominate this category, offering preventive healthcare solutions. Immunity-based applications follow, particularly after global health crises, where fortified beverages and dairy saw higher consumption. Sports nutrition continues expanding due to protein-enriched products, while weight management sustains steady demand. Clinical nutrition and cardio health gain momentum in aging populations, supported by targeted dietary solutions. The market’s application diversity strengthens long-term adoption across consumer demographics.
Key Growth Drivers
Rising Health Consciousness
Growing consumer focus on preventive healthcare drives the demand for functional foods. Rising awareness about nutrition’s role in reducing chronic disease risk has increased interest in fortified foods. Dairy, cereals, and beverages enriched with probiotics, vitamins, and minerals are in high demand. Lifestyle changes, urbanization, and a surge in fitness awareness fuel this growth. Consumers increasingly prefer nutrient-dense options over conventional foods, reinforcing market expansion. This driver highlights a long-term shift toward healthier dietary choices supported by greater access to health-related information.
- For instance, Tempra’s self-heating technology, based on a glycerin and potassium salt reaction, was licensed to MRE-STAR for use in military-grade Meal, Ready-to-Eat (MRE) systems. This system is designed to heat meals to approximately 140 °F in 10 to 12 minutes and maintain a warm temperature for almost 30 minutes.
Aging Population and Lifestyle Disorders
An aging global population significantly boosts demand for functional foods targeting immunity, bone strength, and cardiovascular health. Rising prevalence of obesity, diabetes, and digestive disorders further accelerates adoption. Consumers look for fortified foods that offer tangible health benefits alongside convenience. Vitamins, omega-3 fatty acids, and probiotics play a key role in clinical nutrition. Companies are aligning product portfolios to meet senior citizens’ nutritional needs. The demand for functional foods is therefore anchored in addressing chronic lifestyle-driven health issues while supporting healthy aging.
- For instance, Cochran’s official specification shows that the ST25 delivers an exact steam output range of 500 to 6 500 kg/hr at feed-and-allowance 100 °C .This numeric capacity underlines its ability to sustain continuous steam flow in demanding operational.
Innovation in Functional Ingredients
Continuous innovation in bioactive ingredients strengthens the functional foods market. Manufacturers invest in probiotics, prebiotics, dietary fibers, and plant-based alternatives to deliver specific health benefits. Technological advances in encapsulation and nutrient delivery improve product stability and efficacy. Expanding R&D pipelines also introduce functional blends for weight management and immunity. Consumers increasingly value transparency in ingredient sourcing and clean-label claims, creating space for innovation. This driver underlines the industry’s focus on advanced formulations that balance health benefits with consumer trust and product appeal.
Key Trends & Opportunities
Expansion of Plant-Based Functional Foods
The growing shift toward plant-based diets presents a major opportunity in the functional foods market. Soy proteins, plant fibers, and algae-derived nutrients are increasingly used in dairy alternatives, meat substitutes, and fortified snacks. Consumers demanding sustainability and clean-label products further fuel this segment. Companies introducing innovative, plant-based formulations stand to capture expanding consumer segments, particularly younger demographics. This trend highlights how health, sustainability, and ethical consumption are converging to open new growth avenues across multiple product categories.
- For instance, Fulton’s VSRT-60 model generates a precise steam output of 2 070 lb/hr at feed-and-allowance 212 °F, driven by a fuel input of 2 392 MBH and equipped with a turndown ratio of 10:1, as specified in company documentation.
Personalized Nutrition Adoption
Personalized nutrition solutions are emerging as a transformative trend in functional foods. Advances in nutrigenomics and digital health tools allow companies to tailor products to individual needs. Consumers now seek functional foods aligned with their genetic profile, lifestyle, or specific health goals. This creates opportunities for customized product offerings, particularly in weight management, digestive health, and immunity. Companies leveraging data-driven solutions can differentiate themselves in an increasingly competitive market. The move toward personalization positions functional foods as essential in preventive and targeted nutrition.
- For instance, Babcock Wanson’s BWR fire-tube models deliver exact steam outputs ranging from 10 000 kg/h up to 30 000 kg/h (at 15 bar and feedwater at 105 °C), with corresponding thermal power outputs from 6 545 kW to 17 685 kW.
Key Challenges
High Production and R&D Costs
Developing functional foods requires advanced technologies, high-quality ingredients, and clinical validation, leading to elevated costs. Continuous R&D in bioactive compounds and product stability demands significant investment. Smaller players face barriers in scaling operations due to high capital requirements. Moreover, maintaining affordable pricing while delivering health benefits is challenging in cost-sensitive markets. These factors limit mass adoption despite rising consumer interest. Addressing production efficiency and achieving economies of scale remain critical hurdles for sustained market growth in this sector.
Regulatory Complexity and Labeling Issues
Strict regulatory frameworks around health claims and labeling present a key challenge for manufacturers. Authorities require scientific validation before approving claims related to immunity, weight loss, or disease prevention. Variations in regional standards make global market entry complex. Misleading labels or lack of transparency can harm consumer trust and attract penalties. Companies must balance innovation with compliance to navigate this landscape effectively. Clear communication of product benefits while meeting regulatory requirements is essential to build credibility and ensure long-term growth.
Regional Analysis
North America
North America holds the leading position in the functional foods market with a 34% share. Strong consumer awareness of preventive healthcare and high demand for probiotic dairy, fortified cereals, and dietary supplements support regional dominance. The U.S. drives growth with advanced product innovation and strong retail penetration. Rising prevalence of lifestyle disorders like obesity and diabetes further boosts adoption. Canada follows with increased consumption of omega-3-enriched products and clinical nutrition solutions. Well-established regulatory frameworks and investments in R&D strengthen North America’s leadership, making it a primary hub for functional food innovation and market expansion.
Europe
Europe accounts for 28% of the functional foods market, supported by strong demand for fortified bakery, dairy, and plant-based alternatives. Germany, the UK, and France lead adoption, driven by aging populations and growing focus on digestive health and immunity. Probiotic-rich products and vitamin-enriched cereals dominate sales, while the plant-based trend accelerates growth across multiple categories. Regulatory emphasis on product safety and health claim validation strengthens consumer trust. Increasing investments in personalized nutrition and clean-label offerings further enhance opportunities. Europe’s market expansion reflects a blend of traditional fortified foods and innovative health-focused formulations tailored to evolving consumer needs.
Asia Pacific
Asia Pacific represents 24% of the global functional foods market and is the fastest-growing region. Rising disposable incomes, urbanization, and health awareness fuel demand in China, India, and Japan. Probiotic dairy drinks, fortified soy products, and immunity-enhancing supplements dominate consumption. Japan leads innovation with clinical nutrition and digestive health products, while India and China see surging demand in weight management and sports nutrition. Government initiatives promoting nutrition and expanding retail channels accelerate growth. The strong cultural acceptance of functional ingredients, combined with rising health-conscious consumers, positions Asia Pacific as a dynamic growth center for functional food adoption.
Latin America
Latin America holds a 7% market share, with Brazil and Mexico driving regional demand. Rising middle-class populations and growing focus on lifestyle-related health issues contribute to expansion. Functional dairy and fortified cereals remain highly popular, supported by increasing urbanization and retail availability. Companies are introducing omega-3-enriched oils, vitamins, and prebiotic-rich beverages to capture rising interest in preventive nutrition. While regulatory frameworks are still evolving, consumer trust in fortified food products continues to grow. The combination of economic development and shifting dietary habits creates steady opportunities for functional food manufacturers in Latin America’s emerging markets.
Middle East & Africa
The Middle East & Africa accounts for 7% of the functional foods market, with increasing health awareness and urban lifestyles driving adoption. Gulf countries, led by the UAE and Saudi Arabia, show strong demand for fortified dairy, clinical nutrition, and sports nutrition products. Africa’s market remains in an early stage but is expanding with greater retail penetration and rising interest in immunity-boosting foods. Challenges include price sensitivity and limited regulatory frameworks. However, growing investments in healthcare and nutrition campaigns, along with consumer preference for fortified staples, are gradually strengthening functional food adoption across the region.
Market Segmentations:
By Product:
- Bakery & Cereals
- Meat, Fish & Eggs
By Ingredient:
- Dietary Fibers
- Carotenoids
By Application:
- Weight Management
- Sports Nutrition
By Geography
- North America
- Europe
- Germany
- France
- U.K.
- Italy
- Spain
- Rest of Europe
- Asia Pacific
- China
- Japan
- India
- South Korea
- South-east Asia
- Rest of Asia Pacific
- Latin America
- Brazil
- Argentina
- Rest of Latin America
- Middle East & Africa
- GCC Countries
- South Africa
- Rest of the Middle East and Africa
Competitive Landscape
The functional foods market is highly competitive, with key players including GFR Pharma, Herbalife, General Mills Inc., Coca-Cola Co., Amway, Cargill, KFSU, BASF, Nutri-Nation, and Standard Functional Foods Group Inc. The functional foods market is characterized by strong competition, driven by innovation, expanding product portfolios, and rising consumer demand for health-oriented solutions. Companies focus on developing fortified dairy, cereals, beverages, and plant-based alternatives to address growing concerns around immunity, digestive health, and lifestyle disorders. Continuous investment in research and development supports advancements in bioactive ingredients, probiotics, and clean-label formulations. Strategic partnerships, mergers, and acquisitions further enhance global reach and distribution capabilities. Marketing strategies emphasizing preventive healthcare and personalized nutrition also play a critical role in building consumer trust. This dynamic environment fosters innovation, making the market increasingly diverse and consumer-driven.
Shape Your Report to Specific Countries or Regions & Enjoy 30% Off!
Key Player Analysis
- GFR Pharma
- Herbalife
- General Mills Inc.
- Coca-Cola Co.
- Amway
- Cargill
- KFSU
- BASF
- Nutri-Nation
- Standard Functional Foods Group Inc.
Recent Developments
- In May 2025, Tata Consumers announced plans to expand its food and beverage business with new product launches and acquisitions. With a focus on functional drinks, premium foods, and selective market entry, the FMCG firm targets urban growth and evolving consumer needs to drive future revenue.
- In May 2025, a leading distributor in the Asia food sector, HF Foods Group Inc., unveiled that they are expanding their digital presence by launching a new online platform specifically designed for restaurant staff, along with a group of targeted consumers.
- In April 2025, Red Bull introduced its Summer Edition White Peach energy drink, available with and without sugar. This limited-edition product features a white peach flavor with subtle notes of citrus and floral elements, targeting consumers looking for refreshing and functional drinks during the summer.
- In February 2025, Coca-Cola launched Simply Pop, a new prebiotic soda line under the Simply brand. The product line features five flavors: Citrus Punch, Fruit Punch, Lime, Pineapple Mango, and Strawberry. Each soda contains six grams of prebiotic fiber, Vitamin C, and Zinc to support the immune system.
Report Coverage
The research report offers an in-depth analysis based on Product, Ingredient, Application and Geography. It details leading market players, providing an overview of their business, product offerings, investments, revenue streams, and key applications. Additionally, the report includes insights into the competitive environment, SWOT analysis, current market trends, as well as the primary drivers and constraints. Furthermore, it discusses various factors that have driven market expansion in recent years. The report also explores market dynamics, regulatory scenarios, and technological advancements that are shaping the industry. It assesses the impact of external factors and global economic changes on market growth. Lastly, it provides strategic recommendations for new entrants and established companies to navigate the complexities of the market.
Future Outlook
- The functional foods market will expand steadily with rising health awareness.
- Demand for probiotics and prebiotics will strengthen due to focus on digestive health.
- Plant-based functional products will gain wider acceptance among health-conscious consumers.
- Personalized nutrition will emerge as a key growth area with digital health integration.
- Fortified dairy and cereal products will continue to dominate global consumption.
- Innovation in bioactive ingredients will drive new product development across applications.
- Clinical nutrition will grow rapidly, supported by aging populations worldwide.
- Clean-label and transparent sourcing will shape consumer preferences and brand loyalty.
- Regulatory frameworks will become stricter, pushing companies toward validated health claims.
- Expanding retail and e-commerce channels will accelerate accessibility of functional foods globally.


