
Mines, gas plants and water networks buy most sensors
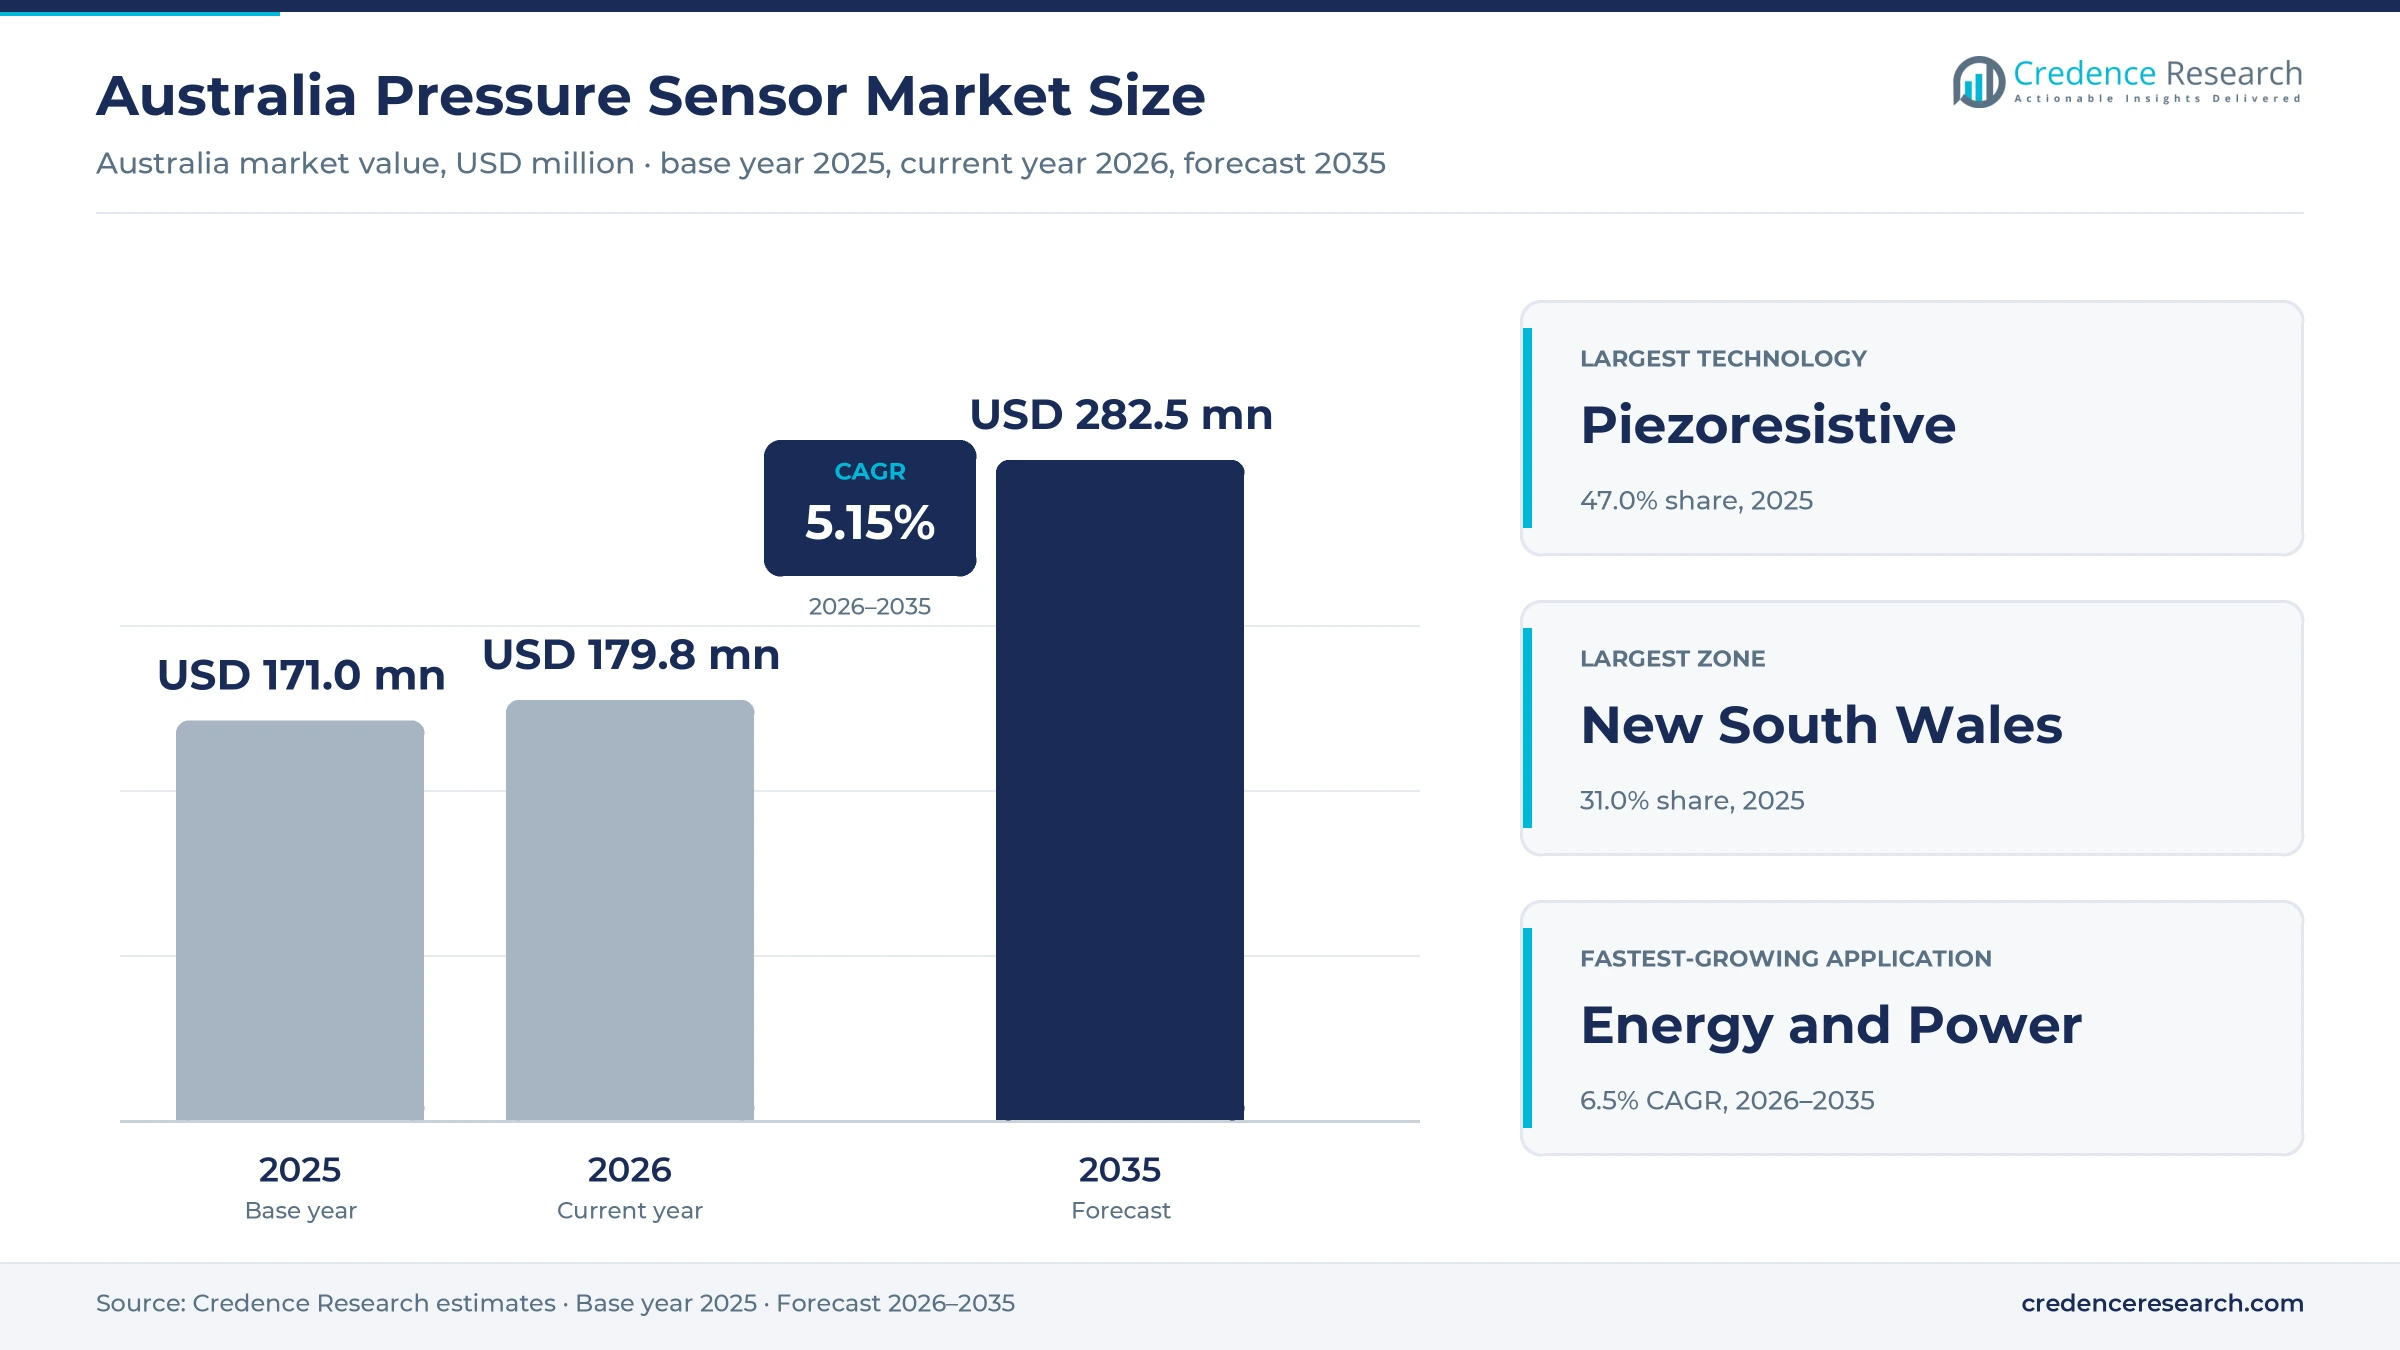
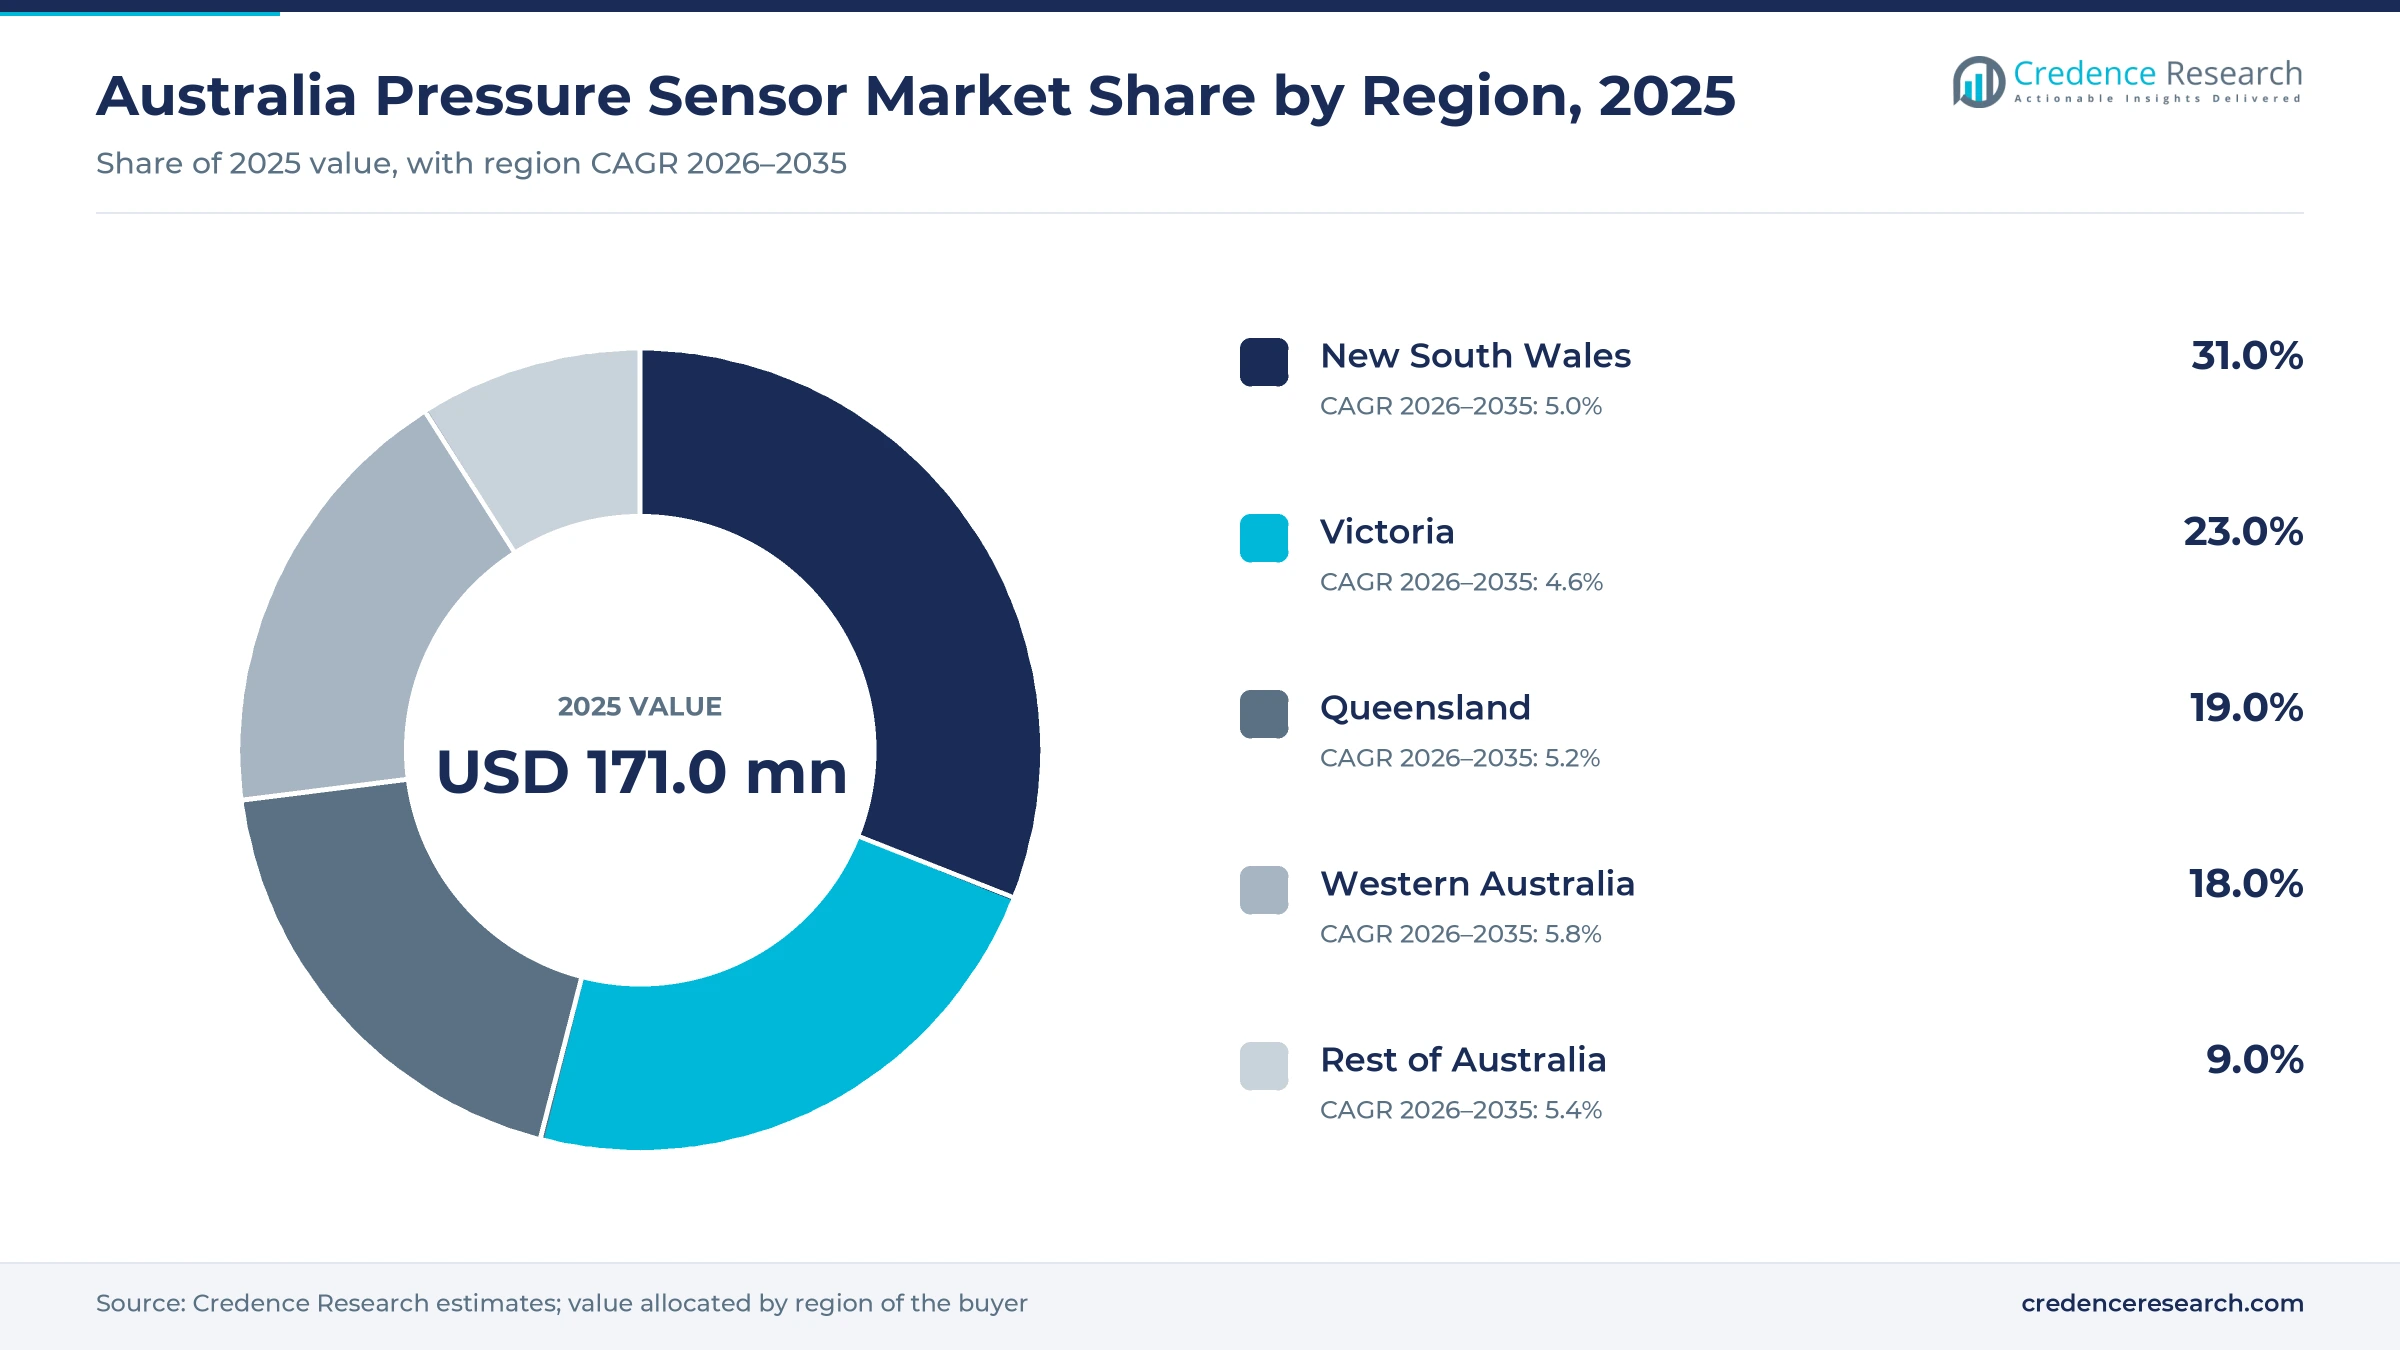
The Australia pressure sensor market was valued at USD 171.0 million in 2025 and is projected to increase from USD 179.8 million in 2026 to USD 282.5 million by 2035, registering a CAGR of 5.15% during 2026–2035. Demand comes from mine haul fleets and processing plants, offshore and onshore gas facilities, water utilities, factories, hospitals and vehicle service workshops, because each relies on transmitters and transducers to control pumps, hydraulics and process safety. New South Wales held the largest share, 31.0% in 2025, as it combines the largest utility, hospital and manufacturing base with the head offices of most instrument suppliers. Western Australia is the fastest-growing zone at 5.8% a year, supported by new LNG capacity and driverless mine fleets. One regulatory change matters for refrigeration buyers, since the national HFC import limit stepped down to 4.25 million metric tons of CO2 equivalent a year from 2026, which pushes cooling systems toward higher-pressure refrigerants. Zone shares in this report are Credence Research estimates built from state activity data.
Which transmitters and transducers fall inside this estimate?
The estimate counts the value of pressure sensors, transducers and transmitters bought by Australian end users and equipment builders, including board-level sensing elements, industrial transmitters, hygienic and hazardous-area instruments, automotive replacement sensors and medical pressure transducers. Almost all product is imported, so value is measured at the price the buyer pays after distributor, calibration and configuration margins.
Mechanical dial gauges and sensors already built into imported cars, phones and appliances are excluded, because buyers do not purchase them as separate products. The value chain runs from overseas sensor and transmitter plants through local subsidiaries, distributors and system integrators to mines, gas operators, utilities and factories. One evidence gap remains, since no official series reports national pressure sensor sales directly.
Australia Pressure Sensor Market Insights
- The market grows from USD 171.0 million in 2025 to USD 282.5 million by 2035, a 5.15% CAGR, as LNG start-ups, mine automation and water network control outweigh a flat vehicle market.
- New South Wales led with 31.0% of 2025 value, because it holds the largest utility, hospital and manufacturing base and most supplier head offices.
- Piezoresistive sensors held 47.0% of 2025 value, since low-cost silicon sensing cells sit inside most industrial transmitters and board-level devices sold locally.
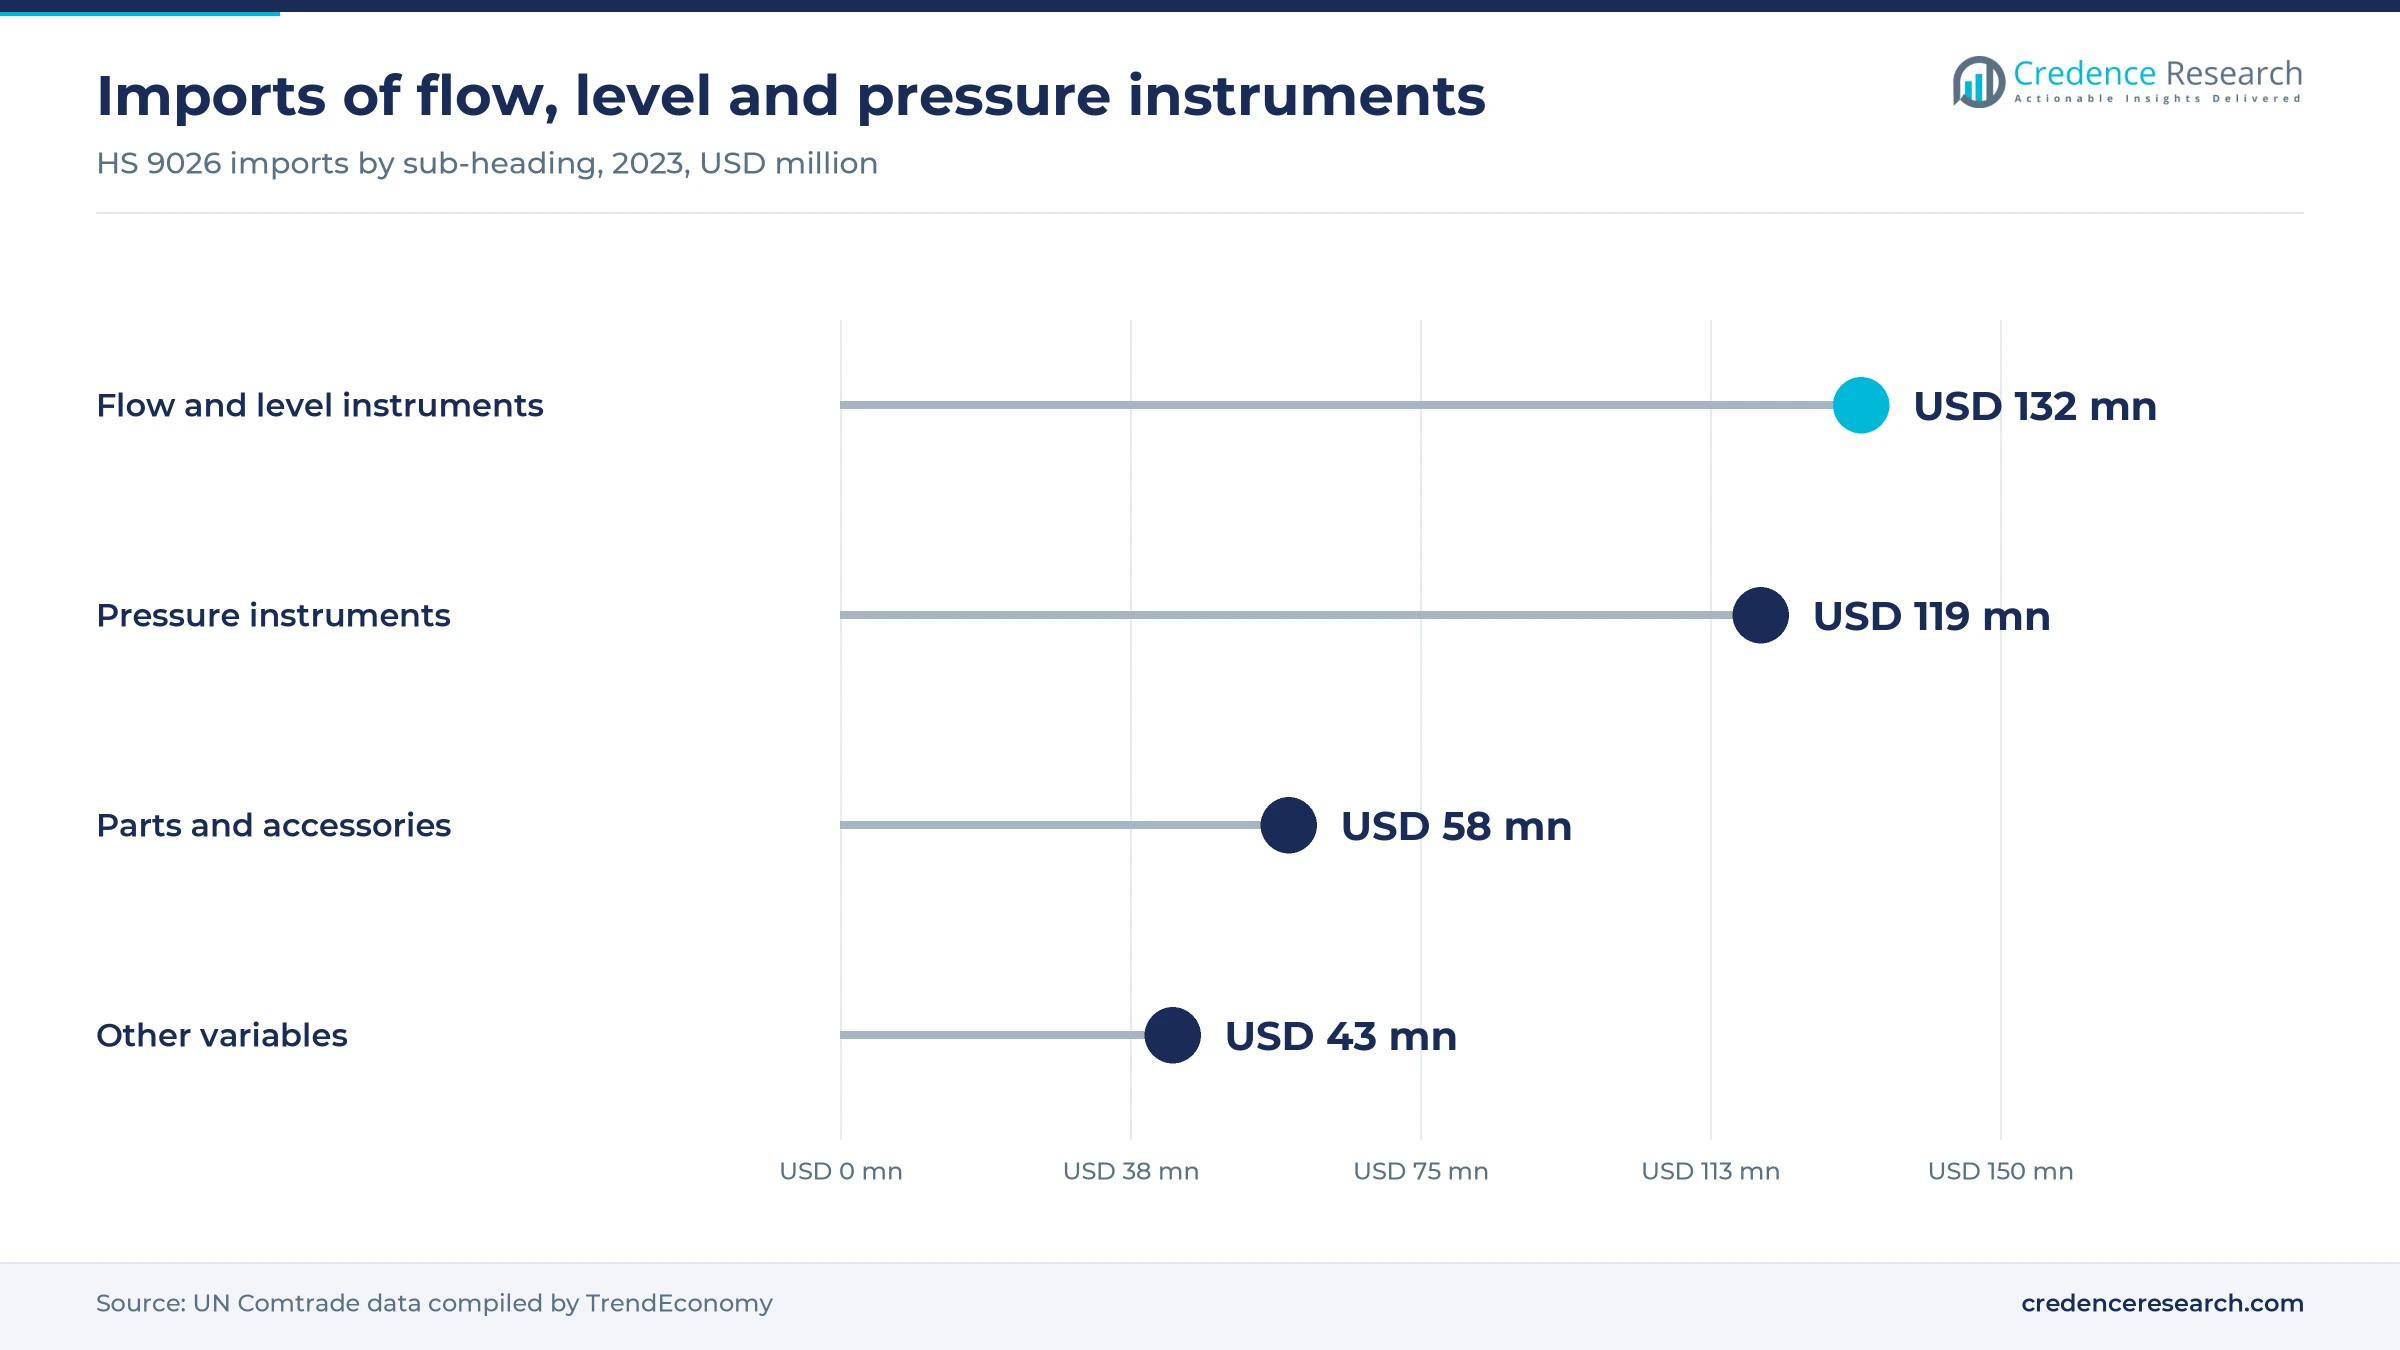
- Australia imported USD 119 million of pressure measuring instruments in 2023 and exported USD 17.1 million, so local supply depends on importers and subsidiaries.
- Applied Measurement Australia agreed in June 2026 to distribute Apogee transducers that are designed and made in Australia, a rare local manufacturing option.
Piezoresistive and analog lead as resonant and digital gain
Why does piezoresistive silicon lead while resonant sensing gains?
Based on technology, the market is categorized into piezoresistive, capacitive, electromagnetic, resonant solid-state and optical sensors. Piezoresistive sensors led with 47.0% of 2025 value because silicon strain cells are cheap enough for volume use, and RS Australia lists a Honeywell board-mount piezoresistive sensor at AUD 59.75 each in November 2026. Resonant Solid-State sensors grow fastest at 6.4% a year as LNG and pipeline operators favor drift-resistant transmitters, and Yokogawa explains that its DPharp design uses two silicon resonators whose frequency output avoids analog-to-digital conversion errors. Capacitive cells keep a strong position in differential pressure and flow duty.
Which buyers absorb the most transmitters?
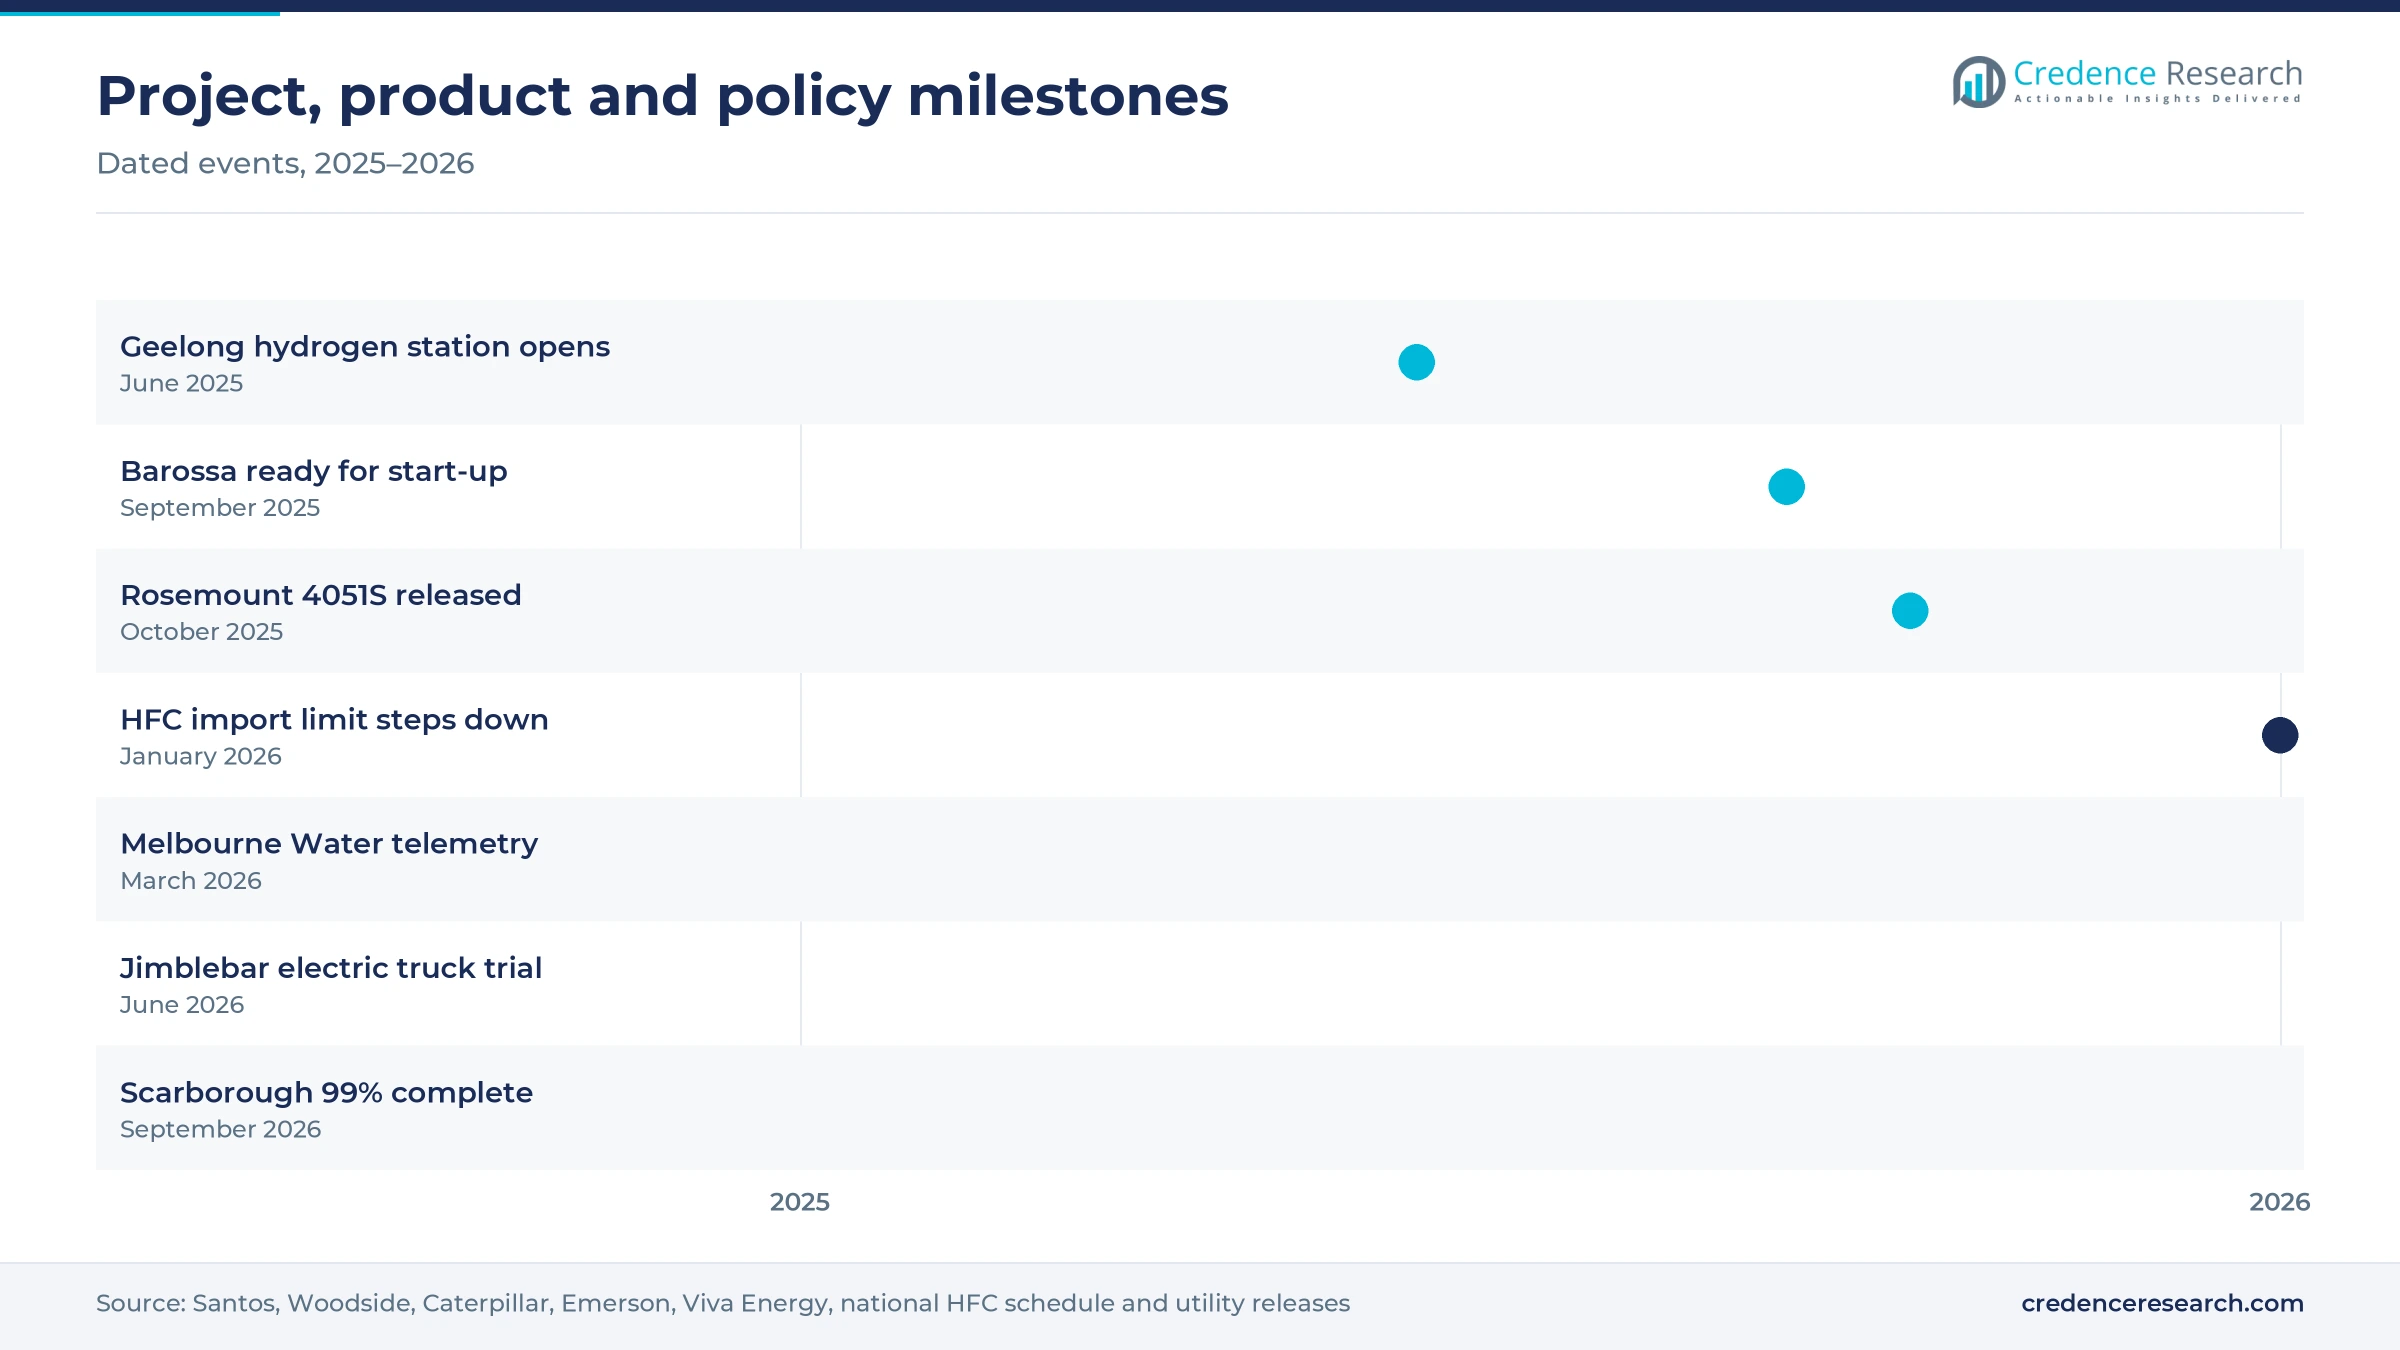
Based on application, the market is categorized into industrial manufacturing and mining, oil and gas, automotive, healthcare, energy and power, consumer electronics and aerospace and defense. Industrial Manufacturing & Mining led with 27.0% of 2025 value because haul fleets and process lines need constant pressure control, and Hancock Iron Ore converted 78 haul trucks at Roy Hill to driverless capability in 2025. Energy and Power grows fastest at 6.5% a year as hydrogen projects move from trials to sites, and Viva Energy opened a AUD 61.2 million hydrogen refueling station at Geelong in June 2025 with ARENA funding. Healthcare demand stays steady because hospitals replace monitors, ventilators and infusion pumps on fixed cycles.
How do operating pressures split the market?
Based on pressure range, the market is categorized into low pressure up to 10 bar, medium pressure from 10 to 100 bar and high pressure above 100 bar. Low Pressure (Up to 10 bar) sensors led with 46.0% of 2025 value because water mains, building services, HVAC and pneumatic lines operate in this band, and Sydney Water began pressure reduction across seven supply schemes in 2024–25 to curb leaks. High Pressure (Above 100 bar) sensors grow fastest at 5.9% a year as hydrogen and hydraulic duty widen, and the CSIRO refueling station at Clayton compresses hydrogen to 1,000 bar before cascade storage. Medium ranges serve gas compression, boilers and most mobile hydraulic circuits.
Why do analog loops still lead as digital output spreads?
Based on output type, the market is categorized into analog output and digital output. Analog Output devices led with 58.0% of 2025 value because most installed control systems in mines, plants and utilities read 4-20 mA loops, and RS Australia lists a WIKA SA-11 two-wire 4-20 mA transmitter at AUD 1,383.27 before GST. Digital Output devices grow fastest at 6.0% a year as buyers want remote setup and diagnostics, and an ifm PV8060 sensor with an IO-Link interface lists at AUD 403.87 before GST. Many digital transmitters still keep an analog loop for legacy systems.
| Segment Group | Leading Sub-segment | Share, 2025 | Fastest-growing Sub-segment | CAGR, 2026–2035 |
|---|---|---|---|---|
| By Technology | Piezoresistive | 47.0% | Resonant Solid-State | 6.4% |
| By Application | Industrial Manufacturing & Mining | 27.0% | Energy and Power | 6.5% |
| By Pressure Range | Low Pressure (Up to 10 bar) | 46.0% | High Pressure (Above 100 bar) | 5.9% |
| By Output Type | Analog Output | 58.0% | Digital Output | 6.0% |
Sensor prices span from AUD 60 chips to AUD 1,400 units
Pressure sensor pricing is set per unit, and the gap between a bare sensing element and a finished transmitter is large because housings, approvals, calibration and communication add most of the cost. A board-mount silicon sensor costs about AUD 57 to AUD 60 each in small lots, while finished industrial transmitters list between about AUD 390 and AUD 1,400 before GST, as the rows below show. Exchange rates and freight move landed costs, and hazardous-area or hygienic approvals add a premium. Project buyers negotiate frame prices below list, so distributors earn most margin on small orders, urgent spares and calibration services.
| Product | Typical price or fee | Basis |
|---|---|---|
| Honeywell ABP board-mount sensor, 0 to 30 psi gauge | AUD 59.75 each, AUD 57.41 at 25 or more | RS Australia online list price, November 2026 |
| ifm PK5524 pressure switch with sensing cell, 0 to 145 psi | AUD 387.16 excluding GST | RS Australia online list price, November 2026 |
| ifm PV8060 sensor with IO-Link, up to 8,700 psi | AUD 403.87 excluding GST | RS Australia online list price, November 2026 |
| WIKA S-20 transmitter, 0 to 2.5 bar | AUD 956.54 excluding GST | RS Australia online list price, November 2026 |
| WIKA SA-11 two-wire 4-20 mA transmitter, 0 to 10 bar | AUD 1,383.27 excluding GST | RS Australia online list price, November 2026 |
Request a Free Sample
Fill in your details and we'll send you a free sample report.
- Sample data tables & charts
- Research methodology
Mine automation, LNG start-ups and leak control lift demand
Driverless and electric mine fleets need more sensing
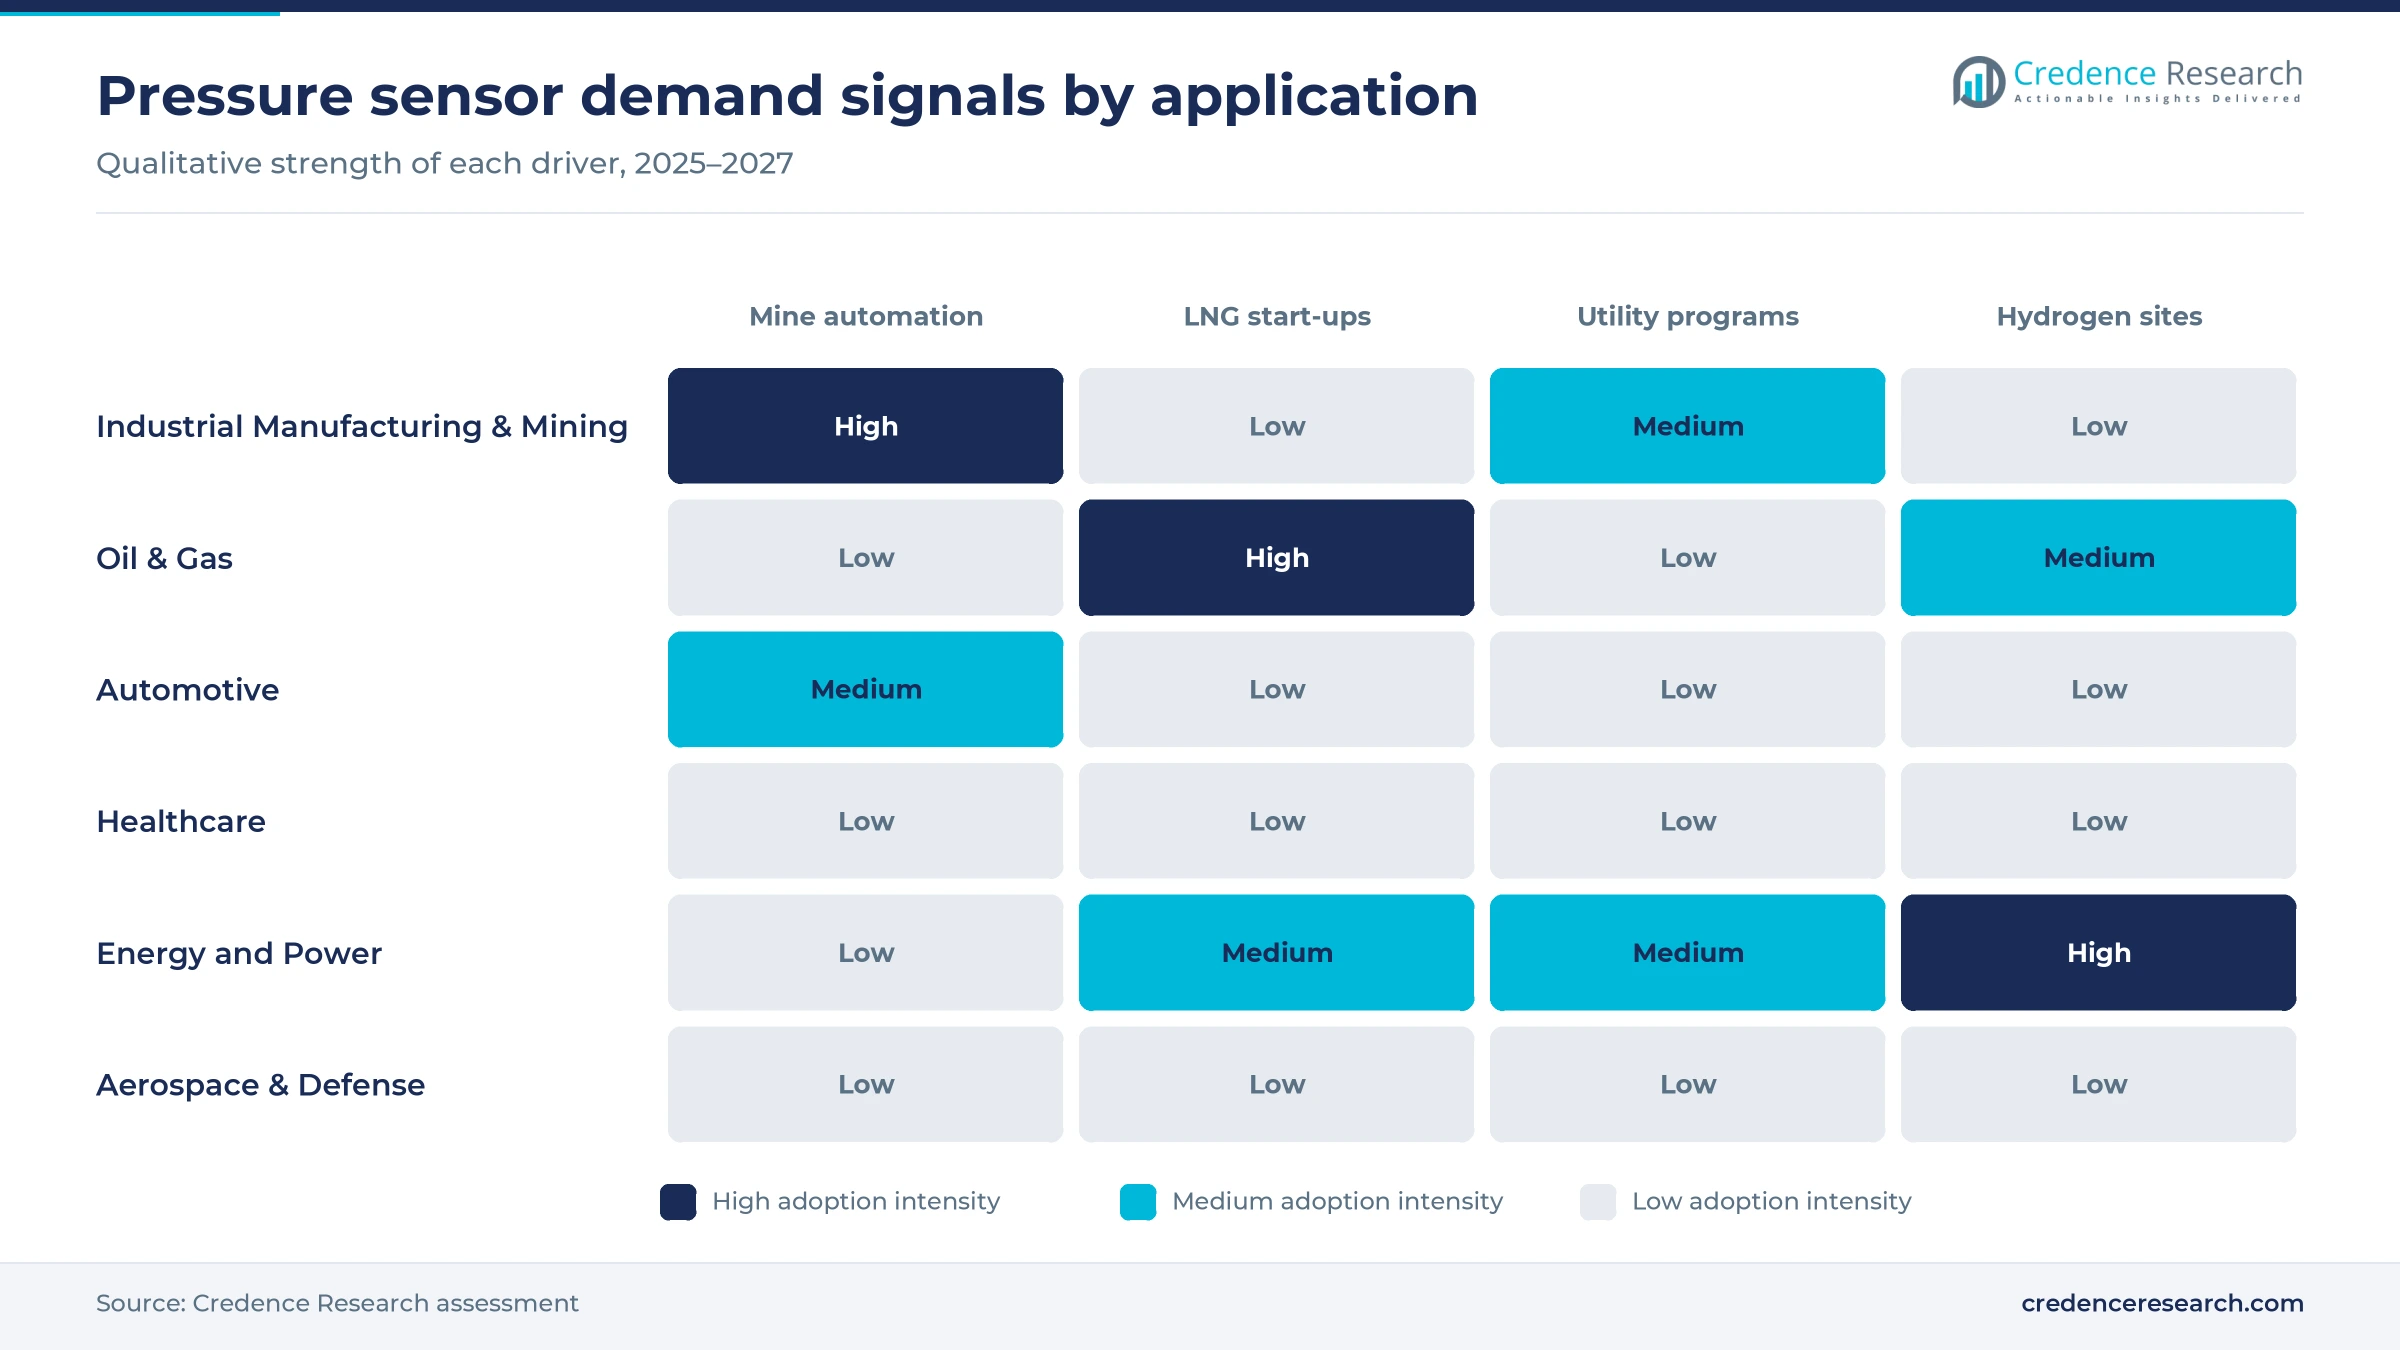
Mine automation is the largest single source of new sensor demand, because driverless haul trucks rely on hydraulic, brake, tire and engine pressure signals that no onboard driver checks. According to Global Mining Review, Hancock Iron Ore converted 78 haul trucks at Roy Hill from manual to driverless capability, with 60 allocated to autonomous haulage and the final phase on track for completion by December 2025. BHP, Rio Tinto and Caterpillar began testing two battery-electric Cat 793 XE trucks at Jimblebar, as Caterpillar reported on June 23, 2026, adding coolant and charging pressure points. The Australian Bureau of Statistics also recorded a 7.2% rise in mining equipment and machinery investment in the March quarter of 2026. Suppliers of rugged transmitters for underground mining equipment and surface fleets gain most.
New LNG supply adds process and safety instruments
New gas capacity lifts demand for process transmitters, because wellheads, floating production units and liquefaction trains each need thousands of pressure points for control and shutdown systems. Santos reported that the Barossa floating production unit reached ready-for-start-up status on Sept. 16, 2025, and can handle 850 million standard cubic feet of gas a day for Darwin LNG. Woodside reported Scarborough and Pluto Train 2 at 99% complete at the end of September 2026, with the first cargo due in the fourth quarter. Australia already exported 4,509 petajoules of LNG in 2023–24, according to Geoscience Australia. Instrument makers with hazardous-area approvals win the build orders, while upstream oil and gas operators then buy spares and calibration services for two decades.
Leak targets push utilities toward pressure control
Water utilities are buying more pressure monitoring because lowering and steadying network pressure is the cheapest way to cut leaks and main breaks. Leakage on the Sydney network was about 130 megaliters a day in 2024–25, or 8.6% of drinking water supplied, according to the Sydney Water performance report, which set a target of 7% or less by 2030. The same report says pressure reduction work began across seven supply schemes, with a new scheme planned from 2025–26. Melbourne Water also started its largest connected metering project in March 2026, adding real-time telemetry on diversion meters along the Yarra. Utilities buying logger-ready sensors for district metered areas favor suppliers with low-power transmitters and local calibration.
Factory and data hall investment widens industrial use
Equipment investment is widening the industrial base for pressure sensors, because new production lines, compressors, chillers and fluid systems ship with transmitters and switches fitted. The Australian Bureau of Statistics reported that private investment in equipment and machinery rose 18.1% in the March quarter of 2026 to a record level. Investment by the information media and telecommunications industry, which the bureau tied to data center equipment, rose 96.1% to a record level in the same quarter, and each new data hall adds chilled water and air pressure monitoring. Export Finance Australia reported that manufacturing output rose 3.2% over the year to the first quarter of 2026, ahead of national growth. Plant builders connecting sensors to industrial IoT platforms create the strongest pull for configurable digital instruments.
Smart transmitters, refrigerants and hydrogen reshape demand
Shift toward diagnostic, wireless-configured transmitters
Plant operators are shifting toward transmitters that report their own health, because fewer technicians must cover more instruments across remote mines and offshore sites. Emerson released the Rosemount 4051S on Oct. 23, 2025, with plugged impulse line detection, loop integrity checks and Bluetooth setup from up to 15 meters away. The same transmitter adds two relay switches that can control pumps directly in some uses, replacing a separate controller. Yokogawa transmitters already pair silicon resonant sensing with HART and FOUNDATION fieldbus communication, which lets control rooms read differential and static pressure together. This shift favors suppliers with device management software and local support staff, while basic analog models compete mainly on price in replacement work.
Rise of high-pressure refrigerants in cooling systems
Refrigeration and air conditioning buyers are shifting toward lower-impact refrigerants that run at higher or more varied pressures, which raises the specification for system sensors. Under the national HFC phase-down schedule, the HFC import limit fell from 5.25 million metric tons of CO2 equivalent a year in 2024–2025 to 4.25 million metric tons in 2026–2027, with an 85% cut reached on Dec. 31, 2035. RS Australia describes the ifm PK5524 pressure switch for hydraulic, pneumatic and refrigeration use, a sign that refrigeration is a standard distributor category. The data center investment surge noted above adds chilled water and refrigerant circuits. Sensor makers with refrigerant-compatible seals and approvals gain share as contractors redesign plant rooms.
Opening in hydrogen refueling and gas blending
Hydrogen offers the clearest new opening for high-pressure transmitters, because compressors, storage cascades and dispensers need accurate readings at several hundred bar to meet safety rules. The CSIRO station at Clayton dispenses hydrogen at 700 bar for cars and stores it in a cascade at up to 1,000 bar, according to CSIRO. Hydrogen Park South Australia supplies a renewable hydrogen blend to nearly 4,000 homes and businesses in Adelaide, according to the Australian Gas Infrastructure Group, which targets renewable gas blends of at least 10% by 2030. Suppliers of transmitters for hydrogen storage and blending can win early reference sites, although volumes remain small. ARENA committed AUD 34 million to the Geelong station, which shows how grants still set the pace of hydrogen sensor demand.
Opening for locally made and locally serviced sensors
Buyers in defense, mining and aerospace increasingly value suppliers that can design, modify and calibrate sensors locally, because long overseas lead times delay repairs and custom work. Applied Measurement Australia announced on June 23, 2026 that it will distribute transducers from Apogee Transducer Technologies, whose products are 100% designed and made in Australia for mining, defense, aerospace and automation. Endress+Hauser opened an AUD 19 million Sydney headquarters at Artarmon in November 2023 with a service workshop and training area. VEGA Australia offers repairs, local stock and technicians from Caringbah, according to Manufacturers' Monthly in June 2024. Suppliers that pair local stock with application engineering can win higher-margin custom orders that importers serve poorly.
Import reliance, flat car sales and capex cycles weigh
Import dependence exposes buyers to currency swings
Almost all pressure instruments are imported, which ties local prices to exchange rates, freight and overseas lead times. Australia imported USD 119 million of instruments for measuring pressure in 2023 and exported USD 17.1 million, according to UN Comtrade data compiled by TrendEconomy. Imports across the wider flow, level and pressure heading rose 13.7% to USD 355 million that year. Distributors holding stock bought at a weaker currency are most exposed, while buyers face longer waits for special ranges and materials.
A flat vehicle market limits automotive demand
Automotive demand is limited because Australia builds no cars and new vehicle sales barely grew in 2025. Sales reached 1,241,037 vehicles in 2025, up only 0.3% on 2024, according to VFACTS data reported by CarExpert. No Australian Design Rule required tire pressure monitoring when the Department of Infrastructure consulted on a mandate, according to Heavy Vehicle Industry Australia in November 2023. Aftermarket sensor suppliers are most exposed, since replacement volumes depend on the fitted fleet rather than on regulation.
A thin manufacturing base caps factory demand
Factory demand for pressure sensors is limited by the small size of local manufacturing relative to the economy. Manufacturing value added equaled about 5.32% of Australian GDP in 2025, according to World Bank data, below the share in most industrial economies. Equipment builders that integrate sensors into machines are therefore few, so most sales go to end users replacing or adding instruments. Distributors serving general industry face slower volume growth than those serving resources and utilities.
Lower resource earnings could delay new projects
Mining and gas projects drive much of the market, so weaker commodity earnings can delay the plant orders that carry instrument packages. The Department of Industry, Science and Resources estimated resources and energy export earnings at AUD 385 billion in 2024–25 and forecast AUD 369 billion in 2025–26 and AUD 354 billion in 2026–27. Suppliers relying on new project packages are most exposed, while those earning from spares, calibration and replacement transmitters in operating sites face less risk.
Sydney utilities lead as Pilbara gas and mines add most
Zone shares of the Australia pressure sensor market are Credence Research estimates derived from the location of utilities, hospitals, factories, mines and gas facilities, weighted by the investment and project records below. New South Wales, Victoria and Queensland hold most installed instruments, while Western Australia adds the most new project demand.
| Region | Value, 2025 (USD million) | Share, 2025 | CAGR, 2026–2035 |
|---|---|---|---|
| New South Wales | 53.0 | 31.0% | 5.0% |
| Victoria | 39.3 | 23.0% | 4.6% |
| Queensland | 32.5 | 19.0% | 5.2% |
| Western Australia | 30.8 | 18.0% | 5.8% |
| Rest of Australia | 15.4 | 9.0% | 5.4% |
New South Wales leads on utilities and supplier hubs
The largest water utility, the largest hospital network and a broad manufacturing base around Sydney and the Hunter give New South Wales the biggest installed base of instruments, so the state held 31.0% of 2025 demand and grows at 5.0% a year. Private new capital expenditure in the state rose 22.1% in the March quarter of 2026, the strongest gain of any state, according to the Australian Bureau of Statistics. Endress+Hauser, WIKA and ifm run Sydney offices, which keeps calibration, stock and training close to buyers. The leak-reduction program at Sydney Water noted above adds steady low-pressure demand.
Western Australia gains most from LNG and driverless fleets
New LNG capacity and electrifying mine fleets make Western Australia the fastest zone, growing at 5.8% a year from 18.0% of 2025 demand. The Scarborough start-up described in the drivers adds a large new process plant near Karratha. Mine fleets are changing too, and the battery-electric haul truck trial at BHP Jimblebar in the Pilbara adds new pressure points for charging and cooling systems. WIKA Australia and ifm both list Perth area offices, as suppliers position for Pilbara and Goldfields resource customers. Replacement demand from iron ore, gold and lithium plants keeps volumes high between project waves.
Victoria leans on manufacturing and new hydrogen sites
A manufacturing base that adds fewer new plants than the resource states leaves Victoria as the slowest zone, with 23.0% of 2025 demand and growth of 4.6% a year. The Geelong hydrogen refueling station noted in the segment section gives the state an early high-pressure reference site. Melbourne Water also began real-time telemetry on diversion meters in March 2026. The Australian Bureau of Statistics noted that Victoria, where private capital expenditure rose 12.7% in the March quarter of 2026, is seeing the bulk of data center investment.
Queensland relies on Gladstone gas and coal mines
The three LNG plants on Curtis Island and the coal seam gas fields that supply them run large populations of pressure instruments, giving Queensland 19.0% of 2025 demand and growth of 5.2% a year. Gladstone LNG exports fell 1.3% in 2025 on lower volumes to China, according to Gladstone Ports Corporation data reported by LNG Prime in January 2026. Demand in the state is therefore weighted toward maintenance and replacement, with coal mines and Brisbane utilities adding steady orders rather than new project packages.
South Australia and the Territory add gas and hydrogen
Gas production in the Northern Territory and hydrogen trials in Adelaide drive demand in Rest of Australia, which covers South Australia, the Northern Territory, Tasmania and the ACT and held 9.0% of 2025 demand, growing at 5.4% a year. The Barossa start-up noted above feeds Darwin LNG for about two decades, adding offshore and onshore instruments in the Territory. Hydrogen Park South Australia, the blending site mentioned in the trends, keeps Adelaide at the front of gas network trials. Defense shipbuilding and water utilities in Adelaide add smaller, steadier demand for certified transmitters.
Gas start-ups, launches and local deals mark 2025–2026
| Development | Status and market relevance |
|---|---|
| In October 2026, Woodside reported Scarborough and Pluto Train 2 at 99% complete, with gas in the warm end of the train and first LNG due in the fourth quarter. | Commissioning under way; first cargo pending |
| In June 2026, Applied Measurement Australia signed an authorized distribution and technical partnership for transducers made by Apogee Transducer Technologies. | Agreement signed; distribution under way |
| In June 2026, BHP, Rio Tinto and Caterpillar demonstrated two battery-electric Cat 793 XE haul trucks at Jimblebar after about three months of testing. | Field trial; next phase to test dynamic charging |
| In September 2025, Santos reported the Barossa floating production unit ready for start-up, with capacity of 850 million standard cubic feet of gas a day for Darwin LNG. | Commissioning milestone; instrument spares and calibration demand follow |
| In October 2025, Emerson released the Rosemount 4051S pressure transmitter with Bluetooth setup, relay outputs and SIL 2/3 certification. | Commercial launch |
Silicon cells, resonant sensing and digital links matter
- Piezoresistive silicon cells measure strain in a thin diaphragm and remain the low-cost core of most board-level sensors and general industrial transmitters.
- Silicon resonant sensing reads pressure as a change in resonator frequency, which Yokogawa says gives small temperature effects and long-term stability for gas and flow duty.
- IO-Link and HART communication let maintenance teams configure ranges and read diagnostics remotely, which cuts site visits at remote mines and pump stations.
- Functional safety certification under IEC 61508 lets transmitters serve shutdown systems in LNG and processing plants, where SIL ratings are a condition of purchase.
Need a Custom Version of This Report?
Tailor the scope, geography, or segments to your exact requirements.
- Custom geography or segment scope
- Direct access to our analyst team
Global instrument makers compete through local service
Competition in Australia pressure sensor supply is split between process instrument makers, factory automation brands, mobile hydraulic and refrigeration specialists and a few local makers and distributors. WIKA Australia, Endress+Hauser, Emerson through Rosemount and Yokogawa lead process transmitters for gas, mining and water, and win much of their volume through engineering contractors and long service relationships. ABB and Siemens compete on transmitters bundled with control systems. ifm efector and Danfoss sell compact sensors to machine builders, fleets and refrigeration contractors, while Honeywell and Sensata supply board-level and transportation sensors. VEGA supplies process pressure and level instruments from its Caringbah base. Apogee Transducer Technologies offers locally designed and built transducers through Applied Measurement Australia. Buyers weigh approvals, delivery time, calibration support and diagnostics more than unit price on critical loops, while price decides most replacement orders.
Why do subsidiaries of global makers dominate supply?
The supply side is import-led and concentrated among multinational instrument makers that sell through Australian subsidiaries, with distributors and system integrators handling smaller accounts. WIKA, Endress+Hauser, Emerson, Yokogawa, ABB and Siemens supply process transmitters and win project packages through engineering contractors, while ifm, Danfoss and Sensata supply factory, mobile hydraulic and refrigeration sensors. Entry barriers are hazardous-area certification, functional safety approvals and the cost of local calibration and service, which keeps new entrants to niche uses. Margins sit mainly in configured transmitters, spares and service contracts, while bare sensing elements sell in volume at thin margins to makers of ventilators, patient monitors and other medical devices and healthcare technology.
Transmitter, compact sensor and local transducer suppliers
| Company | Type | Role in the market |
|---|---|---|
| WIKA Australia (WIKA Group) | Full-line supplier | Pressure transmitters, transducers, gauges and calibration for process and utility buyers |
| Endress+Hauser Australia | Full-line supplier | Process pressure and differential pressure transmitters with service from Sydney |
| Emerson Electric (Rosemount) | Full-line supplier | Rosemount process pressure transmitters for gas, mining and water plants |
| Yokogawa Australia | Full-line supplier | Silicon resonant pressure transmitters and control systems for LNG and process plants |
| ABB Australia | Full-line supplier | Pressure transmitters sold alongside automation and control systems |
| Siemens Australia | Full-line supplier | Process pressure transmitters integrated with automation and water systems |
| Honeywell International | Specialist supplier | Board-mount pressure sensors and industrial transmitters through distributors |
| ifm efector Australia | Specialist supplier | Compact pressure sensors and switches with IO-Link for machines |
| VEGA Australia | Specialist supplier | Process and hydrostatic pressure instruments with local repair and stock |
| Danfoss | Specialist supplier | Pressure transmitters for refrigeration, HVAC and mobile hydraulics |
| Sensata Technologies | Specialist supplier | Automotive, tire and heavy vehicle pressure sensors |
| Apogee Transducer Technologies | Local manufacturer | Pressure transducers designed and made in Australia for mining and defense |
Service reach and certification decide supplier share
Credence Research's view is that the Australia pressure sensor market will track resource projects, utilities and plant maintenance rather than vehicle or electronics production, so service reach and certification matter more than factory scale. LNG start-ups and driverless mine fleets add the most new demand, while water utilities and hospitals provide steady replacement volume. Digital transmitters and hydrogen sites create smaller but higher-margin niches for suppliers. The main assumption is that project pipelines hold as commodity earnings ease, and the largest evidence gap is the absence of an official sales series, so the estimate rests on trade data, list prices and project records.
Trade data and price checks anchor the estimate
The report uses 2025 as the base year and 2035 as the final forecast year, with market values from the Credence Research model. The 2025 value was carried forward from the earlier 2024 estimate on this page at its own growth rate and then checked against import and export statistics for pressure measuring instruments, an allowance for sensors classified elsewhere, typical distributor margins and a top-down share of Asia Pacific demand, which gave a range of about USD 145 million to USD 205 million. Segment and zone splits are Credence Research estimates informed by trade data, list prices, utility reports, project releases and official statistics. No interviews or surveys were conducted for this edition of the analysis.
Resource projects and utilities carry growth to 2035
The Australia pressure sensor market is forecast to reach USD 282.5 million by 2035 from USD 179.8 million in 2026, a 5.15% CAGR over 2026–2035. Early years should bring instrument orders and spares from the Barossa and Scarborough start-ups, more driverless and electric mine fleets and utility pressure management programs. Later in the period, refrigerant changes, hydrogen sites and digital transmitter upgrades should matter more, while vehicle demand stays flat. New South Wales should remain the largest zone, although Western Australia gains share. Suppliers with certified products, local calibration and diagnostic software should capture most of the growth.
Gas start-ups and mine spending set the 2035 range
The range of outcomes depends on whether new LNG and mine projects proceed as commodity earnings soften, how fast utilities extend pressure management and whether hydrogen moves beyond grant-funded pilots. The downside case assumes lower resource earnings delay new plants while vehicle sales stay flat. The upside case assumes Scarborough and later gas phases run to plan, mines keep automating and hydrogen sites multiply.
| Scenario | CAGR, 2026–2035 | Value, 2035 | What has to hold |
|---|---|---|---|
| Downside | 3.8% | USD 250.4 million | Lower resource earnings delay new plants and imported sensor prices keep falling |
| Base | 5.15% | USD 282.5 million | LNG start-ups, mine automation and utility leak programs proceed as planned |
| Upside | 6.5% | USD 315.6 million | Gas expansions, mine electrification and hydrogen sites all advance on schedule |
Frequently Asked Questions
How big is the Australia pressure sensor market?
Which technology leads the market?
Which application buys the most pressure sensors?
How much does an industrial pressure transmitter cost in Australia?
Does Australia make its own pressure sensors?
How will hydrogen affect pressure sensor demand?
Which zone holds the largest share?
Who are the leading pressure sensor suppliers in Australia?
Table of Content
Chapter 1 Market Segmentation
- 1.1 Segmentation Framework
- 1.1.1 Product and Service Classification
- 1.1.2 Application and End-Use Classification
- 1.1.3 Technology and Solution Classification
- 1.1.4 Customer and Distribution Channel Classification
- 1.1.5 Geographic Segmentation
- 1.1.6 Market Segment Definitions and Boundaries
- 1.2 By Technology
- 1.2.1 Piezoresistive
- 1.2.2 Capacitive
- 1.2.3 Electromagnetic
- 1.2.4 Resonant Solid-State
- 1.2.5 Optical
- 1.3 By Application
- 1.3.1 Industrial Manufacturing & Mining
- 1.3.2 Oil & Gas
- 1.3.3 Automotive
- 1.3.4 Healthcare
- 1.3.5 Energy and Power
- 1.3.6 Consumer Electronics
- 1.3.7 Aerospace & Defense
- 1.4 By Pressure Range
- 1.4.1 Low Pressure (Up to 10 bar)
- 1.4.2 Medium Pressure (10 bar – 100 bar)
- 1.4.3 High Pressure (Above 100 bar)
- 1.5 By Output Type
- 1.5.1 Analog Output
- 1.5.2 Digital Output
Chapter 2 Introduction
- 2.1 Report Objectives and Scope
- 2.2 Product Definition and Industry Terminology
- 2.3 Market Inclusions and Exclusions
- 2.4 Research Process
- 2.4.1 Primary Research and Expert Interviews
- 2.4.2 Secondary Research and Source Review
- 2.4.3 Top-Down and Bottom-Up Estimation
- 2.4.4 Data Triangulation and Verification
- 2.5 Market Size Measurement Basis
- 2.5.1 2025: USD 171.0 million → 2035: USD 282.5 million
- 2.6 Historical and Forecast Reference Periods
- 2.6.1 Historical Period: 2018-2025
- 2.6.2 Base Year: 2025
- 2.6.3 Forecast Period: 2025-2035
- 2.7 Research Assumptions and Limitations
Chapter 3 Executive Summary
- 3.1 Market Snapshot and Key Findings
- 3.2 Base-Year Market Size, 2025
- 3.3 Forecast Market Size, 2035
- 3.4 Revenue and Volume Growth Outlook
- 3.5 Key Demand and Supply Indicators
- 3.6 Leading Market Segments
- 3.7 Fastest-Growing Market Opportunities
- 3.8 Regional Performance Highlights
- 3.9 Technology and Industry Transformation
- 3.10 Competitive Landscape Summary
- 3.11 Analyst View and Strategic Implications
Chapter 4 Australia Pressure Sensor Market Trends and Developments
- 4.1 Historical Industry Development, 2018-2025
- 4.2 Recent Market Trends and Developments
- 4.3 Demand and Customer Behavior Trends
- 4.4 Technology and Product Innovation
- 4.5 Artificial Intelligence, Automation and Digitalization
- 4.6 Local Manufacturing and Supply Chain Realignment
- 4.7 Industry Partnerships, Mergers and Acquisitions
- 4.8 Sustainability and Circular Economy Developments
- 4.9 Government and Private Sector Investment Trends
- 4.10 Emerging Business Models and Commercialization
- 4.11 Industry Developments and Announcements
Chapter 5 Australia Pressure Sensor Market Production, Supply and Demand Analysis
- 5.1 Demand Trend and Consumption Analysis, 2018-2025
- 5.2 Demand Forecast, 2025-2035
- 5.3 Production and Output Trend, 2018-2025
- 5.4 Production and Output Forecast, 2025-2035
- 5.5 Installed Capacity and Capacity Utilization
- 5.6 Company-Wise Production Plants and Statistics
- 5.6.1 Installed Production Capacity
- 5.6.2 Actual Production
- 5.6.3 Planned Capacity and Expansion Targets
- 5.7 Supply Chain Structure and Procurement Trends
- 5.8 Supply-Demand Gap and Bottlenecks
- 5.9 Import Dependence and Sourcing Structure
- 5.10 Contract Manufacturing and Outsourcing
- 5.11 Regional Supply and Demand Concentration
Chapter 6 Australia Pressure Sensor Market Pricing Analysis
- 6.1 Pricing Structure and Measurement
- 6.2 Historical Pricing Trends, 2018-2025
- 6.3 Pricing Outlook, 2025-2035
- 6.4 Average Selling Price and Unit Economics
- 6.5 Pricing by Product and Market Segment
- 6.6 Geographic Pricing Differences
- 6.7 Key Input, Energy, Labor and Logistics Costs
- 6.8 Contract Pricing and Purchasing Models
- 6.9 Pricing Sensitivity and Competitive Positioning
- 6.10 Price, Margin and Profitability Implications
Chapter 7 Australia Pressure Sensor Market Dynamics
- 7.1 Market Growth Drivers
- 7.1.1 Demand-Side Drivers
- 7.1.2 Technology and Innovation Drivers
- 7.1.3 Infrastructure and Investment Drivers
- 7.1.4 Regulatory and Policy Drivers
- 7.2 Market Restraints
- 7.2.1 Cost and Affordability Constraints
- 7.2.2 Technology and Adoption Barriers
- 7.2.3 Supply Chain and Operational Constraints
- 7.3 Market Challenges
- 7.3.1 Competitive Pressure and Margin Erosion
- 7.3.2 Skills, Infrastructure and Implementation Gaps
- 7.4 Emerging Market Opportunities
- 7.5 Market Dynamics Impact and Time-Horizon Assessment
Chapter 8 Australia Pressure Sensor Value Chain Analysis
- 8.1 Industry Value Chain Overview
- 8.2 Upstream Suppliers and Critical Inputs
- 8.3 Technology and Component Providers
- 8.4 Manufacturing or Service Delivery
- 8.5 Distribution, Channel Partners and Integrators
- 8.6 Downstream Applications and End Users
- 8.7 Value Addition and Profit Pools
- 8.8 Vertical Integration and Outsourcing
- 8.9 Supplier Concentration and Risk
- 8.10 Supply Chain Localization and Resilience
Chapter 9 Australia Pressure Sensor Market Regulations and Policies
- 9.1 Relevant Laws, Standards and Compliance Frameworks
- 9.2 Product, Service, Safety and Quality Requirements
- 9.3 Government Policies, Incentives and Subsidies
- 9.4 Imports, Exports and Trade Barriers
- 9.5 Public Procurement and Local Content Requirements
- 9.6 Environmental and Sustainability Compliance
- 9.7 Upcoming Policy Changes and Market Implications
Chapter 10 Australia Pressure Sensor Market Hotspots and Opportunities
- 10.1 Market Opportunity Mapping and Growth Hotspots
- 10.2 High-Growth Applications and Customer Groups
- 10.3 Underserved Markets and White-Space Opportunities
- 10.4 Emerging Technology and Product Opportunities
- 10.5 New Capacity and Investment Hotspots
- 10.6 Market Entry and Expansion Opportunities
- 10.7 Distribution and Partnership Opportunities
- 10.8 Near-Term and Long-Term Commercial Potential
- 10.9 Opportunity Attractiveness and Execution Risks
Chapter 11 Australia Pressure Sensor Market Outlook, 2025-2035
- 11.1 Market Size and Analysis
- 11.1.1 Revenue (Market Measurement: 2025: USD 171.0 million → 2035: USD 282.5 million)
- 11.1.2 Market Volume and Quantity Sold
- 11.1.3 Historical Market Size, 2018-2025
- 11.1.4 Base-Year Market Size, 2025
- 11.2 Market Forecast, 2025-2035
- 11.2.1 Revenue Forecast to 2035
- 11.2.2 Volume Forecast to 2035
- 11.2.3 CAGR and Year-on-Year Growth
- 11.2.4 Incremental Revenue Opportunity
- 11.3 Forecast Assumptions and Scenario Analysis
- 11.3.1 Base-Case Forecast
- 11.3.2 Optimistic and Conservative Scenarios
- 11.3.3 Technology, Pricing and Policy Sensitivities
- 11.4 Market Attractiveness and Growth Outlook
Chapter 12 Australia Pressure Sensor Market Segmentation and Outlook
- 12.1 Segmentation Summary and Market Shares, 2025
- 12.2 Largest and Fastest-Growing Segments
- 12.3 By Technology - Market Size and Forecast, 2025-2035
- 12.3.1 Segment Definition and Scope
- 12.3.2 Historical Market Size, 2018-2025
- 12.3.3 Revenue Forecast, 2025-2035
- 12.3.4 Volume Forecast, 2025-2035
- 12.3.5 Base-Year Market Share, 2025
- 12.3.6 Segment CAGR and Growth Drivers
- 12.3.7 Subsegment Market Size and Forecast
- 12.3.7.1 Piezoresistive
- 12.3.7.2 Capacitive
- 12.3.7.3 Electromagnetic
- 12.3.7.4 Resonant Solid-State
- 12.3.7.5 Optical
- 12.3.8 Subsegment Pricing and Adoption Trends
- 12.3.9 Leading Suppliers and Competition
- 12.3.10 Regional Demand and Opportunities
- 12.4 By Application - Market Size and Forecast, 2025-2035
- 12.4.1 Segment Definition and Scope
- 12.4.2 Historical Market Size, 2018-2025
- 12.4.3 Revenue Forecast, 2025-2035
- 12.4.4 Volume Forecast, 2025-2035
- 12.4.5 Base-Year Market Share, 2025
- 12.4.6 Segment CAGR and Growth Drivers
- 12.4.7 Subsegment Market Size and Forecast
- 12.4.7.1 Industrial Manufacturing & Mining
- 12.4.7.2 Oil & Gas
- 12.4.7.3 Automotive
- 12.4.7.4 Healthcare
- 12.4.7.5 Energy and Power
- 12.4.7.6 Consumer Electronics
- 12.4.7.7 Aerospace & Defense
- 12.4.8 Subsegment Pricing and Adoption Trends
- 12.4.9 Leading Suppliers and Competition
- 12.4.10 Regional Demand and Opportunities
- 12.5 By Pressure Range - Market Size and Forecast, 2025-2035
- 12.5.1 Segment Definition and Scope
- 12.5.2 Historical Market Size, 2018-2025
- 12.5.3 Revenue Forecast, 2025-2035
- 12.5.4 Volume Forecast, 2025-2035
- 12.5.5 Base-Year Market Share, 2025
- 12.5.6 Segment CAGR and Growth Drivers
- 12.5.7 Subsegment Market Size and Forecast
- 12.5.7.1 Low Pressure (Up to 10 bar)
- 12.5.7.2 Medium Pressure (10 bar – 100 bar)
- 12.5.7.3 High Pressure (Above 100 bar)
- 12.5.8 Subsegment Pricing and Adoption Trends
- 12.5.9 Leading Suppliers and Competition
- 12.5.10 Regional Demand and Opportunities
- 12.6 By Output Type - Market Size and Forecast, 2025-2035
- 12.6.1 Segment Definition and Scope
- 12.6.2 Historical Market Size, 2018-2025
- 12.6.3 Revenue Forecast, 2025-2035
- 12.6.4 Volume Forecast, 2025-2035
- 12.6.5 Base-Year Market Share, 2025
- 12.6.6 Segment CAGR and Growth Drivers
- 12.6.7 Subsegment Market Size and Forecast
- 12.6.7.1 Analog Output
- 12.6.7.2 Digital Output
- 12.6.8 Subsegment Pricing and Adoption Trends
- 12.6.9 Leading Suppliers and Competition
- 12.6.10 Regional Demand and Opportunities
- 12.7 Segment Growth Comparison
- 12.8 Segment Attractiveness and Priority Matrix
Chapter 13 Australia Pressure Sensor End-Use and Application Market Outlook
- 13.1 End-Use Industry and Customer Demand Structure
- 13.2 Leading Applications and Customer Groups
- 13.3 End-Use Market Size, Share and Forecast
- 13.4 Major End-Use Industry Deep Dives
- 13.4.1 Customer Requirements and Use Cases
- 13.4.2 Demand and Replacement Cycles
- 13.4.3 Technical and Regulatory Considerations
- 13.4.4 Purchasing and Procurement Models
- 13.4.5 Leading Vendors and Distribution Channels
- 13.4.6 Forecast and Commercial Opportunities
- 13.5 Emerging Applications and Cross-Segment Demand
- 13.6 End-Use Industry Investment Priorities
Chapter 14 Australia Pressure Sensor Geographic Market Outlook, 2025-2035
- 14.1 Domestic Market Distribution and Demand Clusters
- 14.2 State- or Province-Wise Market Size and Forecast, 2025-2035
- 14.3 City and Metropolitan Market Outlook
- 14.4 Industrial, Manufacturing and Commercial Clusters
- 14.5 Geographic Concentration of Key End Users
- 14.6 Local Pricing and Purchasing Differences
- 14.7 Domestic Production Facilities and Capacity Map
- 14.8 Local Infrastructure and Project Pipeline
- 14.9 State-Level Policy and Incentive Differences
- 14.10 Subnational Investment Hotspots and Opportunities
- 14.11 Distribution and Logistics Networks
- 14.12 Domestic Competitive Footprint
Chapter 15 Australia Pressure Sensor Technology, Innovation and Sustainability Outlook
- 15.1 Technology Landscape and Maturity
- 15.2 Product, Process and Service Innovation
- 15.3 AI, Automation and Digital Tools in the Industry
- 15.4 Technology Adoption and Performance Benchmarking
- 15.5 Innovation Pipeline and R&D Investment
- 15.6 Patent and Intellectual Property Trends
- 15.7 Energy Efficiency and Resource Management
- 15.8 Sustainability, Recycling and Circularity
- 15.9 Technology Roadmap, 2025-2035
- 15.10 Risks of Obsolescence and Technology Substitution
Chapter 16 Australia Pressure Sensor Market Key Strategic Imperatives
- 16.1 Growth and Market Entry Priorities
- 16.2 High-Return Products and Segments
- 16.3 Pricing, Profitability and Cost Optimization
- 16.4 Technology Investment and Product Differentiation
- 16.5 Supply Chain Localization and Resilience
- 16.6 Distribution and Customer Acquisition
- 16.7 Partnership, Acquisition and Capacity Strategy
- 16.8 Regional Expansion Priorities
- 16.9 Short-, Medium- and Long-Term Actions
Chapter 17 Competition Outlook
- 17.1 Industry Competition Characteristics
- 17.2 Market Structure and Concentration
- 17.3 Market Share and Competitive Positioning, 2025
- 17.4 Company-Wise Revenue and Product Benchmarking
- 17.5 Production and Service Capacity Benchmarking
- 17.6 Technology, Pricing and Differentiation
- 17.7 Regional Footprint and Distribution Strength
- 17.8 Mergers, Acquisitions and Strategic Alliances
- 17.9 New Entrants and Competitive Threats
- 17.10 Porter's Five Forces and Industry Attractiveness
- 17.11 Competitive Outlook, 2025-2035
Chapter 18 Company Profiles
- 18.1 Company Coverage and Selection Criteria
- 18.2 WIKA Australia (WIKA Group)
- 18.2.1 Business Description
- 18.2.2 Company Ownership and Geographic Presence
- 18.2.3 Product and Service Portfolio
- 18.2.4 Manufacturing and Operating Footprint
- 18.2.5 Production Capacity and Expansion Plans
- 18.2.6 Financial Performance and Investment
- 18.2.7 Market Share and Competitive Position
- 18.2.8 Technology and Innovation Capabilities
- 18.2.9 Strategic Alliances or Partnerships
- 18.2.10 Recent Developments
- 18.2.11 Growth Strategy and Outlook
- 18.3 Endress+Hauser Australia
- 18.4 Emerson Electric (Rosemount)
- 18.5 Yokogawa Australia
- 18.6 ABB Australia
- 18.7 Siemens Australia
- 18.8 Honeywell International
- 18.9 ifm efector Australia
- 18.10 VEGA Australia
- 18.11 Danfoss
- 18.12 Sensata Technologies
- 18.13 Apogee Transducer Technologies
- 18.14 Other Relevant Market Participants
Note: Every listed company is profiled on the structure shown under the first company. The company list is preliminary and may change based on research findings, market developments, data availability and client requirements.
Chapter 19 Disclaimer
- 19.1 Research and Forecast Disclaimer
- 19.2 Data Source and Estimation Limitations
Note: The depth of individual sections depends on data availability for this market. Volume, capacity, trade and other unit-based metrics are included where applicable.

