Market Overview
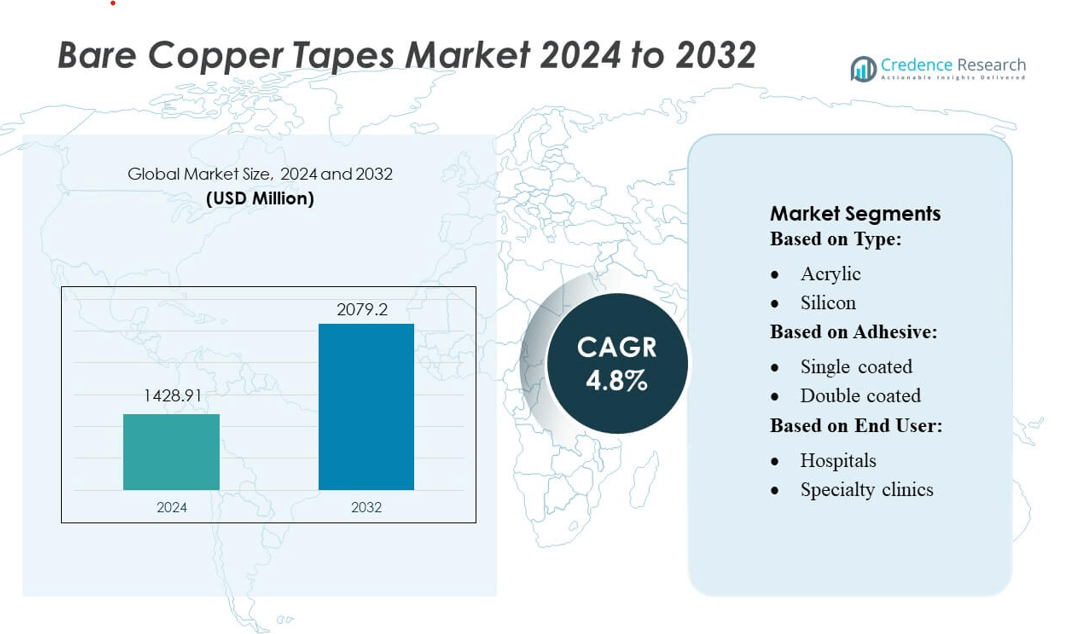
Bare Copper Tapes Market size was valued USD 1428.91 million in 2024 and is anticipated to reach USD 2079.2 million by 2032, at a CAGR of 4.8% during the forecast period.
| REPORT ATTRIBUTE |
DETAILS |
| Historical Period |
2020-2023 |
| Base Year |
2024 |
| Forecast Period |
2025-2032 |
| Bare Copper Tapes Market Size 2024 |
USD 1428.91 million |
| Bare Copper Tapes Market, CAGR |
4.8% |
| Bare Copper Tapes Market Size 2032 |
USD 2079.2 million |
The Bare Copper Tapes Market is shaped by the strong presence of leading manufacturers that consistently invest in performance enhancement, production efficiency, and application-specific product development. These top players prioritize high-conductivity materials, advanced adhesive technologies, and durable tape constructions to meet the requirements of electronics, healthcare, and industrial sectors. The market benefits from ongoing innovation, improved supply chain capabilities, and strategic collaborations that support wider global adoption. Asia-Pacific remains the leading region, accounting for approximately 38% of total market share, driven by its dominant electronics manufacturing base, rapid industrialization, and expanding infrastructure development.
Market Insights
- The Bare Copper Tapes Market was valued at USD 1,428.91 million in 2024 and is projected to reach USD 2,079.2 million by 2032, advancing at a CAGR of 4.8% during the forecast period.
- Market growth is driven by rising demand for high-conductivity materials across electronics, medical devices, and industrial grounding applications, supported by continuous infrastructure upgrades.
- Key trends include the adoption of advanced adhesive technologies, development of ultra-thin flexible tapes, and increased preference for recyclable copper solutions aligned with sustainability goals.
- Competitive activity remains strong as manufacturers focus on innovation, supply chain optimization, and OEM partnerships, while restraints include copper price volatility and competition from alternative conductive materials.
- Asia-Pacific leads the market with 38% share, while the acrylic-based tape segment holds the largest contribution of over 45%, supported by cost efficiency, durability, and broad applicability across high-growth industries.
Access crucial information at unmatched prices!
Request your sample report today & start making informed decisions powered by Credence Research Inc.!
Download Sample
Market Segmentation Analysis:
By Type
The Acrylic-based bare copper tapes segment dominates the market, accounting for over 45% of total revenue, driven by its strong adhesion, moisture resistance, and cost efficiency in electrical shielding and grounding applications. Demand continues to rise as manufacturers favor acrylic formulations for their superior durability and compatibility with high-temperature environments. Silicon-based tapes show steady growth due to enhanced thermal stability, while rubber adhesives gain traction in applications requiring high flexibility. Increasing investments in electronics manufacturing and improved material performance standards further support segment expansion.
- For instance, Nova Films & Foils, Inc., a leading tape manufacturer, offers copper and aluminum foil tapes with acrylic adhesive, including products with an adhesive thickness of up to 2.0 mils on its standard aluminum foil tapes and as thin as 0.75 mils on some industrial tapes, demonstrating their expertise in acrylic-coated solutions.
By Adhesive
The Single-coated adhesive segment leads the market with an estimated around 60% share, primarily because it meets most electrical insulation, grounding, and EMI shielding needs at a competitive cost. End users prefer single-coated tapes for easy application, reliable conductivity, and strong bonding on metallic and nonmetallic surfaces. Double-coated variants are gaining momentum in specialized applications that require stronger adhesion or dual-surface bonding, particularly in advanced circuitry and precision electronics. Growing adoption of automation in production lines enhances demand for reliable single-coated adhesives with consistent performance.
- For instance, Shurtape Technologies, LLC’s engineered solutions group produces single-sided foil tapes (like their UL-181-rated products such as AF 100) that use an acrylic, pressure-sensitive adhesive applied to a metal backing, with a typical total tape thickness of approximately 0.11 mm (4.2 mils), based on their catalog and technical spec sheets. The actual adhesive thickness is typically around 2.2 mils (approximately 0.056 mm).
By End User
The Hospital segment remains the dominant end user, holding nearly 50% market share, supported by rising demand for reliable grounding materials, enhanced safety compliance, and expanding installation of advanced medical equipment. Bare copper tapes are widely used for electrical continuity, EMI shielding, and safe power distribution across critical systems. Specialty clinics and ambulatory surgical centers increasingly adopt these tapes as they upgrade diagnostic and surgical infrastructure. Growth across other end-use facilities is driven by modernization of healthcare networks, stringent electrical safety mandates, and rising installation of precision medical devices.
Key Growth Drivers
Rising Demand for Electrical Grounding and EMI Shielding
The market grows significantly due to increasing adoption of bare copper tapes for electrical grounding, bonding, and EMI/RFI shielding across industrial, commercial, and residential installations. Rapid expansion in data centers, telecom networks, and renewable energy facilities accelerates usage as operators prioritize safety, conductivity, and system reliability. Bare copper tapes offer superior corrosion resistance and high electrical performance, making them indispensable for modern power distribution systems. Ongoing electrification and infrastructure upgrades in developing economies further reinforce demand for grounding materials with proven long-term stability.
- For instance, Nitto Denko Corporation’s P-391 CO 1 oz copper foil conductive tape features a total thickness of 0.089 mm (3.5 mil), uses soft-annealed electro-deposited copper for superior conformability, and has a UL Insulation Class rating of 155 °C (311 °F).
Expansion of Electronics Manufacturing and Miniaturized Devices
The growing production of consumer electronics, automotive electronics, and industrial automation components drives strong demand for copper tapes due to their excellent conductivity and compatibility with compact circuit architectures. Bare copper tapes enable effective current flow, noise reduction, and thermal management, making them essential in high-density PCBs, flexible electronics, and semiconductor packaging. As manufacturers adopt miniaturized designs, the need for ultra-thin, precision-engineered copper tapes increases. Government incentives supporting electronics manufacturing clusters also contribute to higher consumption across global supply chains.
- For instance, Maxell, Ltd. No. 8701 conductive copper foil tape is built with a 35 µm-thick copper foil, an acrylic adhesive mixed with copper powder, and has a total tape thickness of just 0.08 mm, as per its product datasheet.
Infrastructure Growth and Modernization of Healthcare Facilities
Rapid expansion of healthcare infrastructure, including hospitals, specialty clinics, and diagnostic centers, fuels the installation of advanced medical systems that require robust grounding and shielding solutions. Bare copper tapes ensure reliable electrical continuity, minimize equipment interference, and meet stringent safety compliance standards. Growing investments in smart hospitals and digitally connected medical facilities further elevate demand. Modernization initiatives in developing regions, coupled with rising installation of imaging, surgical, and monitoring equipment, continue to strengthen market growth for high-conductivity copper grounding materials.
Key Trends & Opportunities
Increasing Adoption of Sustainable and Recyclable Conductive Materials
A major trend shaping the market is the shift toward eco-efficient electrical materials. Bare copper tapes, being fully recyclable and long-lasting, align with sustainability objectives in construction, power distribution, and electronics. Manufacturers increasingly explore low-emission production processes and high-purity copper to meet green certification standards. The trend offers opportunities for companies to innovate in environmentally responsible conductive materials as industries seek alternatives to synthetic adhesives and non-recyclable shielding solutions, creating a positive outlook for sustainable copper-based components.
- For instance, Scapa Group Ltd’s U891 anisotropic conductive acrylic transfer tape features a 0.051 mm (2 mil) conductive adhesive layer (total tape thickness) and delivers a typical through-thickness (Z-axis) resistance of 25 mΩ (milliohms), as per its technical data sheet.
Growth of Smart Infrastructure and IoT-Enabled Electrical Systems
The rising deployment of smart buildings, intelligent grids, and IoT-enabled infrastructure expands opportunities for advanced grounding and shielding components. Bare copper tapes support uninterrupted connectivity, fault protection, and EMI suppression in sensor-equipped networks, communication hubs, and automation systems. Growing adoption of building automation, energy-efficient electrical architectures, and predictive maintenance technologies further increases usage of high-performance conductive tapes. This trend positions copper solutions as integral components in the evolution of connected environments and digitally managed industrial ecosystems.
- For instance, All Foils, Inc. adhesive-coated copper foils are manufactured in gauges from 0.002″ to 0.015″, supporting widths up to 36″, per their product catalog.
Increasing Use in High-Frequency and High-Performance Electronics
As industries shift toward high-frequency communication devices, EV electronics, and precision medical equipment, demand grows for copper tapes capable of supporting high-speed signal transmission and reduced interference. Manufacturers are exploring thinner, more flexible, and thermally stable copper tapes to meet advanced engineering requirements. Opportunities emerge for product differentiation through improved conductivity, superior surface finish, and enhanced bonding characteristics. This trend supports continued innovation and specialized product development within electronics-intensive sectors.
Key Challenges
Volatility in Copper Prices and Supply Chain Instability
Copper price fluctuations pose a major challenge, directly affecting production costs and profit margins for manufacturers of copper tapes. Global supply constraints, mining disruptions, and geopolitical factors contribute to inconsistent pricing. Companies face difficulties in long-term planning and often shift to alternative materials when copper prices spike. Supply chain complexities, including transportation bottlenecks and refined copper shortages, further hinder market stability. This volatility increases operational risk and restrains steady market expansion
Competition from Alternative Conductive Materials
The market faces growing competition from alternative conductive solutions such as aluminum tapes, conductive polymers, and advanced composite materials. These substitutes often provide cost advantages or lightweight properties, making them appealing for certain electronic or industrial applications. Some alternatives also demonstrate improved corrosion resistance or thermal performance, reducing dependence on copper in specific use cases. As industries prioritize cost optimization and functional efficiency, copper tape manufacturers must innovate to maintain competitiveness, particularly in high-volume and price-sensitive sectors.
Regional Analysis
North America
North America holds approximately 28% of the global market, driven by strong adoption of bare copper tapes in telecommunications, data centers, consumer electronics, and advanced healthcare facilities. The United States leads regional demand due to large-scale modernization of electrical infrastructure and strict grounding and EMI shielding regulations across commercial and industrial installations. Rising investments in smart buildings, renewable energy grids, and EV charging networks further accelerate consumption. Additionally, the region’s robust medical equipment manufacturing base and ongoing expansion of digital healthcare systems continue to support steady demand for high-conductivity copper grounding materials.
Europe
Europe accounts for nearly 25% of market share, supported by stringent electrical safety standards, technological advancements in electronics, and strong adoption of energy-efficient industrial systems. Germany, the U.K., and France remain key contributors due to extensive automation in manufacturing, rapid deployment of smart infrastructure, and heightened focus on EMI/RFI shielding in automotive and medical devices. The region benefits from policies promoting eco-friendly materials and system reliability, encouraging wider use of recyclable copper-based conductive solutions. Growing installations of renewable power plants and sustainable construction projects further strengthen Europe’s demand for precision-engineered copper tapes.
Asia-Pacific
Asia-Pacific dominates the global market with an estimated 38% share, driven by massive electronics manufacturing hubs in China, South Korea, Japan, and Taiwan. The region’s rapid industrialization, expanding healthcare infrastructure, and rising investments in 5G networks significantly boost the consumption of bare copper tapes for grounding, bonding, and EMI shielding applications. India’s growing electrical equipment and renewable energy sectors also contribute to accelerating demand. High-volume PCB production, automotive electronics growth, and infrastructure development programs position Asia-Pacific as the fastest-growing region with strong long-term potential.
Latin America
Latin America represents roughly 5% of the global market, with growth led by increasing modernization of power distribution networks and expanding industrial facilities across Brazil, Mexico, and Chile. Rising adoption of electronic devices and improved healthcare infrastructure contribute to higher usage of copper tapes for safe grounding and EMI protection. Though the region’s growth is moderate, government-driven energy projects and rising investments in commercial construction support steady demand. Local manufacturing expansion and gradual digital transformation across enterprises further enhance market penetration for copper-based conductive materials.
Middle East & Africa
The Middle East & Africa (MEA) region holds about 4% market share, driven by ongoing infrastructure development, expansion of healthcare facilities, and adoption of advanced electrical systems. Gulf countries such as the UAE and Saudi Arabia lead demand due to large construction projects, smart city initiatives, and strong investments in renewable energy and industrial automation. In Africa, increasing electrification efforts and upgrades to power grids support moderate growth. Although market maturity remains low, rising digitalization and improved safety compliance standards create opportunities for greater utilization of high-performance copper grounding tapes.
Market Segmentations:
By Type:
By Adhesive:
- Single coated
- Double coated
By End User:
- Hospitals
- Specialty clinics
By Geography
- North America
- Europe
- Germany
- France
- U.K.
- Italy
- Spain
- Rest of Europe
- Asia Pacific
- China
- Japan
- India
- South Korea
- South-east Asia
- Rest of Asia Pacific
- Latin America
- Brazil
- Argentina
- Rest of Latin America
- Middle East & Africa
- GCC Countries
- South Africa
- Rest of the Middle East and Africa
Competitive Landscape
The competitive landscape of the Bare Copper Tapes Market features prominent players such as Nova Films & Foils, Inc., Shurtape Technologies, LLC, CMS Group of Companies, Nitto Denko Corporation, Maxell, Ltd., Scapa Group Ltd, All Foils, Inc., 3M, Advance Tapes International, and Saint-Gobain S.A. The Bare Copper Tapes Market is shaped by continuous innovation, expanding production capabilities, and rising demand from electronics, healthcare, and industrial sectors. Manufacturers prioritize high-performance tapes with superior conductivity, thermal stability, and corrosion resistance to meet stringent application requirements. The market shows a balanced mix of established global producers and emerging regional suppliers, leading to steady competition in pricing, product customization, and distribution reach. Companies increasingly invest in automation, quality enhancement, and sustainable manufacturing to strengthen their market presence. Additionally, strategic partnerships with OEMs and expansion into high-growth regions support long-term competitiveness and product differentiation.
Shape Your Report to Specific Countries or Regions & Enjoy 30% Off!
Key Player Analysis
Recent Developments
- In April 2025, Adani Enterprises’ head of metals, Felipe Williams that the company would soon start its major copper smelter in Gujarat, India, and that it would be the world’s largest metallurgical complex for copper and other metals.
- In February 2025, Moranda Metals, by former Glencore and Lundin executives, creates a dynamic where capital is flowing to private ventures rather than public mining companies, despite high commodity prices.
- In April 2024, Prysmian, a global leader in energy and telecom cable systems, signed a long-term contract with Aurubis, the largest copper recycler and a leading European manufacturer of copper wire rods, to supply significant and progressively increasing volumes of copper wire rods.
- In February 2024, Saint-Gobain S.A. announced its intention to acquire CSR Limited, an Australian building materials company, which is anticipated to solidify its market presence within the construction industry in the high-growth Asia-Pacific region
Report Coverage
The research report offers an in-depth analysis based on Type, Adhesive, End-User and Geography. It details leading market players, providing an overview of their business, product offerings, investments, revenue streams, and key applications. Additionally, the report includes insights into the competitive environment, SWOT analysis, current market trends, as well as the primary drivers and constraints. Furthermore, it discusses various factors that have driven market expansion in recent years. The report also explores market dynamics, regulatory scenarios, and technological advancements that are shaping the industry. It assesses the impact of external factors and global economic changes on market growth. Lastly, it provides strategic recommendations for new entrants and established companies to navigate the complexities of the market.
Future Outlook
- The market will experience steady demand growth driven by expanding electrical infrastructure and modernization projects.
- Manufacturers will increasingly adopt automation and precision engineering to enhance product quality and production efficiency.
- Rising deployment of 5G networks and high-speed communication systems will strengthen the need for advanced EMI shielding tapes.
- The healthcare sector will continue increasing its usage as medical facilities integrate more sensitive electronic equipment.
- Sustainable and recyclable copper materials will gain prominence as industries emphasize environmentally responsible solutions.
- Growth in consumer electronics and miniaturized devices will drive demand for ultra-thin and flexible copper tapes.
- Emerging economies will contribute significantly through industrial expansion and rising electrification.
- Innovation in adhesive technologies will support improved bonding strength, durability, and thermal performance.
- Strategic collaborations between manufacturers and OEMs will enhance market penetration and long-term stability.
- Supply chain optimization and regional manufacturing expansions will become critical to ensuring reliable product availability.


