
Brazil flexfuel demand shifts toward hybrid flex value
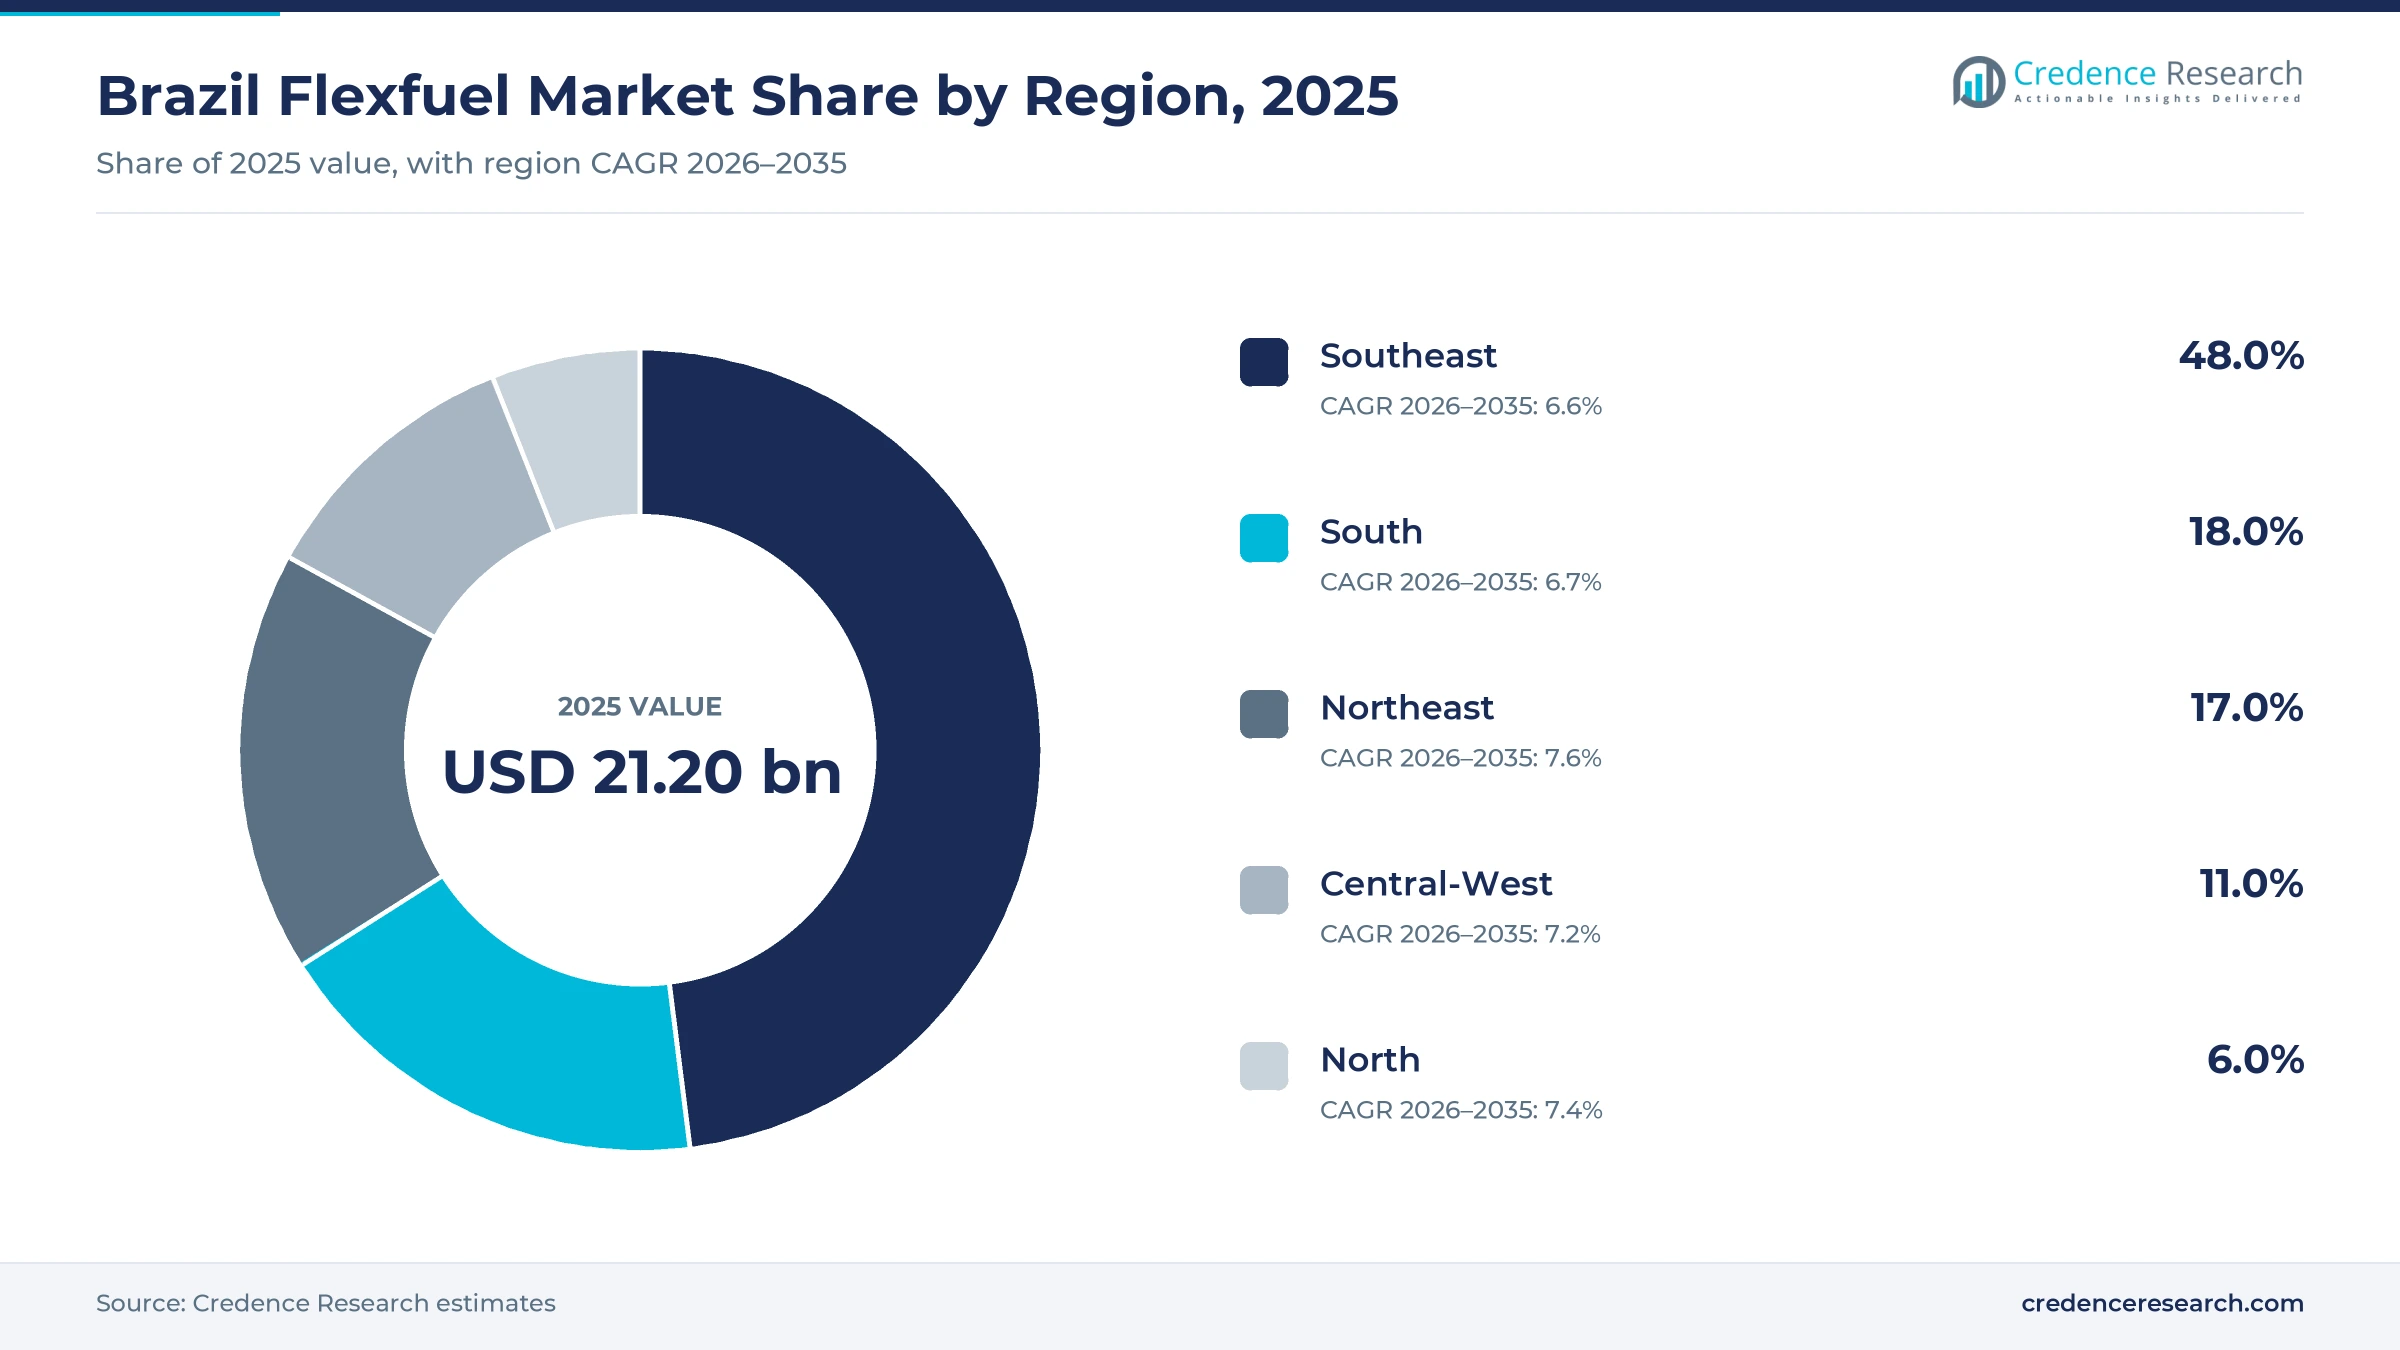
The Brazil flexfuel market was valued at USD 21.20 billion in 2025 and is projected to increase from USD 22.67 billion in 2026 to USD 41.32 billion by 2035, registering a CAGR of 6.90% during 2026–2035. Demand comes from households replacing compact cars and motorcycles, rental companies renewing fleets and buyers moving into hybrid flex models that cut fuel use. Flex engines remain standard on almost every car and most motorcycles built in the country, because drivers can choose ethanol or gasoline at each fill. The Southeast held the largest regional share, 48.0% in 2025, because São Paulo and Minas Gerais concentrate registrations, assembly plants and dealer networks. The Northeast is the fastest-growing region at 7.6% a year, helped by motorcycle and entry-car buying. The main regulatory change was the Fuel of the Future law of October 2024, which widened the legal range for ethanol in gasoline. Electrified imports remain the main restraint on conventional flex demand.
Flex-fuel cars, pickups and motorcycles define the scope
The estimate measures the manufacturer value of new flex-fuel vehicles sold in Brazil, net of taxes and dealer margins. It covers passenger cars, light commercial vehicles and motorcycles whose engines run on any mix of gasoline and hydrous ethanol, including mild, full and plug-in hybrid versions with flex engines. Buyers purchase through franchised dealers or through direct sales contracts that serve rental companies, corporate fleets and other qualified buyers.
The estimate excludes ethanol and gasoline fuel sales, used vehicles, diesel pickups and trucks, battery electric vehicles and hybrids with gasoline-only engines. Aftermarket injection parts and fuel-station equipment also sit outside the scope. The value chain runs from sugarcane and corn ethanol mills and engine plants through assemblers in São Paulo, Minas Gerais, Paraná, Bahia and Manaus to dealer networks and fleet buyers.
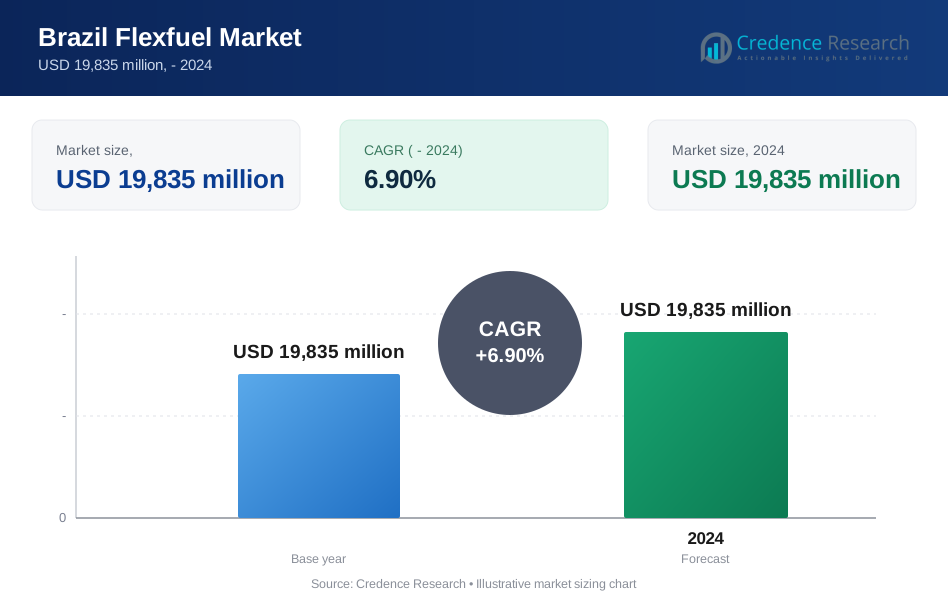
Brazil Flexfuel Market Insights
- The market was valued at USD 21.20 billion in 2025 and is projected to reach USD 41.32 billion by 2035, registering a CAGR of 6.90% during 2026–2035.
- The Southeast held 48.0% of 2025 value, as São Paulo alone had more than 15.4 million light vehicles in circulation at the end of 2025.
- Passenger cars led with 70.0% of 2025 value, because compact flex hatchbacks, sedans and SUVs make up most new registrations.
- The E30 gasoline blend took effect on Aug. 1, 2025, and the 2024 Fuel of the Future law allows the blend to rise to 35%.
- Toyota, Stellantis, General Motors, Volkswagen and BYD have committed to locally built hybrid flex models, moving competition toward electrified flex powertrains.
Cars lead while motorcycles and hybrids grow fastest
Why do passenger cars hold most of the value?
Based on vehicle type, the market is categorized into passenger cars, light commercial vehicles and motorcycles. Passenger Cars led with a 70.0% share of 2025 value, because entry hatchbacks, sedans and compact SUVs carry the largest volumes, and the three cheapest new cars of 2025, the Fiat Mobi, Citroën C3 and Renault Kwid, all use 1.0 flex engines, according to Correio Braziliense. Motorcycles grow fastest at 7.9% a year, as Abraciclo reported record motorcycle registrations of 2.19 million units in 2025, up 17.1%, while factory output rose 13.3% to 1.98 million. Light commercial vehicles stay in between, since diesel pickups fall outside the scope.
How quickly are hybrid flex powertrains gaining value?
Based on powertrain, the market is categorized into conventional flex-fuel engines and hybrid flex-fuel powertrains. Conventional Flex-Fuel Engines led with 89.0% of 2025 value, because Anfavea counted only 109,819 full hybrids of all fuel types in 2025, a small fraction of flex volume. Hybrid flex-fuel powertrains grow fastest at 13.9% a year, as Fiat's Pulse and Fastback 12-volt mild hybrid systems cut urban fuel use by 10.7% and 11.5%, according to Fiat. Toyota says the hybrid Yaris Cross uses up to 30% less fuel than its non-electrified version, which lets hybrid flex models command higher prices.
Do rental fleets or retail buyers drive more value?
Based on buyer, the market is categorized into retail buyers and rental and corporate fleets. Retail Buyers led with a 62.0% share of 2025 value, because households buy nearly all motorcycles and most higher-priced SUVs through dealers, and Abraciclo projects 2.3 million retail motorcycle registrations in 2026. Rental and corporate fleets grow fastest at 7.2% a year, as rental companies bought 628,970 cars and light commercial vehicles in 2025, 24.6% of registrations, according to the rental association ABLA. Their fleet reached 1.72 million units, up 6.2%, which keeps fleet orders focused on compact flex models with strong resale values.
| Segment Group | Leading Sub-segment | Share, 2025 | Fastest-growing Sub-segment | CAGR, 2026–2035 |
|---|---|---|---|---|
| By Vehicle Type | Passenger Cars | 70.0% | Motorcycles | 7.9% |
| By Powertrain | Conventional Flex-Fuel Engines | 89.0% | Hybrid Flex-Fuel Powertrains | 13.9% |
| By Buyer | Retail Buyers | 62.0% | Rental and Corporate Fleets | 7.2% |
Hybrid versions carry the price premium, not flex engines
Flex vehicles are sold at list price per unit, and the flex engine carries no separate premium because it is standard on almost every locally built model. The visible premium comes with electrification, which adds a battery and motor. Toyota lists the Yaris Cross XRE Hybrid R$11,000 above the XRE, about 6.8% more. Fuel prices decide which fuel owners use rather than which vehicle they buy, and the national ethanol to gasoline price ratio averaged 68.57% in 2025, according to ANP data compiled by the agriculture ministry. Assemblers that hold hybrid premiums near the Yaris Cross gap of about 7% give owners a realistic path to recover the extra cost through lower fuel use.
| Model or version | Typical price or fee | Basis |
|---|---|---|
| Fiat Mobi Like 1.0 flex, entry hatchback | R$61,072 list | Correio Braziliense, May 2025 |
| Renault Kwid 1.0 flex, entry hatchback | R$79,900 list | Correio Braziliense, May 2025 |
| Fiat Pulse Audace T200 Hybrid, 12-volt hybrid flex | R$125,990 list | Olhar Digital, November 2024 |
| Toyota Yaris Cross XRE and XRE Hybrid, full hybrid flex | R$161,390 and R$172,390 pre-sale | Toyota, November 2025 |
| BYD Song Pro GL and GS, plug-in hybrid flex | R$176,990 and R$199,990 list | Forbes Brasil, August 2026 |
| Honda CG 160 Start to Titan, flex motorcycle | R$16,770 to R$19,910 suggested | AutoPapo, September 2025 |
Request a Free Sample
Fill in your details and we'll send you a free sample report.
- Sample data tables & charts
- Research methodology
Fuel choice, blend mandates and tax credits lift sales
Why does flex remain the default choice for new buyers?
Buyers expect to choose their fuel at every fill, so local assemblers build almost every new car around an engine that runs on ethanol, gasoline or any blend of the two. Flex-fuel models took 1,897,593 registrations, or 70.6% of the total, in 2025, according to Anfavea data compiled by JETRO. Local vehicle production grew 3.7% to 2.64 million units in 2025, according to the same Anfavea data, as plants supplied both domestic dealers and export markets. Exports climbed 32.7% in the same year, which spreads engine and calibration costs over more output and keeps flex calibration work centered in Brazil. Conventional flex-fuel engines held 89.0% of 2025 value, and assemblers keep flex as the base engine for new compact cars and light pickups.
How do higher ethanol blend mandates support flex demand?
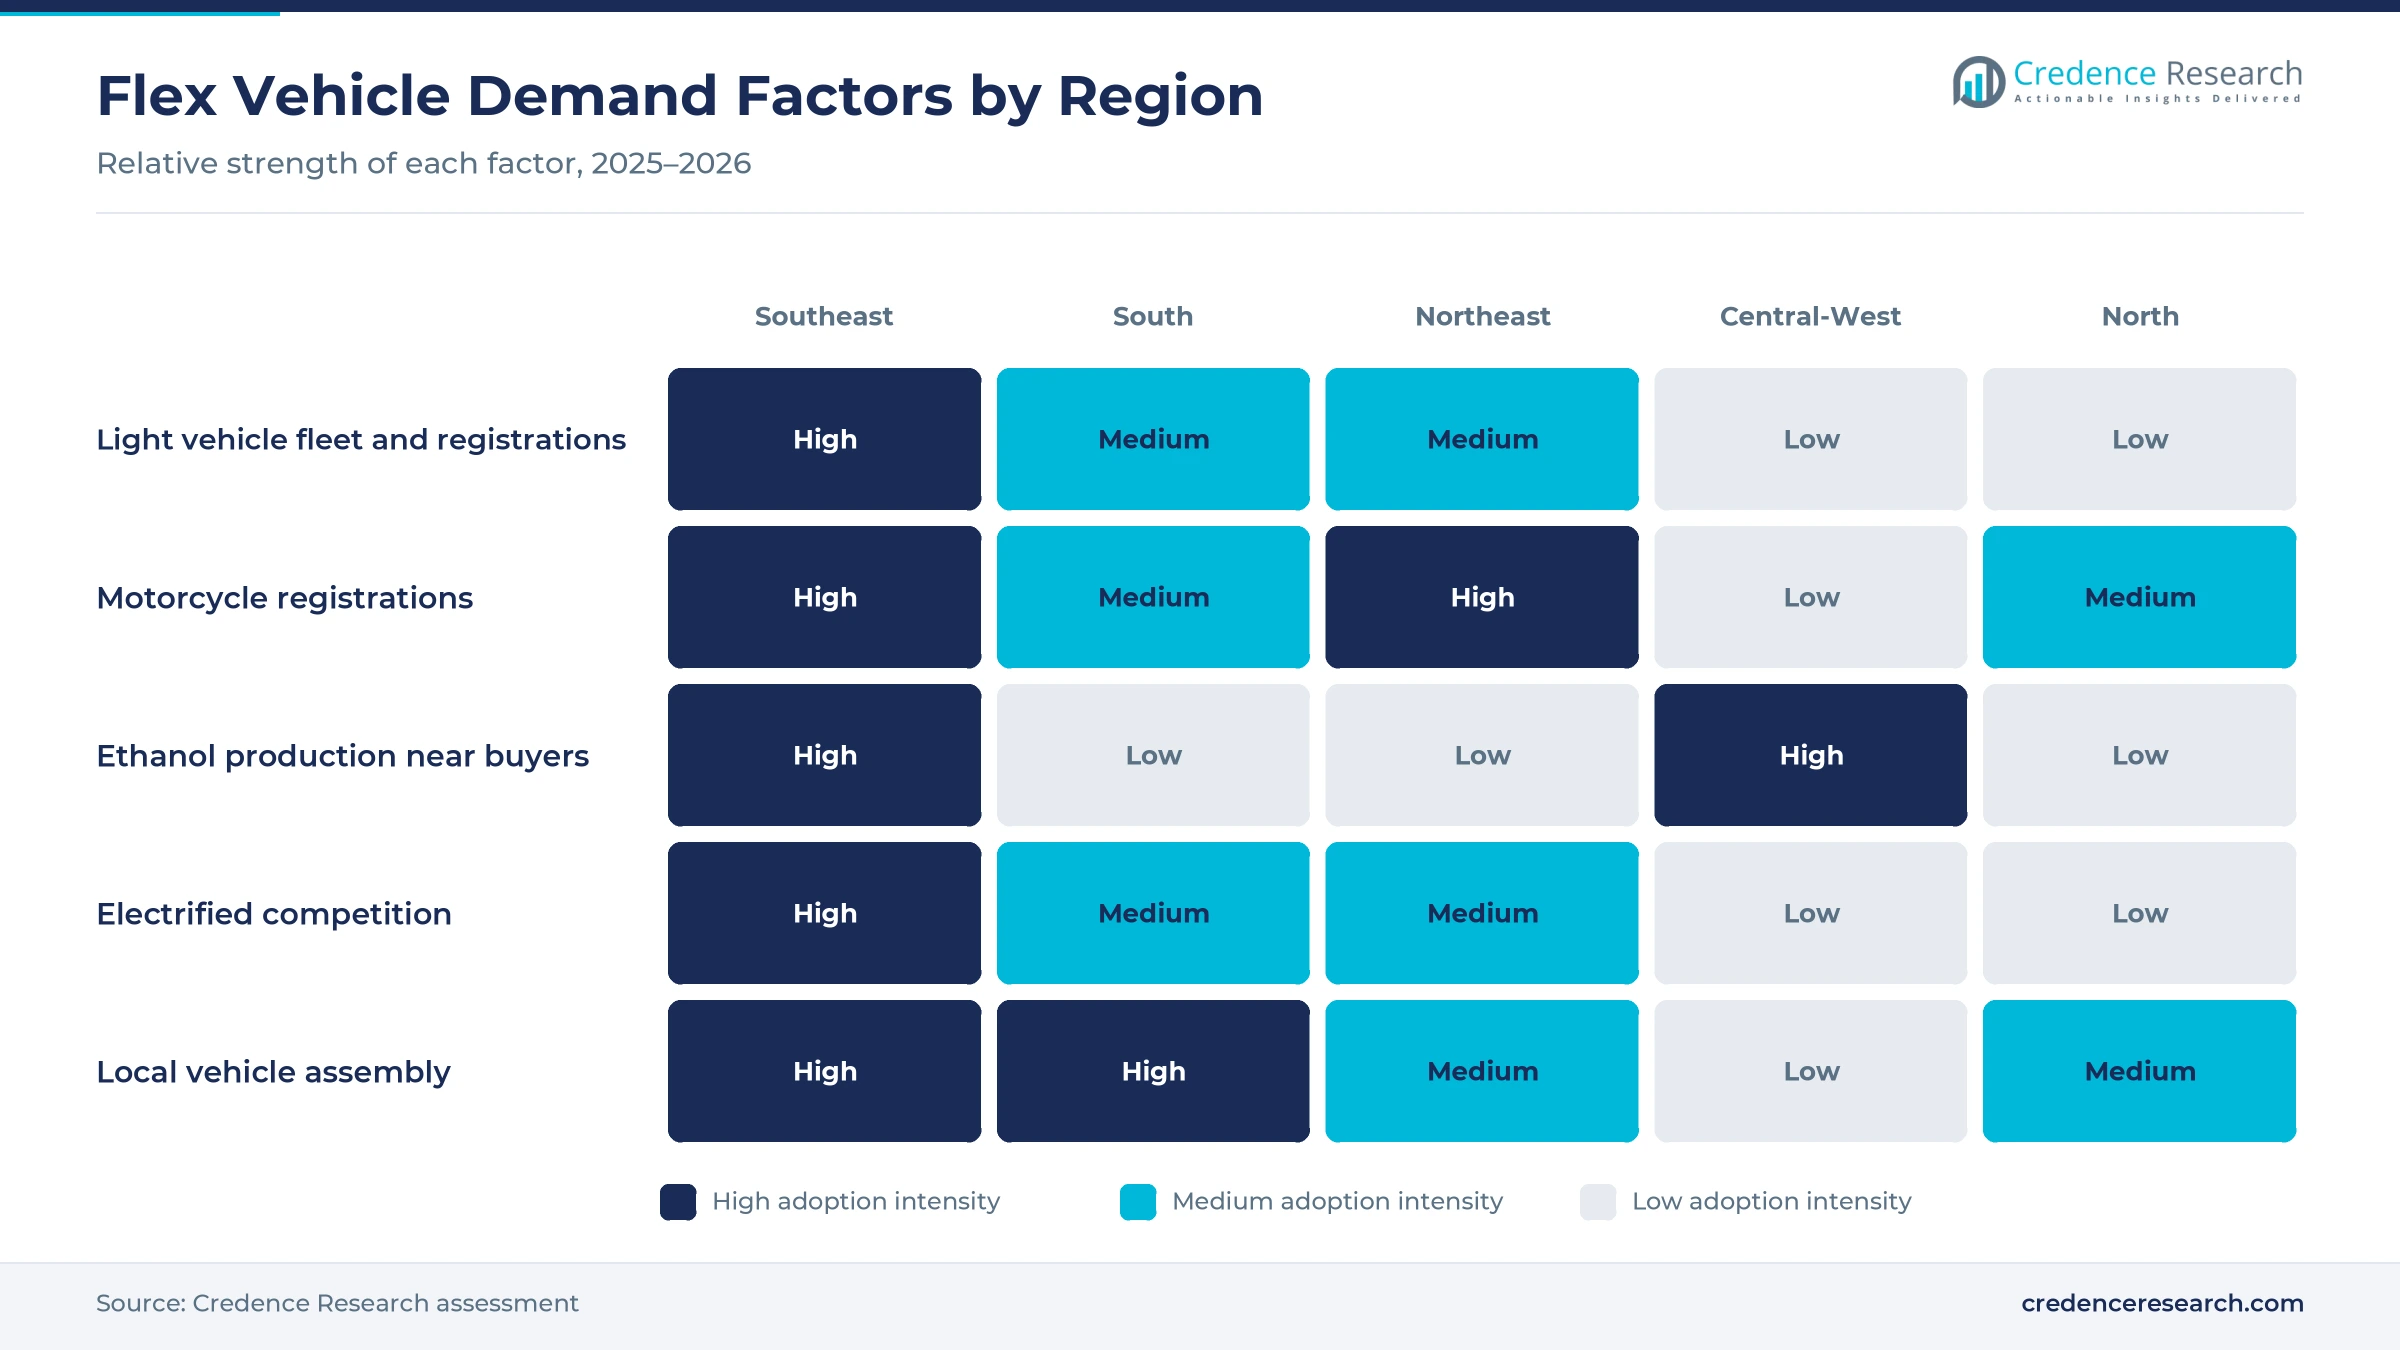
Federal blend policy keeps ethanol central to the fuel pool, which protects the case for engines that run on any mix. The National Energy Policy Council raised the anhydrous ethanol blend in gasoline from 27% to 30%, and the E30 blend took effect on Aug. 1, 2025 nationwide, the federal news agency reported. The government expects the change to create a gasoline export surplus of about 700 million liters a year and more than R$10 billion of investment in ethanol production. The Fuel of the Future law, signed on Oct. 8, 2024, set the legal blend range at 22% to 35%, according to the Senate news agency. Mills can plan capacity against a stable floor of demand, while flex owners face lower supply risk at the pump.
Why does record ethanol output strengthen fuel choice?
Owners can now count on ethanol in more months of the year, because supply no longer depends on the cane harvest alone. Brazil produced 37.5 billion liters of ethanol in 2025/26, the largest volume in Conab's historical series, and corn ethanol supplied a record 10.17 billion liters, up 29.8% and just over a quarter of the total. In the Center-South, hydrous sales rose 16.44% to 21.73 billion liters in the 2024/25 season, according to UNICA. Corn mills run through the cane off-season, so hydrous ethanol supply swings less between harvests, and buyers gain more confidence in running vehicles on ethanol.
How do Mover tax rules reward ethanol-ready powertrains?
The Mover program ties vehicle taxes to efficiency and lifecycle emissions, which favors engines that can use ethanol. Law 14.902 of June 27, 2024, sets IPI rates through a bonus-malus method and allows flex-fuel and ethanol hybrid vehicles up to three percentage points less until Dec. 31, 2026. The law measures emissions from well to wheel, so the fuel's production chain counts alongside tailpipe output. It also grants R&D credits whose annual global limit rises from R$3.5 billion in 2024 to R$4.1 billion in 2028. Assemblers that pair flex engines with hybrid systems can lower their tax rate and fund local engineering at the same time.
Assemblers move budgets to hybrid flex platforms
Shift of assembler budgets toward hybrid flex platforms
Assemblers are shifting investment from conventional engines toward hybrid flex platforms to meet Mover efficiency targets. Stellantis announced R$30 billion for South America over 2025 to 2030 in March 2024, with more than 40 new products and Betim as the global center for its Bio-Hybrid ethanol technology. Toyota announced R$11 billion for 2023 to 2030 in March 2024 to expand hybrid flex models and engines, having sold hybrid flex cars since 2020, according to Bloomberg Línea. The same report listed investment plans of R$7 billion from GM, R$9 billion from Volkswagen and R$5.5 billion from Hyundai. These programs move full hybrid powertrains into local lines and support the 13.9% growth rate of hybrid flex-fuel powertrains.
Rise of locally built flex plug-in hybrids
Chinese entrants are adapting plug-in hybrids to ethanol, an emerging shift that brings flex engines into the electrified segment. BYD opened the final assembly line of its Camaçari plant in Bahia in October 2025, with 150,000 vehicles a year of first-phase capacity, and showed what it calls the first flex engine on a plug-in hybrid architecture. Hybrid registrations reached about 187,000 units from January to July 2026, up 86%, and BYD held 26% of the hybrid market, according to Forbes Brasil. Import tax on hybrid, plug-in hybrid and battery electric cars reached 35% on July 1, 2026, the same rate as combustion imports, Vrum reported, which rewards local assembly. In turn, plug-in flex models compete directly with top trims of conventional flex SUVs.
Opening for flex motorcycles among work riders
Work and delivery riders create the clearest volume opening, because they need low running costs and buy entry flex models. Honda passed 10 million flex motorcycles produced in Brazil in mid-2026, after starting with the CG 150 Titan Mix in 2009, and now offers nine flex models made in Manaus. The CG 160 alone sold more than 358,000 units from January to September 2025, according to Fenabrave data cited by Motonline. The North took 12% of national motorcycle registrations in the first half of 2026, according to Abraciclo. Makers and dealers that add flex versions of 110 cc to 160 cc models can therefore win riders in the North and Northeast, where entry motorcycles carry most of the volume.
Opening in the corn ethanol belt of Mato Grosso and Goiás
The corn ethanol belt offers a regional opening, because pump supply there now comes from mills that run all year. Mato Grosso produced 7.39 billion liters of ethanol in 2025/26, Goiás 5.33 billion and Mato Grosso do Sul 4.93 billion, according to Conab. Together the three states now out-produce São Paulo's 12.44 billion liters, and new corn plants keep adding volume close to farm towns. Short freight to Cuiabá, Goiânia and Campo Grande keeps ethanol competitive near the mills. Dealers that sell flex pickups, SUVs and motorcycles to farm households can therefore market running-cost savings with local price evidence, while assemblers can test hybrid flex trims in markets where ethanol is usually the cheaper fuel.
Electrified imports and low ethanol use weigh on demand
How do electrified imports pressure conventional flex sales?
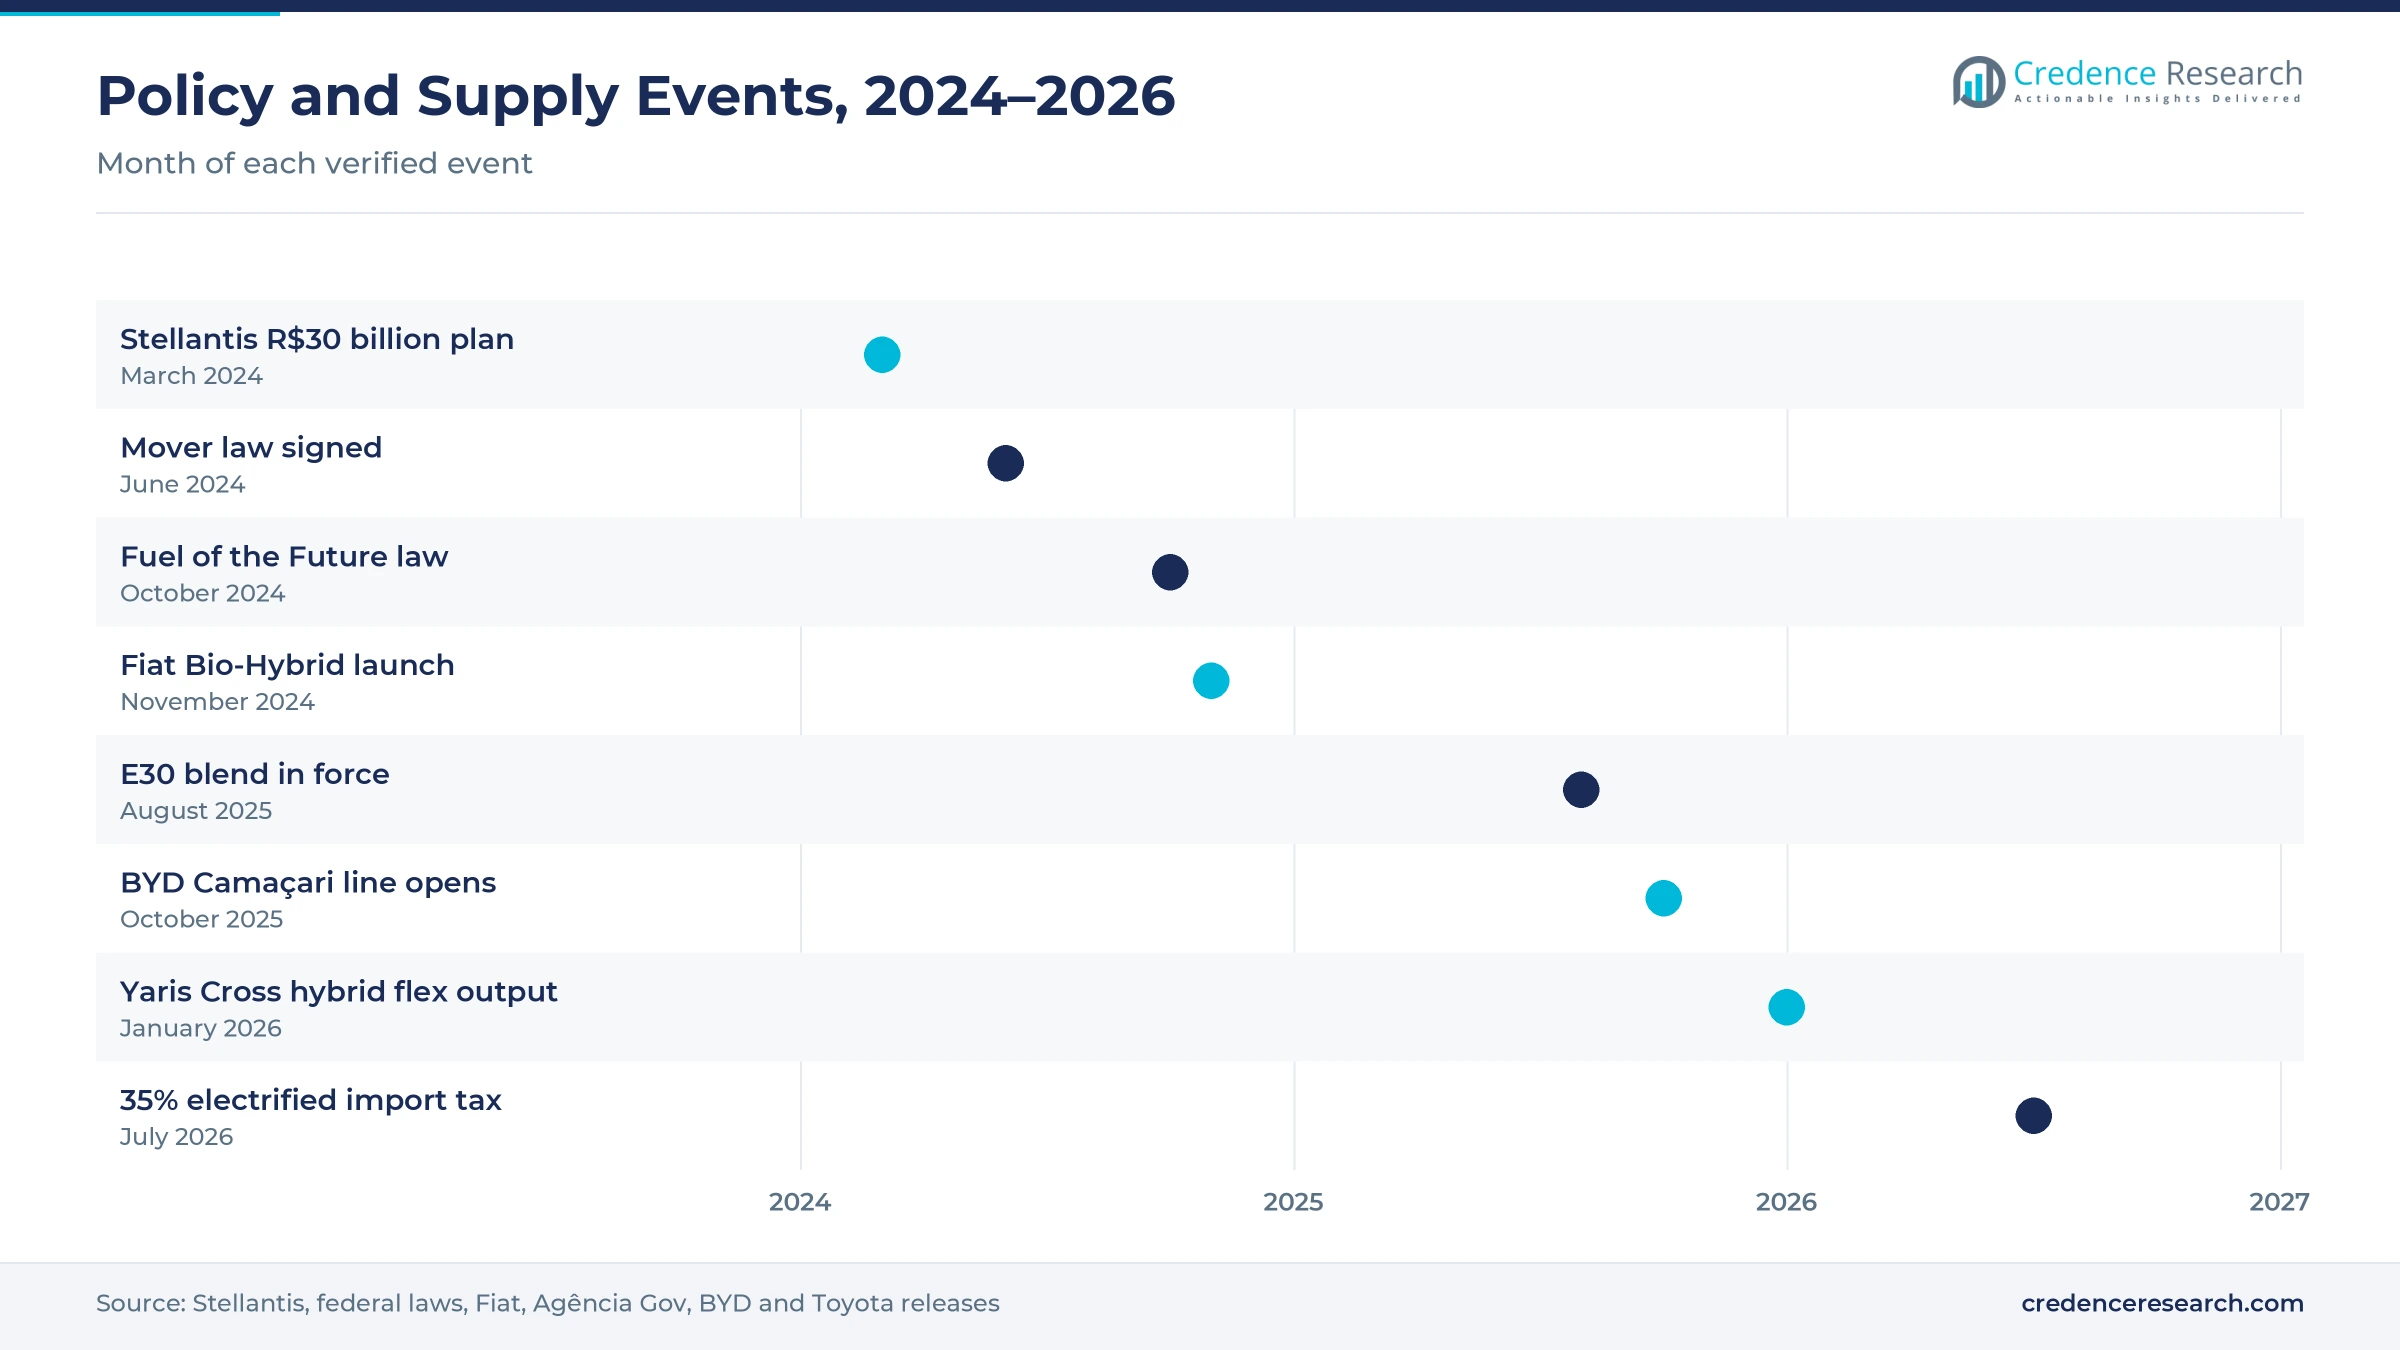
Plug-in and battery models are taking buyers from conventional flex cars in the upper price bands. Electrified vehicles reached 10.6% of 2025 registrations, up from 6.8% in 2024, with 95,236 plug-in hybrids and 81,636 battery electric vehicles, according to Anfavea data. Battery electric models remove the combustion engine entirely, so each of those sales is lost to flex engines outright. Assemblers with flex-only SUV ranges are most exposed, especially in the Southeast, which took the largest share of electric vehicle sales in 2025. Adding hybrid flex trims to these ranges is the main defense available to them.
Why does low ethanol use weaken the flex value case?
Flex owners use ethanol far less than their engines allow, which weakens the public case for the technology. Ethanol supplied about 29% of flex fleet fuel use in 2026, against 36.7% in 2019, even though it was cheaper than gasoline in about 67% of the territory, according to Datagro estimates cited by CNN Brasil. A return to 2019 levels would add about 8 billion liters of demand. Ethanol producers and policy makers are most exposed, while vehicle demand itself is affected only slowly.
Will the end of Mover benefits raise compliance costs?
The Mover tax advantage for flex and ethanol hybrids runs only until Dec. 31, 2026, under Law 14.902. By that date, manufacturers and importers must register carbon inventories for their plants and carbon footprints for the vehicles they sell. Mandatory product carbon-footprint requirements begin in 2027, and a bonus-malus method for vehicle externalities starts on Jan. 1, 2027. Smaller assemblers with conventional flex ranges face the steepest compliance costs, unless rules extend the ethanol credit.
How do harvest swings affect hydrous ethanol prices?
Sugarcane harvest results still move pump prices, which changes how often owners fill their tanks with ethanol. Sugarcane ethanol output fell 6.9% to 27.33 billion liters in 2025/26, according to Conab, and corn supply covered the gap. The national ethanol to gasoline price ratio rose to 71.41% in December 2025, above the 70% point where ethanol usually stops paying, according to ANP data compiled by the agriculture ministry. Drivers in the South and North, far from mills, are most exposed.
The Southeast leads as the Northeast gains on motorcycles
| Region | Value, 2025 (USD billion) | Share, 2025 | CAGR, 2026–2035 |
|---|---|---|---|
| Southeast | 10.18 | 48.0% | 6.6% |
| South | 3.82 | 18.0% | 6.7% |
| Northeast | 3.60 | 17.0% | 7.6% |
| Central-West | 2.33 | 11.0% | 7.2% |
| North | 1.27 | 6.0% | 7.4% |
Why does the Southeast hold the largest share?
The Southeast held a 48.0% share of 2025 value and grows at 6.6% a year. São Paulo had more than 15.4 million light vehicles in circulation at the end of 2025 and Minas Gerais nearly 6 million, of a national light fleet of 51.5 million, according to fleet data released in June 2026. The region also hosts Toyota's Sorocaba, Volkswagen's São Bernardo and Stellantis's Betim plants. However, it took 46.4% of electric vehicle sales in 2025, so electrified competition is strongest here.
What keeps the South a steady second market?
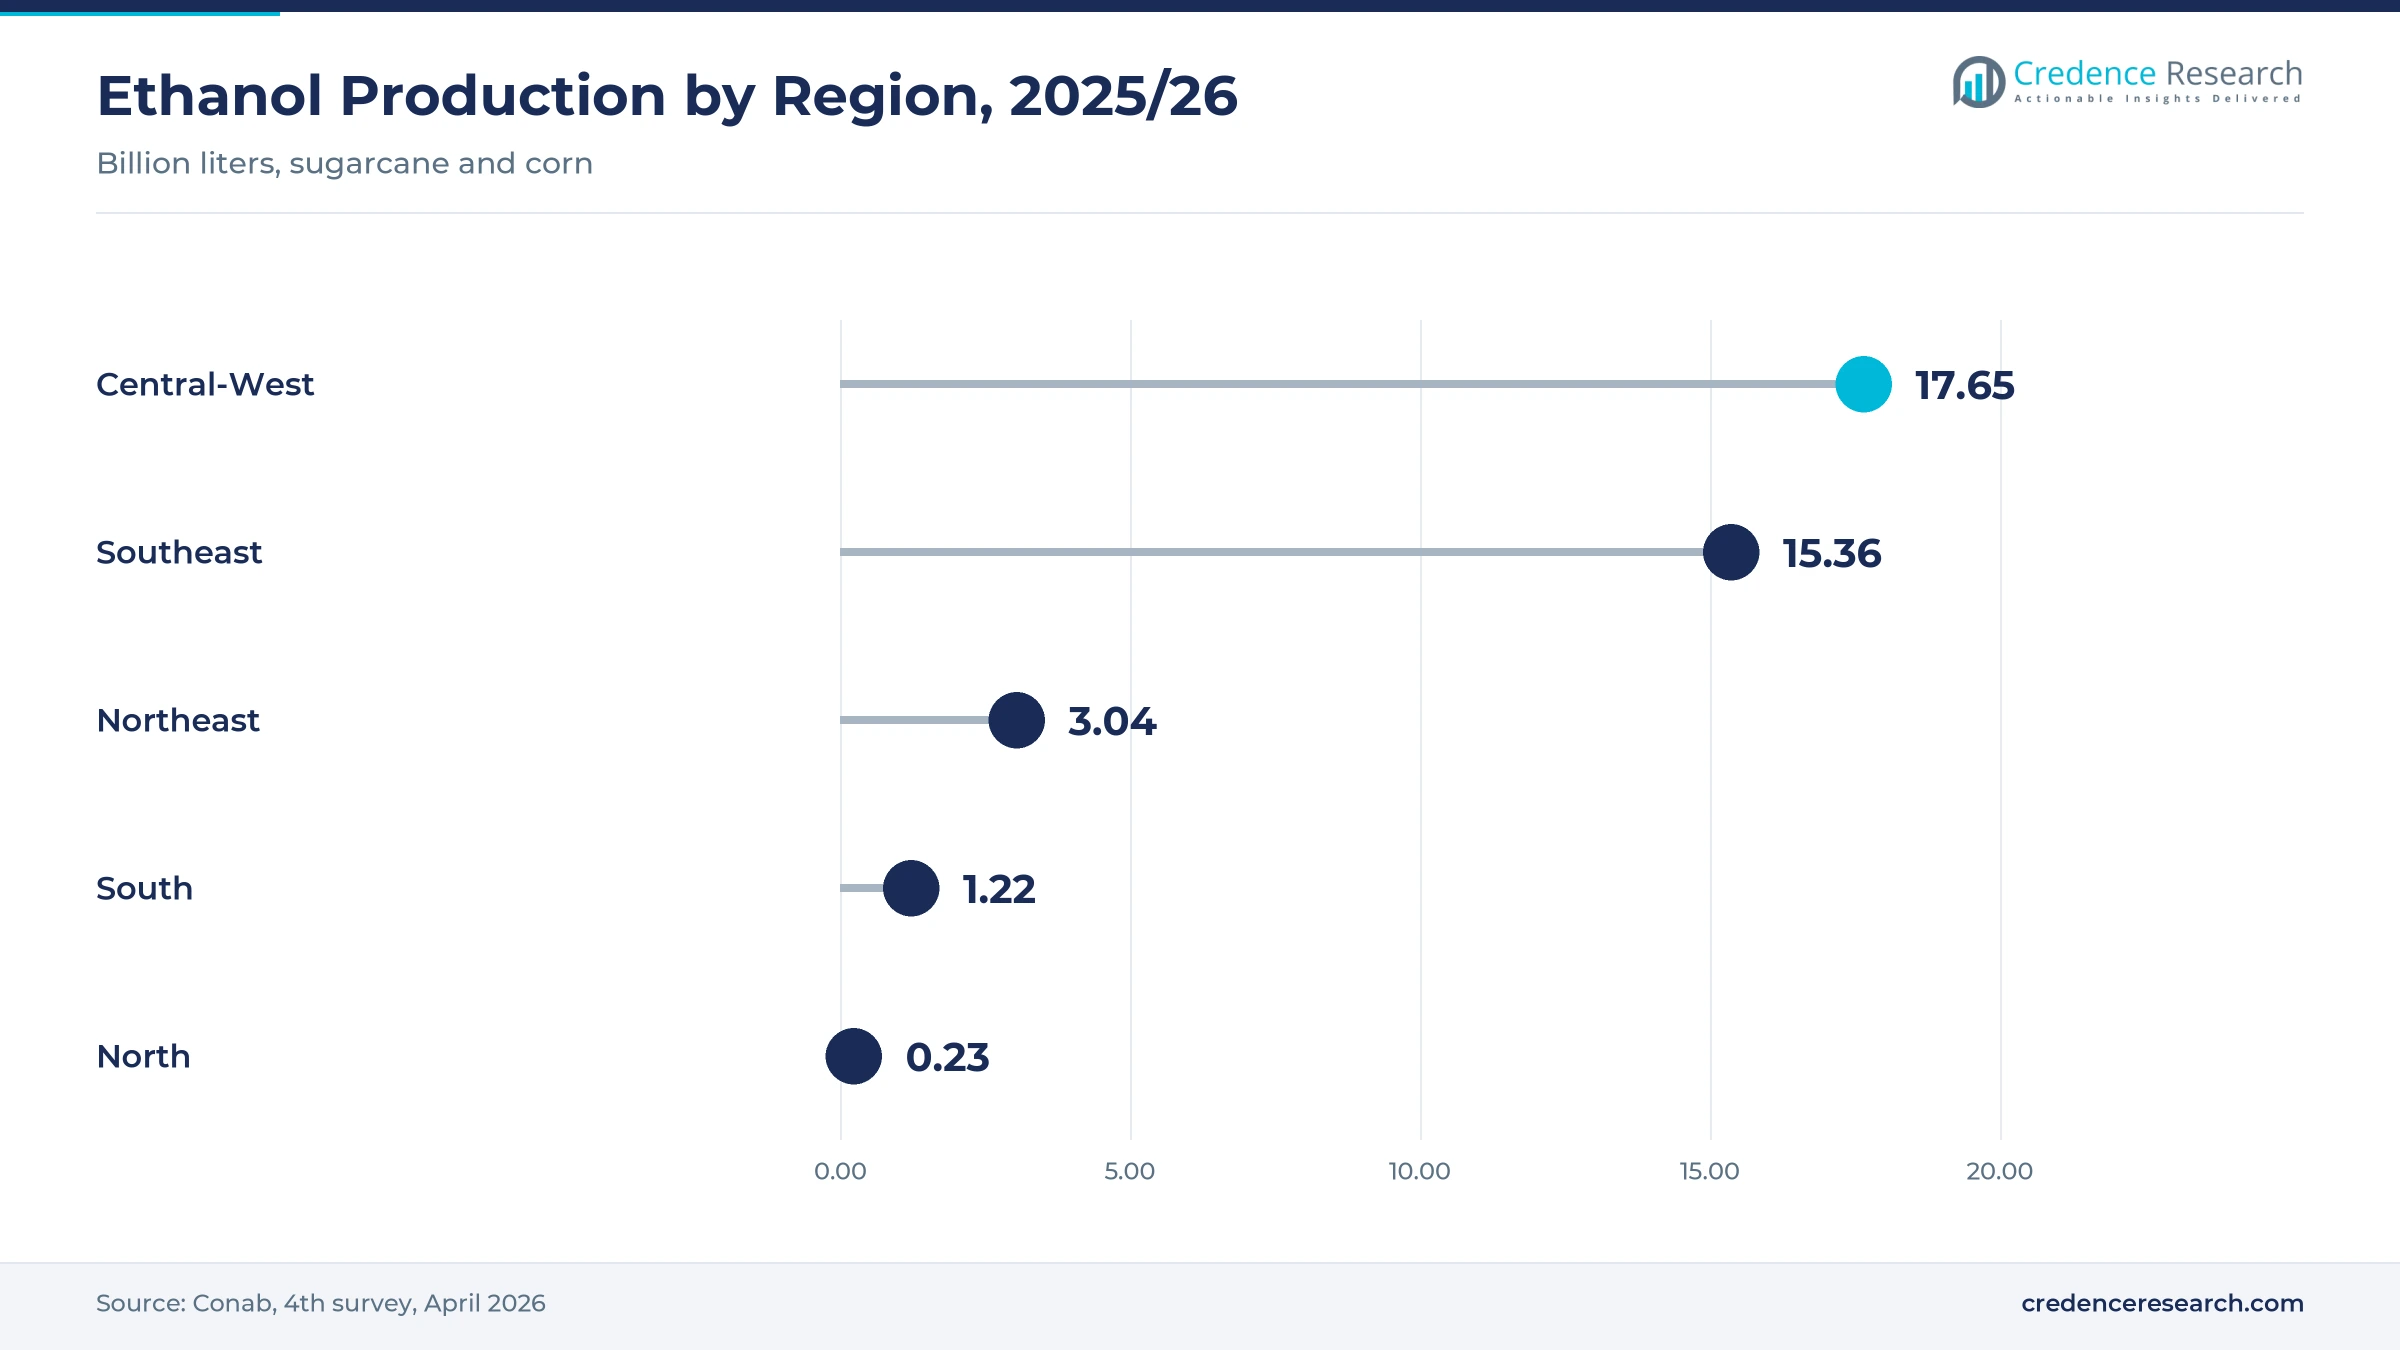
The South accounted for 18.0% of 2025 value and grows at 6.7% a year. Paraná alone had about 4.0 million light vehicles in circulation at the end of 2025, and the region took 13.2% of motorcycle registrations in the first half of 2026, according to Abraciclo. Ethanol output in the South was only 1.22 billion liters in 2025/26, according to Conab, so pump prices depend on freight from other states and ethanol is less often competitive than near the mills.
Why is the Northeast the fastest-growing region?
The Northeast held a 17.0% share of 2025 value and grows at 7.6% a year, the fastest region. It took the annual lead in motorcycle registrations for the first time in 2025 and matched the Southeast at 32.7% in the first half of 2026, according to Abraciclo data reported by Movimento Econômico. BYD's Camaçari plant in Bahia adds local assembly of plug-in flex models, and the region took 16.3% of electric vehicle sales in 2025, rising after the plant opened.
How does mill proximity shape the farm belt?
The Central-West held an 11.0% share of 2025 value and grows at 7.2% a year. The region produced 17.65 billion liters of ethanol in 2025/26, more than the Southeast's 15.36 billion, as corn mills expanded in Mato Grosso, Goiás and Mato Grosso do Sul, according to Conab. Short distances to mills keep ethanol cheap at the pump, and farm income supports demand for flex pickups and SUVs bought by producers and agribusiness fleets.
What limits flex demand in the North?
The North held a 6.0% share of 2025 value and grows at 7.4% a year. The Manaus Industrial Hub hosts almost all of the country's motorcycle factories, according to Abraciclo, yet the region produced only 0.23 billion liters of ethanol in 2025/26, according to Conab. Long river and road freight raises ethanol prices, so ethanol is rarely the cheaper fuel there, and demand rests on entry motorcycles and compact cars.
Hybrid flex launches and plant starts, 2024–2026
| Development | Status and market relevance |
|---|---|
| In November 2024, Fiat launched Pulse and Fastback Bio-Hybrid versions with a 12-volt system and a 1.0 turbo flex engine. | Launch; first Stellantis hybrid flex models built in Brazil |
| In October 2025, BYD inaugurated the final assembly line of its Camaçari plant in Bahia with 150,000 units of first-phase capacity. | Completed first phase; shows a flex plug-in hybrid engine |
| In November 2025, Toyota opened pre-sales of the Sorocaba-built Yaris Cross, with hybrid flex versions priced from R$172,390 and deliveries from February 2026. | Pre-sale launch |
| In August 2026, BYD launched the Song Pro plug-in hybrid flex built in Camaçari, with sales starting the next day. | Launch; first Brazilian-made BYD flex hybrid |
| In October 2026, Volkswagen confirmed hybrid flex production at São Bernardo do Campo from 2027 with 48-volt and full hybrid versions. | Plan; first Volkswagen hybrid flex made in Brazil |
Engine software and hybrid systems set flex performance
- Blend-sensing engine control reads exhaust oxygen data to estimate the ethanol share and adjusts injection and ignition timing in real time.
- Heated-injector cold start warms fuel at the injector so engines start on pure hydrous ethanol without a separate gasoline reservoir.
- 12-volt mild hybrid assist uses a 3 kW belt motor that replaces the alternator and starter, as in the Fiat T200 Hybrid engine.
- Plug-in flex hybrid pairs a 1.5-liter flex engine with a battery, as in the BYD DM-i 5.0 system rated at 46.06% thermal efficiency.
Need a Custom Version of This Report?
Tailor the scope, geography, or segments to your exact requirements.
- Custom geography or segment scope
- Direct access to our analyst team
Local assemblers defend flex scale against new entrants
Competition in the Brazil flexfuel market is led by long-established assemblers that build flex engines locally and by Honda in motorcycles, while Chinese entrants add plug-in flex hybrids. Stellantis builds Fiat, Jeep, Peugeot and Citroën flex models and uses Betim as the global center for Bio-Hybrid technology. Volkswagen, General Motors, Hyundai, Renault and Nissan compete in compact cars, SUVs and light pickups, and GM said in September 2024 that two light hybrid flex models were in development. Toyota leads full hybrid flex supply, with the Sorocaba-built Yaris Cross, including hybrid flex versions, delivered from February 2026. Honda dominates flex motorcycles, while Yamaha also sells flex models such as the Crosser 150. BYD entered flex supply with the Song Pro made in Camaçari. Suppliers compete on fuel economy, resale value, dealer reach in the interior and fleet contracts with rental companies.
How is the supply side organized?
Supply is concentrated among assemblers with local engine plants, because flex calibration, cold-start systems and certification must be developed for Brazilian fuel. Stellantis, Volkswagen, General Motors, Hyundai, Renault, Toyota and Nissan build or sell flex cars through local operations, while Honda and Yamaha make flex motorcycles in Manaus. Entry barriers are high, since a newcomer needs a plant to avoid the higher import tax on electrified models and to earn Mover credits. Margins sit mainly in SUVs, pickups and hybrid trims, while entry hatchbacks compete on price and fleet volume.
Companies profiled and their roles in this market
| Company | Type | Role in the market |
|---|---|---|
| Stellantis | Full-line assembler | Fiat, Jeep, Peugeot and Citroën flex cars and Bio-Hybrid models from Betim and Goiana |
| Volkswagen | Full-line assembler | Flex compact cars and SUVs, hybrid flex production planned at São Bernardo from 2027 |
| General Motors | Full-line assembler | Chevrolet flex cars and SUVs, two light hybrid flex models in development |
| Toyota | Hybrid flex specialist | Corolla, Corolla Cross and Yaris Cross with full hybrid flex powertrains from Sorocaba |
| Hyundai | Compact car assembler | Flex compact cars and SUVs, with a R$5.5 billion Brazil investment plan |
| Renault | Compact car assembler | Kwid 1.0 flex entry hatchback and other flex cars and SUVs |
| Honda | Motorcycle and car maker | FlexOne motorcycles from Manaus, more than 10 million flex units produced |
| BYD | Plug-in hybrid entrant | Song Pro plug-in hybrid flex assembled at Camaçari, Bahia, since August 2026 |
| Nissan | Compact SUV assembler | Flex compact SUVs and cars for the Brazilian market |
| Yamaha | Motorcycle maker | Crosser 150 flex and other commuter motorcycles built in Manaus |
Credence Research view on flex demand to 2035
Credence Research's view is that the Brazil flexfuel market will keep growing by value even as conventional flex volume peaks, because hybrid flex trims raise the average price of each sale. Domestic assemblers hold strong positions through local engines, Mover credits and dealer reach in the interior, while motorcycles add a steady volume base in the North and Northeast. The main uncertainty is policy after 2026, since the ethanol tax credit and the speed of battery electric imports will decide how much value shifts away from flex engines.
Registrations, list prices and ethanol data anchor values
The report uses 2025 as the base year for every value, share and growth rate. Market values come from the Credence Research model, and the 2025 value was carried forward from the earlier Credence Research estimate at its own growth rate, then checked against registrations by powertrain, list prices and the 2025 average exchange rate of about 5.59 reais per dollar. Regional shares, segment splits and growth tilts are Credence Research estimates. Sources used are Anfavea, Fenabrave, Abraciclo, ABLA, Conab, UNICA and ANP data, federal laws, company releases and trade press, and no interviews or surveys were used.
Hybrid flex models carry value growth to 2035
Spending is expected to reach USD 41.32 billion by 2035, a 6.90% CAGR during 2026–2035, as hybrid flex trims spread from mid-size SUVs to compact models and motorcycles keep adding volume. Conventional flex engines should remain the largest group through the forecast, although their share falls as hybrid versions take the upper price bands. Higher ethanol blends and record corn ethanol output should keep fuel supply stable for owners. The pace of battery electric imports and the treatment of ethanol in Mover rules after 2026 remain the main swing factors.
Electrification speed and ethanol policy set the range
The range of outcomes to 2035 depends on how fast battery electric and gasoline hybrids take share and on whether ethanol keeps its tax and blend support after 2026. Hybrid flex adoption decides the value mix, because hybrid versions sell at higher prices than conventional flex models. Motorcycle demand adds a steady volume floor in every case.
| Scenario | CAGR, 2026–2035 | Value, 2035 | What has to hold |
|---|---|---|---|
| Downside | 4.9% | USD 34.86 billion | Battery electric imports gain share fast and the Mover ethanol credit ends without replacement |
| Base | 6.90% | USD 41.32 billion | Hybrid flex trims spread across compact SUVs and blend policy stays at E30 or higher |
| Upside | 7.9% | USD 44.93 billion | Ethanol credits are extended, E35 is approved and hybrid flex reaches entry hatchbacks |
Frequently Asked Questions
How big is the Brazil flexfuel market?
What share of new vehicles in Brazil are flex-fuel?
Which region leads flex vehicle spending in Brazil?
How fast are hybrid flex models growing?
Can the Brazilian fleet absorb more ethanol?
Do other alternative fuels compete with flex vehicles in Brazil?
Which companies compete in this market?
What are the main risks for flex vehicle makers?
Table of Content
Chapter 1 Market Segmentation
- 1.1 Segmentation Framework
- 1.1.1 Product and Service Classification
- 1.1.2 Application and End-Use Classification
- 1.1.3 Technology and Solution Classification
- 1.1.4 Customer and Distribution Channel Classification
- 1.1.5 Geographic Segmentation
- 1.1.6 Market Segment Definitions and Boundaries
- 1.2 By Vehicle Type
- 1.2.1 Passenger Cars
- 1.2.2 Light Commercial Vehicles
- 1.2.3 Motorcycles
- 1.3 By Powertrain
- 1.3.1 Conventional Flex-Fuel Engines
- 1.3.2 Hybrid Flex-Fuel Powertrains
- 1.4 By Buyer
- 1.4.1 Retail Buyers
- 1.4.2 Rental and Corporate Fleets
Chapter 2 Introduction
- 2.1 Report Objectives and Scope
- 2.2 Product Definition and Industry Terminology
- 2.3 Market Inclusions and Exclusions
- 2.4 Research Process
- 2.4.1 Primary Research and Expert Interviews
- 2.4.2 Secondary Research and Source Review
- 2.4.3 Top-Down and Bottom-Up Estimation
- 2.4.4 Data Triangulation and Verification
- 2.5 Market Size Measurement Basis
- 2.5.1 2025: USD 21.20 billion → 2035: USD 41.32 billion
- 2.6 Historical and Forecast Reference Periods
- 2.6.1 Historical Period: 2018-2025
- 2.6.2 Base Year: 2025
- 2.6.3 Forecast Period: 2025-2035
- 2.7 Research Assumptions and Limitations
Chapter 3 Executive Summary
- 3.1 Market Snapshot and Key Findings
- 3.2 Base-Year Market Size, 2025
- 3.3 Forecast Market Size, 2035
- 3.4 Revenue and Volume Growth Outlook
- 3.5 Key Demand and Supply Indicators
- 3.6 Leading Market Segments
- 3.7 Fastest-Growing Market Opportunities
- 3.8 Regional Performance Highlights
- 3.9 Technology and Industry Transformation
- 3.10 Competitive Landscape Summary
- 3.11 Analyst View and Strategic Implications
Chapter 4 Brazil Flexfuel Market Trends and Developments
- 4.1 Historical Industry Development, 2018-2025
- 4.2 Recent Market Trends and Developments
- 4.3 Demand and Customer Behavior Trends
- 4.4 Technology and Product Innovation
- 4.5 Artificial Intelligence, Automation and Digitalization
- 4.6 Local Manufacturing and Supply Chain Realignment
- 4.7 Industry Partnerships, Mergers and Acquisitions
- 4.8 Sustainability and Circular Economy Developments
- 4.9 Government and Private Sector Investment Trends
- 4.10 Emerging Business Models and Commercialization
- 4.11 Industry Developments and Announcements
Chapter 5 Brazil Flexfuel Market Production, Supply and Demand Analysis
- 5.1 Demand Trend and Consumption Analysis, 2018-2025
- 5.2 Demand Forecast, 2025-2035
- 5.3 Production and Output Trend, 2018-2025
- 5.4 Production and Output Forecast, 2025-2035
- 5.5 Installed Capacity and Capacity Utilization
- 5.6 Company-Wise Production Plants and Statistics
- 5.6.1 Installed Production Capacity
- 5.6.2 Actual Production
- 5.6.3 Planned Capacity and Expansion Targets
- 5.7 Supply Chain Structure and Procurement Trends
- 5.8 Supply-Demand Gap and Bottlenecks
- 5.9 Import Dependence and Sourcing Structure
- 5.10 Contract Manufacturing and Outsourcing
- 5.11 Regional Supply and Demand Concentration
Chapter 6 Brazil Flexfuel Market Pricing Analysis
- 6.1 Pricing Structure and Measurement
- 6.2 Historical Pricing Trends, 2018-2025
- 6.3 Pricing Outlook, 2025-2035
- 6.4 Average Selling Price and Unit Economics
- 6.5 Pricing by Product and Market Segment
- 6.6 Geographic Pricing Differences
- 6.7 Key Input, Energy, Labor and Logistics Costs
- 6.8 Contract Pricing and Purchasing Models
- 6.9 Pricing Sensitivity and Competitive Positioning
- 6.10 Price, Margin and Profitability Implications
Chapter 7 Brazil Flexfuel Market Dynamics
- 7.1 Market Growth Drivers
- 7.1.1 Demand-Side Drivers
- 7.1.2 Technology and Innovation Drivers
- 7.1.3 Infrastructure and Investment Drivers
- 7.1.4 Regulatory and Policy Drivers
- 7.2 Market Restraints
- 7.2.1 Cost and Affordability Constraints
- 7.2.2 Technology and Adoption Barriers
- 7.2.3 Supply Chain and Operational Constraints
- 7.3 Market Challenges
- 7.3.1 Competitive Pressure and Margin Erosion
- 7.3.2 Skills, Infrastructure and Implementation Gaps
- 7.4 Emerging Market Opportunities
- 7.5 Market Dynamics Impact and Time-Horizon Assessment
Chapter 8 Brazil Flexfuel Value Chain Analysis
- 8.1 Industry Value Chain Overview
- 8.2 Upstream Suppliers and Critical Inputs
- 8.3 Technology and Component Providers
- 8.4 Manufacturing or Service Delivery
- 8.5 Distribution, Channel Partners and Integrators
- 8.6 Downstream Applications and End Users
- 8.7 Value Addition and Profit Pools
- 8.8 Vertical Integration and Outsourcing
- 8.9 Supplier Concentration and Risk
- 8.10 Supply Chain Localization and Resilience
Chapter 9 Brazil Flexfuel Market Regulations and Policies
- 9.1 Relevant Laws, Standards and Compliance Frameworks
- 9.2 Product, Service, Safety and Quality Requirements
- 9.3 Government Policies, Incentives and Subsidies
- 9.4 Imports, Exports and Trade Barriers
- 9.5 Public Procurement and Local Content Requirements
- 9.6 Environmental and Sustainability Compliance
- 9.7 Upcoming Policy Changes and Market Implications
Chapter 10 Brazil Flexfuel Market Hotspots and Opportunities
- 10.1 Market Opportunity Mapping and Growth Hotspots
- 10.2 High-Growth Applications and Customer Groups
- 10.3 Underserved Markets and White-Space Opportunities
- 10.4 Emerging Technology and Product Opportunities
- 10.5 New Capacity and Investment Hotspots
- 10.6 Market Entry and Expansion Opportunities
- 10.7 Distribution and Partnership Opportunities
- 10.8 Near-Term and Long-Term Commercial Potential
- 10.9 Opportunity Attractiveness and Execution Risks
Chapter 11 Brazil Flexfuel Market Outlook, 2025-2035
- 11.1 Market Size and Analysis
- 11.1.1 Revenue (Market Measurement: 2025: USD 21.20 billion → 2035: USD 41.32 billion)
- 11.1.2 Market Volume and Quantity Sold
- 11.1.3 Historical Market Size, 2018-2025
- 11.1.4 Base-Year Market Size, 2025
- 11.2 Market Forecast, 2025-2035
- 11.2.1 Revenue Forecast to 2035
- 11.2.2 Volume Forecast to 2035
- 11.2.3 CAGR and Year-on-Year Growth
- 11.2.4 Incremental Revenue Opportunity
- 11.3 Forecast Assumptions and Scenario Analysis
- 11.3.1 Base-Case Forecast
- 11.3.2 Optimistic and Conservative Scenarios
- 11.3.3 Technology, Pricing and Policy Sensitivities
- 11.4 Market Attractiveness and Growth Outlook
Chapter 12 Brazil Flexfuel Market Segmentation and Outlook
- 12.1 Segmentation Summary and Market Shares, 2025
- 12.2 Largest and Fastest-Growing Segments
- 12.3 By Vehicle Type - Market Size and Forecast, 2025-2035
- 12.3.1 Segment Definition and Scope
- 12.3.2 Historical Market Size, 2018-2025
- 12.3.3 Revenue Forecast, 2025-2035
- 12.3.4 Volume Forecast, 2025-2035
- 12.3.5 Base-Year Market Share, 2025
- 12.3.6 Segment CAGR and Growth Drivers
- 12.3.7 Subsegment Market Size and Forecast
- 12.3.7.1 Passenger Cars
- 12.3.7.2 Light Commercial Vehicles
- 12.3.7.3 Motorcycles
- 12.3.8 Subsegment Pricing and Adoption Trends
- 12.3.9 Leading Suppliers and Competition
- 12.3.10 Regional Demand and Opportunities
- 12.4 By Powertrain - Market Size and Forecast, 2025-2035
- 12.4.1 Segment Definition and Scope
- 12.4.2 Historical Market Size, 2018-2025
- 12.4.3 Revenue Forecast, 2025-2035
- 12.4.4 Volume Forecast, 2025-2035
- 12.4.5 Base-Year Market Share, 2025
- 12.4.6 Segment CAGR and Growth Drivers
- 12.4.7 Subsegment Market Size and Forecast
- 12.4.7.1 Conventional Flex-Fuel Engines
- 12.4.7.2 Hybrid Flex-Fuel Powertrains
- 12.4.8 Subsegment Pricing and Adoption Trends
- 12.4.9 Leading Suppliers and Competition
- 12.4.10 Regional Demand and Opportunities
- 12.5 By Buyer - Market Size and Forecast, 2025-2035
- 12.5.1 Segment Definition and Scope
- 12.5.2 Historical Market Size, 2018-2025
- 12.5.3 Revenue Forecast, 2025-2035
- 12.5.4 Volume Forecast, 2025-2035
- 12.5.5 Base-Year Market Share, 2025
- 12.5.6 Segment CAGR and Growth Drivers
- 12.5.7 Subsegment Market Size and Forecast
- 12.5.7.1 Retail Buyers
- 12.5.7.2 Rental and Corporate Fleets
- 12.5.8 Subsegment Pricing and Adoption Trends
- 12.5.9 Leading Suppliers and Competition
- 12.5.10 Regional Demand and Opportunities
- 12.6 Segment Growth Comparison
- 12.7 Segment Attractiveness and Priority Matrix
Chapter 13 Brazil Flexfuel Geographic Market Outlook, 2025-2035
- 13.1 Domestic Market Distribution and Demand Clusters
- 13.2 State- or Province-Wise Market Size and Forecast, 2025-2035
- 13.3 City and Metropolitan Market Outlook
- 13.4 Industrial, Manufacturing and Commercial Clusters
- 13.5 Geographic Concentration of Key End Users
- 13.6 Local Pricing and Purchasing Differences
- 13.7 Domestic Production Facilities and Capacity Map
- 13.8 Local Infrastructure and Project Pipeline
- 13.9 State-Level Policy and Incentive Differences
- 13.10 Subnational Investment Hotspots and Opportunities
- 13.11 Distribution and Logistics Networks
- 13.12 Domestic Competitive Footprint
Chapter 14 Brazil Flexfuel Technology, Innovation and Sustainability Outlook
- 14.1 Technology Landscape and Maturity
- 14.2 Product, Process and Service Innovation
- 14.3 AI, Automation and Digital Tools in the Industry
- 14.4 Technology Adoption and Performance Benchmarking
- 14.5 Innovation Pipeline and R&D Investment
- 14.6 Patent and Intellectual Property Trends
- 14.7 Energy Efficiency and Resource Management
- 14.8 Sustainability, Recycling and Circularity
- 14.9 Technology Roadmap, 2025-2035
- 14.10 Risks of Obsolescence and Technology Substitution
Chapter 15 Brazil Flexfuel Market Key Strategic Imperatives
- 15.1 Growth and Market Entry Priorities
- 15.2 High-Return Products and Segments
- 15.3 Pricing, Profitability and Cost Optimization
- 15.4 Technology Investment and Product Differentiation
- 15.5 Supply Chain Localization and Resilience
- 15.6 Distribution and Customer Acquisition
- 15.7 Partnership, Acquisition and Capacity Strategy
- 15.8 Regional Expansion Priorities
- 15.9 Short-, Medium- and Long-Term Actions
Chapter 16 Competition Outlook
- 16.1 Industry Competition Characteristics
- 16.2 Market Structure and Concentration
- 16.3 Market Share and Competitive Positioning, 2025
- 16.4 Company-Wise Revenue and Product Benchmarking
- 16.5 Production and Service Capacity Benchmarking
- 16.6 Technology, Pricing and Differentiation
- 16.7 Regional Footprint and Distribution Strength
- 16.8 Mergers, Acquisitions and Strategic Alliances
- 16.9 New Entrants and Competitive Threats
- 16.10 Porter's Five Forces and Industry Attractiveness
- 16.11 Competitive Outlook, 2025-2035
Chapter 17 Company Profiles
- 17.1 Company Coverage and Selection Criteria
- 17.2 Stellantis
- 17.2.1 Business Description
- 17.2.2 Company Ownership and Geographic Presence
- 17.2.3 Product and Service Portfolio
- 17.2.4 Manufacturing and Operating Footprint
- 17.2.5 Production Capacity and Expansion Plans
- 17.2.6 Financial Performance and Investment
- 17.2.7 Market Share and Competitive Position
- 17.2.8 Technology and Innovation Capabilities
- 17.2.9 Strategic Alliances or Partnerships
- 17.2.10 Recent Developments
- 17.2.11 Growth Strategy and Outlook
- 17.3 Volkswagen
- 17.4 General Motors
- 17.5 Toyota
- 17.6 Hyundai
- 17.7 Renault
- 17.8 Honda
- 17.9 BYD
- 17.10 Nissan
- 17.11 Yamaha
- 17.12 Other Relevant Market Participants
Note: Every listed company is profiled on the structure shown under the first company. The company list is preliminary and may change based on research findings, market developments, data availability and client requirements.
Chapter 18 Disclaimer
- 18.1 Research and Forecast Disclaimer
- 18.2 Data Source and Estimation Limitations
Note: The depth of individual sections depends on data availability for this market. Volume, capacity, trade and other unit-based metrics are included where applicable.

