
| REPORT ATTRIBUTE | DETAILS |
|---|---|
| Historical Period | 2019-2022 |
| Base Year | 2023 |
| Forecast Period | 2024-2032 |
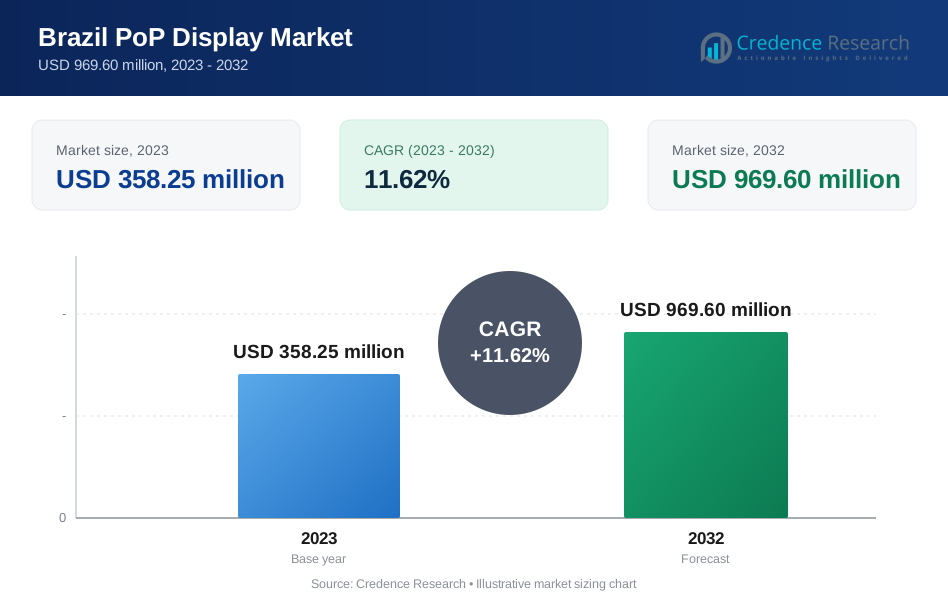
| Brazil PoP Display Market Size 2023 | USD 358.25 million |
| Brazil PoP Display Market, CAGR | 11.62% |
| Brazil PoP Display Market Size 2032 | USD 969.60 million |
Market Overview
The Brazil PoP Display Market is projected to grow from USD 358.25 million in 2023 to an estimated USD 969.60 million by 2032, with a compound annual growth rate (CAGR) of 11.62% from 2024 to 2032. This substantial growth can be attributed to the increasing demand for effective in-store advertising and branding solutions.
Market drivers for the Brazil PoP Display Market include the rising consumer preference for personalized shopping experiences and the expanding retail sector. Additionally, advancements in display technology and materials are enhancing the visual appeal and functionality of PoP displays, driving their adoption across various retail formats. The trend towards sustainability and eco-friendly materials is also influencing market growth, as companies seek to align with consumer and regulatory demands.
Geographically, the market is primarily concentrated in urban areas with a high density of retail outlets. Key players in the Brazil PoP Display Market include Smurfit Kappa Group, DS Smith Plc, and Sonoco Products Company, among others. These companies are focusing on innovative product designs and strategic partnerships to strengthen their market position. Regional market dynamics, such as economic stability and consumer spending patterns, play a crucial role in shaping the growth and competitive landscape of the PoP display market in Brazil.
Market Drivers
Growing Retail Sector and Consumer Spending
The burgeoning retail sector in Brazil is a primary driver of the PoP display market. According to the Brazilian Institute of Geography and Statistics (IBGE), retail sales in Brazil have shown consistent growth, with May 2024 marking the fifth consecutive month of positive results. For instance, the food segment, which accounts for more than half of retail sales, saw an increase in purchases of food and beverages in supermarkets and grocery stores. The National Confederation of Commerce (CNC) has revised its 2024 sector revenue growth projections upward, indicating a more optimistic outlook for the retail industry. This growth is supported by factors such as increased credit granting to individuals and a rise in the wage bill. The expansion of modern retail formats like supermarkets and hypermarkets has bolstered the demand for PoP displays. Retailers are investing in sophisticated PoP displays to attract consumers, enhance in-store experiences, and differentiate themselves from competitors. The integration of digital technologies within PoP displays, such as interactive screens and digital signage, is becoming more prevalent, making shopping experiences more engaging and informative.
Technological Advancements in PoP Displays
Technological innovation is significantly driving the growth of the Brazil PoP display market. The retail sector in Brazil has been embracing digital transformation, as evidenced by the growth in e-commerce sales. According to industry reports, Brazil's retail e-commerce market is projected to be the largest in Latin America, with substantial sales expected in 2024. This digital shift is also influencing in-store displays, with retailers integrating digital elements into traditional PoP setups. For instance, some major retailers in Brazil have been experimenting with augmented reality (AR) features in their stores, allowing customers to virtually try products before purchase. The use of digital displays and interactive kiosks is becoming more common, enabling retailers to provide real-time information and run interactive promotions. These technological advancements are not limited to large retailers; even smaller businesses are adopting digital solutions to enhance their in-store marketing efforts. The ability to quickly update digital content allows for more agile marketing strategies, ensuring that promotional messages remain relevant and impactful in the fast-paced retail environment.
Increasing Focus on Brand Differentiation and In-Store Experience
Brand differentiation and enhanced in-store experiences are driving demand for innovative PoP displays in Brazil. A survey conducted by a leading market research firm revealed that Brazilian consumers increasingly value unique and engaging shopping experiences. For example, in the cosmetics sector, which has seen significant growth in Brazil, brands are using interactive PoP displays to allow customers to virtually try on makeup products. In the food and beverage industry, some companies have implemented sensory marketing techniques through their PoP displays, engaging customers' senses of smell and taste to create memorable experiences. The pharmaceutical sector, which has shown strong growth in retail sales according to IBGE data, is also leveraging PoP displays to educate consumers about products and health-related information. Major retailers in Brazil are investing in store redesigns that incorporate more engaging and interactive PoP displays. These displays not only serve to highlight products but also to create immersive brand experiences. The focus on customer experience is driving retailers to invest in PoP display solutions that can effectively engage and delight their customers, fostering brand loyalty and repeat business in an increasingly competitive market.
Sustainability and Eco-Friendly Practices
The growing emphasis on sustainability and eco-friendly practices is a crucial driver in the Brazil PoP display market. Consumers and businesses alike are increasingly aware of the environmental impact of their actions and are seeking more sustainable options. This trend is reflected in the demand for PoP displays made from recyclable, biodegradable, and renewable materials. Brands and retailers are adopting eco-friendly displays as part of their broader sustainability initiatives, aiming to reduce waste and carbon footprints. Regulatory pressures and corporate social responsibility (CSR) commitments are also influencing the shift towards sustainable PoP displays. Companies are striving to meet stringent environmental regulations and enhance their corporate image by demonstrating a commitment to sustainability. This has led to the development and adoption of innovative materials and production processes that minimize environmental impact. Additionally, sustainable PoP displays often resonate well with consumers, who are increasingly making purchasing decisions based on a company’s environmental practices. By aligning their display strategies with sustainability goals, businesses can enhance their brand reputation, attract eco-conscious consumers, and contribute to long-term market growth.
Market Trends
Integration of Digital and Interactive Technologies
One of the most significant trends in the Brazil PoP display market is the integration of digital and interactive technologies. Retailers and brands are increasingly incorporating digital elements such as LED screens, interactive kiosks, and augmented reality (AR) features into traditional PoP displays. This trend is driven by the need to engage tech-savvy consumers who expect dynamic and immersive shopping experiences. For instance, a survey conducted by the Brazilian Association of Digital Marketing (ABRADi) found that digital signage in retail environments increased customer engagement by up to 30% compared to traditional static displays. Digital PoP displays offer numerous advantages, including the ability to display real-time content updates, run interactive promotions, and gather valuable consumer data through engagement tracking. The adoption of these technologies enhances the overall shopping experience, making it more engaging and personalized. A study by the Brazilian Institute of Retail and Consumer Market (IBEVAR) revealed that stores implementing interactive PoP displays saw an average increase in sales of 15% for featured products. As technology continues to evolve, the capabilities and applications of digital and interactive PoP displays will expand, offering even greater value to retailers and brands seeking to differentiate themselves in a competitive market.
Sustainability and Eco-Friendly Design
Sustainability is becoming a crucial consideration in the Brazil PoP display market, reflecting a broader global shift towards eco-friendly practices. Brands and retailers are increasingly opting for PoP displays made from sustainable materials such as recycled cardboard, biodegradable plastics, and other renewable resources. This trend is driven by growing consumer awareness of environmental issues and the desire to reduce carbon footprints. For instance, a survey conducted by the Brazilian Association of Packaging (ABRE) found that 68% of Brazilian consumers prefer products with eco-friendly packaging and displays. Eco-friendly PoP displays not only align with corporate social responsibility (CSR) goals but also resonate with environmentally conscious consumers who prefer to support brands with sustainable practices. The Brazilian Ministry of Environment reported that companies implementing sustainable practices, including eco-friendly displays, saw an average increase of 22% in brand loyalty among consumers. In addition to material choices, sustainable design practices are also gaining traction. This includes designing displays that are modular and reusable, thereby reducing waste and promoting longer lifecycles. A study by the National Confederation of Industry (CNI) revealed that Brazilian companies adopting circular economy principles in their display production reduced waste by an average of 35%. By embracing sustainability, brands can enhance their corporate image, comply with environmental regulations, and attract a growing segment of eco-conscious consumers, thereby driving long-term growth in the PoP display market.
Market Restraints and Challenges
High Costs of Advanced Technologies
One of the primary restraints in the Brazil PoP display market is the high cost associated with advanced technologies. While digital and interactive PoP displays offer numerous benefits, they come with significant initial investment and maintenance costs. Small and medium-sized retailers may find it challenging to allocate sufficient budget for these high-tech solutions, limiting their adoption primarily to larger, well-established businesses. For instance, a survey conducted by the Brazilian Association of Retail and Consumer Goods (ABRAS) found that a substantial number of small retailers cited cost as the main barrier to adopting digital PoP displays. The financial barrier is compounded by the need for continuous updates and technical support to ensure the optimal performance of these digital displays. A study by the Brazilian Institute of Geography and Statistics (IBGE) revealed that a significant portion of retail businesses in Brazil operate on tight profit margins, making it difficult to justify large investments in advanced PoP technologies. As a result, many retailers may hesitate to invest in such technologies, preferring traditional, lower-cost PoP display options.
Logistical and Supply Chain Challenges
Logistical and supply chain challenges pose significant obstacles to the growth of the PoP display market in Brazil. The country's vast geography and varying levels of infrastructure development create complexities in the distribution and installation of PoP displays. For instance, a report by the National Confederation of Industry (CNI) highlighted that transportation costs in Brazil are considerably higher than in many other countries, impacting the overall cost of PoP display deployment. Furthermore, a survey conducted by the Brazilian Association of POP Material Manufacturers (ABEPRO) found that a notable number of companies in the sector face difficulties in timely delivery of displays to remote regions. Supply chain disruptions, such as delays in the availability of raw materials or finished products, can further hinder market growth. A study by the Federation of Industries of the State of São Paulo (FIESP) revealed that many Brazilian manufacturers in the display industry experienced supply chain disruptions in recent years, affecting their ability to meet market demand. These challenges underscore the need for robust logistical planning and investment in infrastructure to support the growing PoP display market in Brazil.
Market Segmentation Analysis
By Type
Floor displays are the most common PoP displays in large retail spaces, effectively attracting consumer attention with their visibility and capacity to hold significant merchandise. For instance, a survey conducted by the Brazilian Retail Association found that floor displays increased product visibility by a substantial margin compared to standard shelf placements. Countertop displays, placed near checkout areas, are ideal for smaller, impulse-buy items and crucial for last-minute purchase decisions. A study by a major Brazilian supermarket chain revealed that countertop displays boosted impulse purchases significantly. Pallet displays, used primarily in large stores and warehouses, are designed for bulk products, placed in high-traffic areas, facilitating easy restocking, and supporting heavy items. Sidekick displays, attached to shelving units, promote complementary products efficiently and boost cross-selling. Other innovative display types, such as spinner displays, allow consumers to browse products from different angles, while retail signage provides essential information and promotes brand messaging. According to a report by the Brazilian POP Display Manufacturers Association, the adoption of interactive and digital displays has grown rapidly in recent years, particularly in urban centers.
By Application
The Brazil PoP display market serves several key segments, each with unique demands and characteristics. The Food & Beverage segment is driven by constant demand and frequent product launches, with displays designed to enhance brand visibility and drive impulse purchases. For instance, a survey by ABRAS (Brazilian Supermarket Association) found that well-designed PoP displays in the food and beverage sector led to a notable increase in unplanned purchases. Pharmaceuticals use PoP displays to promote over-the-counter medications, vitamins, and health supplements, focusing on detailed product information and accessibility. A study conducted by the Brazilian Pharmacy Association revealed that informative PoP displays in pharmacies improved customer engagement and product understanding. The Cosmetics & Personal Care segment benefits from visually appealing and interactive displays that attract consumers to try new products and brands. According to a report by ABIHPEC (Brazilian Association of the Cosmetic, Toiletry and Fragrance Industry), interactive PoP displays in this sector have shown to significantly influence purchasing decisions. Electronics displays often incorporate security features and interactive elements, allowing consumers to experience products firsthand before purchasing. Additionally, PoP displays are tailored for a wide range of other applications, from household goods to toys, each customized to specific product characteristics and consumer behaviors.
Segments
Based on Type
- Floor Displays
- Countertop Displays
- Pallet Displays
- Sidekick Displays
- Others (Spinner Displays, Retail Signage, etc.)
Based on Application
- Food & Beverage
- Pharmaceuticals
- Cosmetics & Personal Care
- Electronics
- Others
Based on Style
- Temporary PoP Displays
- Permanent PoP Displays
Based on Material
- Corrugated Board
- Plastic
- Metal
- Wood
- Others
Based on Region
- North
- Northeast
- Central-West
- Southeast
- South
Regional Analysis
South Region (20%)
The South region, including states such as Paraná, Santa Catarina, and Rio Grande do Sul, holds a market share of around 20%. This region is known for its well-developed retail sector and a strong emphasis on industrial and agricultural products. According to a recent retail survey conducted by the Brazilian Institute of Geography and Statistics (IBGE), the South region has shown consistent growth in retail sales over the past few years. For instance, in May 2024, retail sales in the region rose by a notable margin compared to the previous month, driven by increased consumer spending and economic recovery. The retail environment in the South is marked by a blend of traditional and modern retail formats, with a growing preference for sustainable and eco-friendly PoP displays. A study by the National Confederation of Commerce (CNC) found that retailers in the South region are increasingly investing in innovative display solutions to enhance the in-store experience. The region's focus on creating visually appealing and durable displays has contributed to higher consumer engagement and sales conversions in various retail segments.
Northeast Region (15%)
The Northeast region, with key cities like Salvador, Recife, and Fortaleza, accounts for approximately 15% of the market share. This region is experiencing rapid urbanization and economic development, leading to an expanding retail sector. According to data from the Brazilian Association of Supermarkets (ABRAS), the Northeast has seen a significant increase in the number of retail outlets over the past decade. For instance, the number of supermarkets in the region grew by a considerable amount between 2020 and 2024, indicating a rising demand for retail infrastructure and display solutions. The Brazilian Institute of Geography and Statistics (IBGE) reported that retail sales in the Northeast have been consistently growing, with several months in 2024 showing positive year-over-year growth. This trend is driving the demand for PoP displays in the region. A survey conducted by a leading market research firm revealed that retailers in the Northeast are gradually adopting modern PoP display solutions to cater to evolving consumer preferences and the competitive market landscape.
Key players
- Papeteries de Genval
- Smurfit Kappa
- International Paper Company
- WestRock Company
- Groupe Charles André
- Tetra Pak
- Indústria de Papel e Papelão S.A. (IPPSA)
- Pratt Industries Inc.
- Felbro, Inc.
Competitive Analysis
The Brazil PoP display market is characterized by intense competition among key players such as Papeteries de Genval, Smurfit Kappa, and International Paper Company. These companies leverage their extensive experience and global reach to offer innovative and high-quality PoP display solutions. Smurfit Kappa and International Paper Company, in particular, are recognized for their sustainability initiatives and advanced manufacturing technologies, which appeal to environmentally conscious retailers. WestRock Company and Tetra Pak are also prominent players, known for their strong focus on customer-centric solutions and strategic partnerships that enhance market penetration. Local companies like Indústria de Papel e Papelão S.A. (IPPSA) and Felbro, Inc. provide tailored solutions that cater to specific regional needs, ensuring competitive pricing and customized service. Overall, the market is driven by innovation, sustainability, and the ability to meet diverse customer demands, with each player striving to strengthen their market position through continuous improvement and strategic alliances.
Recent Developments
- In July 2024, Equilis Belgium announced the sale of phases 2 and 3 of the shops of the Papeteries de Genval to e-maprod. This transaction included 13 retail spaces totaling 4,350m² of retail space.
- In June 2024, Smurfit Kappa acquired Artemis Ltd., a Bag-in-Box packaging plant located in Shumen, Bulgaria. This acquisition aims to expand Smurfit Kappa's presence and customer base in Eastern Europe.
- In June 2024, Smurfit Kappa invested over €30 million in Spain to further reduce CO2 emissions.
- In July 2024, Smurfit Westrock (formed from the merger of Smurfit Kappa and WestRock) made its debut on the New York and London stock exchanges.
Market Concentration and Characteristics
The Brazil PoP display market exhibits a moderate to high level of market concentration, dominated by a mix of global giants and strong local players. Key characteristics of this market include a focus on innovation, with companies investing heavily in advanced manufacturing technologies and sustainable materials to meet evolving consumer and regulatory demands. The market is highly competitive, with leading firms like Smurfit Kappa, International Paper Company, and WestRock Company driving significant market shares through extensive product portfolios and strategic partnerships. Local companies, such as Indústria de Papel e Papelão S.A. (IPPSA), contribute to the market's diversity by offering customized solutions that cater to regional preferences and cost structures. The emphasis on eco-friendly practices and digital integration further shapes the market dynamics, making it imperative for companies to continuously innovate to maintain their competitive edge.
Report Coverage
The research report offers an in-depth analysis based on Type, Application, Style, Material and Region. It details leading market players, providing an overview of their business, product offerings, investments, revenue streams, and key applications. Additionally, the report includes insights into the competitive environment, SWOT analysis, current market trends, as well as the primary drivers and constraints. Furthermore, it discusses various factors that have driven market expansion in recent years. The report also explores market dynamics, regulatory scenarios, and technological advancements that are shaping the industry. It assesses the impact of external factors and global economic changes on market growth. Lastly, it provides strategic recommendations for new entrants and established companies to navigate the complexities of the market.
Future Outlook
- The Brazil PoP display market is expected to witness sustained growth, driven by increasing retail investments and consumer demand for engaging in-store experiences.
- The integration of advanced digital technologies, including interactive screens and augmented reality, will become more prevalent, enhancing consumer engagement and data collection.
- An increasing focus on sustainability will drive the adoption of eco-friendly materials in PoP displays, aligning with global environmental standards and consumer preferences.
- Retailers will increasingly demand customized and personalized PoP displays to better cater to specific consumer segments and enhance brand differentiation.
- Despite the growth of e-commerce, brick-and-mortar stores will invest in PoP displays to create unique shopping experiences that cannot be replicated online.
- Urbanization and the development of new retail spaces in metropolitan areas will fuel demand for innovative PoP display solutions.
- The expansion of local manufacturing capabilities will reduce dependence on imports, lower costs, and enable quicker turnaround times for PoP display production.
- Smart PoP displays equipped with sensors and IoT capabilities will gain traction, providing real-time analytics and enhancing inventory management.
- The market will see a shift towards more consumer-centric designs, focusing on ease of use, accessibility, and interactive features to improve the shopping experience.
- Companies will increasingly form strategic collaborations and partnerships to leverage combined expertise and resources, driving innovation and market penetration.
Request a Free Sample
Fill in your details and we'll send you a free sample report.
- Sample data tables & charts
- Research methodology
Need a Custom Version of This Report?
Tailor the scope, geography, or segments to your exact requirements.
- Custom geography or segment scope
- Direct access to our analyst team
Frequently Asked Questions
What is the projected growth of the Brazil PoP Display Market?
What are the main drivers of the Brazil PoP Display Market?
Which regions in Brazil have the highest market concentration for PoP displays?
Who are the key players in the Brazil PoP Display Market?
What trends are influencing the Brazil PoP Display Market?
Table of Content
Chapter 1. Report Introduction
- 1.1 Report Description & Purpose
- 1.1.1 Report Title & Market Definition
- 1.1.2 Unique Selling Propositions (USP) & Key Differentiators
- 1.1.3 Value Proposition for Stakeholders
- 1.2 Research Objectives
- 1.2.1 Market Sizing Objectives (Volume & Revenue)
- 1.2.2 Segmentation Objectives
- 1.2.3 Competitive Intelligence Objectives
- 1.2.4 Forecast & Scenario Objectives
- 1.3 Report Scope
- 1.3.1 Brazil PoP Display Scope – Types & Subtypes Covered
- 1.3.2 Geographic Scope – Regions & Countries Covered
- 1.3.3 Historical Period, Base Year & Forecast Period (2023; forecast to 2032)
- 1.3.4 Inclusions & Exclusions
- 1.4 HS Code & Classification Framework
- 1.5 Currency, Units & Pricing Basis
- 1.6 Target Stakeholders
- 1.7 Limitations & Assumptions
Chapter 2. Executive Summary
- 2.1 Global Brazil PoP Display Market Snapshot
- 2.1.1 Market Size – Historical (2023) & Forecast (2023-2032) (2023: USD 358.25 million → 2032: USD 969.60 million)
- 2.1.2 Volume & Revenue – Global Totals
- 2.1.3 Key Market Highlights – Top Five Facts
- 2.2 Brazil PoP Display Market Segmentation Snapshot
- 2.2.1 Market Split by Region – 2023 vs. 2032
- 2.3 Competitive Snapshot
- 2.3.1 Top 10 Players by Revenue Share – 2023
- 2.3.2 Top 10 Players by Volume Share – 2023
- 2.3.3 Recent Strategic Developments (18-Month Summary)
- 2.4 Key Investment Highlights & Strategic Conclusions
Chapter 3. Brazil PoP Display Market Dynamics & Industry Analysis
- 3.1 Market Overview & Context
- 3.1.1 Brazil PoP Display Market Position in the Broader Automotive Value Chain
- 3.1.2 OEM vs. Replacement Market Dynamics
- 3.1.3 Market Maturity & Development Stage by Region
- 3.2 Brazil PoP Display Market Drivers
- 3.3 Brazil PoP Display Market Restraints & Challenges
- 3.4 Brazil PoP Display Market Opportunities
- 3.5 Porter's Five Forces Analysis
- 3.5.1 Threat of New Entrants
- 3.5.2 Bargaining Power of Suppliers
- 3.5.3 Bargaining Power of Buyers
- 3.5.4 Threat of Substitutes
- 3.5.5 Competitive Rivalry – Intensity Assessment
- 3.6 Brazil PoP Display Value Chain Analysis
- 3.6.1 Upstream – Raw Material/Input Suppliers
- 3.6.1.1 Raw Material/Input 1
- 3.6.1.2 Raw Material/Input 2
- 3.6.1.3 Raw Material/Input 3
- 3.6.2 Midstream – Production/Manufacturing/Service Delivery
- 3.6.2.1 Production/Process Overview
- 3.6.2.2 Key Facility Locations & Capacity by Manufacturer
- 3.6.3 Downstream – Distribution & End Consumer
- 3.6.3.1 Primary Channel – B2B/OEM
- 3.6.3.2 Secondary Channels – Dealer, Retail, Online, Direct
- 3.6.4 Value Chain Profitability Analysis
- 3.6.1 Upstream – Raw Material/Input Suppliers
- 3.7 PESTEL Analysis
- 3.7.1 Political Factors
- 3.7.2 Economic Factors
- 3.7.3 Social Factors
- 3.7.4 Technological Factors
- 3.7.5 Environmental Factors
- 3.7.6 Legal Factors
- 3.8 Brazil PoP Display Supply Chain Analysis
- 3.8.1 Raw Material/Input Supply Risk Assessment
- 3.8.2 Manufacturing Concentration Risk (Geographic Exposure)
- 3.8.3 Trade Disruption Impact Analysis
- 3.9 Regulatory & Policy Landscape
Note: The regulatory and policy landscape section covers regulations based on their applicability to the market, Brazil PoP Display category, geography, and scope of the study. Only regulatory frameworks with a material impact on operations, compliance, trade, sustainability, or market access are analyzed in detail.
Chapter 4. Key Investment Pockets & Opportunity Analysis
- 4.1 Brazil PoP Display Market Attractiveness Analysis
- 4.1.1 By Region – Investment Attractiveness Matrix (Volume × CAGR)
- 4.2 Absolute Revenue Growth Opportunity
- 4.2.1 By Region – Absolute USD Growth Through 2032
- 4.3 Incremental Volume Opportunity
- 4.3.1 By Region – Incremental Volume Through 2032
- 4.3.2 Segment – Incremental Volume
- 4.4 Emerging Submarket Opportunity Deep Dive (Subject to Applicability)
- 4.5 Emerging Market Opportunity Scorecards
- 4.5.1 United States
- 4.5.2 Europe
- 4.5.3 Asia
- 4.5.4 Middle East & Africa
Note: Emerging Market Opportunity Scorecards will be included based on relevance and strategic importance. Regions listed are indicative and may vary depending on data availability and market dynamics.
Chapter 5. Brazil PoP Display Import-Export Analysis & Trade Flows
- 5.1 Global Trade Overview
- 5.1.1 Global Export Value by Country (2023)
- 5.1.2 Global Export Volume by Country (2023)
- 5.1.3 Global Import Value by Country (2023)
- 5.1.4 Global Import Volume by Country (2023)
- 5.1.5 Net Trade Balance by Country (2023)
- 5.2 Export Analysis – Segment
- 5.2.1 Type 1 (HS Code)
- 5.2.2 Type 2 (HS Code)
- 5.2.3 Type 3 (HS Code)
- 5.2.4 Type 4 (HS Code)
- 5.2.5 Type 5 (HS Code)
- 5.3 Import Analysis – Segment
- 5.3.1 Type 1 (HS Code)
- 5.3.2 Type 2 (HS Code)
- 5.3.3 Type 3 (HS Code)
- 5.3.4 Type 4 (HS Code)
- 5.3.5 Type 5 (HS Code)
- 5.4 Average Unit Trade Prices
- 5.4.1 Average Export Price – Segment & Country
- 5.4.2 Average Import Price – Segment & Source Country
- 5.4.3 Price Trends (2023)
- 5.5 Key Trade Route Analysis
- 5.5.1 Trade Route 1
- 5.5.2 Trade Route 2
- 5.5.3 Trade Route 3
- 5.5.4 Trade Route 4
- 5.5.5 Trade Route 5
- 5.6 Trade Policy Impact Assessment
- 5.6.1 US Anti-Dumping & Section 301 Tariffs
- 5.6.2 EU Customs Union Impact
- 5.6.3 Major Free Trade Agreements
- 5.6.4 USMCA Rules of Origin
Note: Trade policy analysis will be included only where relevant to the Brazil PoP Display market.
Chapter 6. Competitive Landscape & Company Benchmarking
- 6.1 Brazil PoP Display Market Concentration & Structure
- 6.1.1 Herfindahl-Hirschman Index (HHI) – vs. 2023
- 6.1.2 Tier 1, Tier 2 & Tier 3 Market Structure
- 6.1.3 Global, Regional & Local Player Dynamics
- 6.2 Brazil PoP Display Market Share Analysis – 2023
- 6.2.1 Global Revenue Share by Company
- 6.2.2 Global Volume Share by Company
- 6.2.3 Regional Revenue Share
- 6.2.4 Market Share Evolution ( vs. 2023)
- 6.2.5 OEM Segment Share by Company
- 6.2.6 Replacement Segment Share by Company
- 6.3 Production/Delivery Capacity & Facility Analysis
- 6.3.1 Global Installed Capacity
- 6.3.2 Capacity Utilization Rates
- 6.3.3 Production/Output Volume
- 6.3.4 Facility Locations & Capacity Map
- 6.3.5 Planned Capacity Additions
- 6.4 Brazil PoP Display Competitive Benchmarking Matrix
- 6.4.1 Revenue, Volume, CAGR & Profitability Comparison
- 6.4.2 Channel Revenue Mix
- 6.4.3 Geographic Revenue Exposure
- 6.4.4 R&D Intensity
- 6.4.5 Sustainability Maturity
- 6.5 Strategic Developments in Brazil PoP Display (Last 24 Months)
- 6.5.1 Mergers, Acquisitions & Divestments
- 6.5.2 New Brazil PoP Display Launches
- 6.5.3 Facility Expansions
- 6.5.4 Strategic Alliances, Joint Ventures & Partnerships
- 6.5.5 Distribution Expansion & Market Entry
- 6.5.6 Sustainability & ESG Initiatives
- 6.6 Competitive Strategy Mapping
- 6.6.1 Leader, Challenger, Follower & Niche Classification
- 6.6.2 Pricing Strategy Comparison
- 6.6.3 Channel Strategy Matrix
Note: Strategic developments are included based on their materiality and the availability of reliable information.
Chapter 7. Global Brazil PoP Display Market – By Distribution Channel
- 7.1 Segment Overview
- 7.1.1 Volume & Revenue Split by Channel (2023 & 2032)
- 7.1.2 Channel Mix Evolution (2023-2032)
Chapter 8. Regional Market Analysis – Global Overview
- 8.1 Global Regional Overview
- 8.1.1 Regional Volume Share
- 8.1.2 Regional Revenue Share
- 8.1.3 Regional Volume by Region
- 8.1.4 Regional Revenue by Region
- 8.1.5 Regional Forecast Through 2032
- 8.2 Cross-Regional Segment Analysis
- 8.2.1 By Distribution Channel
- 8.2.2 By Brand/Price Tier
Chapter 9. North America Brazil PoP Display Market
- 9.1 United States
- 9.2 Canada
- 9.3 Mexico
Chapter 10. Europe Brazil PoP Display Market
- 10.1 Germany
- 10.2 France
- 10.3 Italy
- 10.4 United Kingdom
- 10.5 Spain
- 10.6 Poland
- 10.7 Russia
- 10.8 Netherlands
- 10.9 Belgium
- 10.10 Sweden
- 10.11 Denmark
- 10.12 Norway
- 10.13 Rest of Europe
Chapter 11. Asia Pacific Brazil PoP Display Market
- 11.1 China
- 11.2 India
- 11.3 Japan
- 11.4 South Korea
- 11.5 Thailand
- 11.6 Indonesia
- 11.7 Vietnam
- 11.8 Malaysia
- 11.9 Australia
- 11.10 Rest of Asia Pacific
Chapter 12. Latin America Brazil PoP Display Market
- 12.1 Brazil
- 12.2 Argentina
- 12.3 Colombia
- 12.4 Chile
- 12.5 Rest of Latin America
Chapter 13. Middle East Brazil PoP Display Market
- 13.1 Saudi Arabia
- 13.2 United Arab Emirates
- 13.3 Turkey
- 13.4 Israel
- 13.5 Iran
- 13.6 Rest of the Middle East
Chapter 14. Africa Brazil PoP Display Market
- 14.1 South Africa
- 14.2 Egypt
- 14.3 Nigeria
- 14.4 Morocco
- 14.5 Rest of Africa
Chapter 15. Brazil PoP Display Company Profiles
- 15.1 [Company 01]
- 15.1.1 Company Overview
- 15.1.2 Key Management Personnel
- 15.1.3 Products & Services Portfolio
- 15.1.4 Financial Performance
- 15.1.5 Key Market Focus & Geographic Presence
- 15.1.6 Recent Developments & Strategic Initiatives
Note: The company profile list is preliminary and may change based on research findings, market developments, data availability, and client requirements.
Chapter 16. Appendices
- Appendix A – List of Abbreviations & Acronyms
- Appendix B – Industry Classification Code Reference – Full Series
- Appendix C – Production & Capacity Data Tables
- Appendix D – End-Use & Demand Base Tables
- Appendix E – Consumption & Replacement Rate Assumptions
- Appendix F – ASP Reference Tables
- Appendix G – Manufacturing & Facility Database
- Appendix H – Import-Export Data Tables
- Appendix I – Regulatory Summary Tables
- Appendix J – Primary Research Participant List (Anonymized)
- Appendix K – Primary Research Questionnaire Framework
- Appendix L – Data Sources & Bibliography
- Appendix M – Market Size Divergence & Source Comparison
Chapter 17. Research Methodology
- 17.1 Research Framework & Philosophy
- 17.2 Secondary Research – Sources, Hierarchy & Data Extraction
- 17.3 Data Modeling – Bottom-Up & Top-Down Market Sizing
- 17.4 Primary Research – Stakeholder Framework, LOI & Sample Sizes
- 17.5 Forecast Methodology – Regression, Scenario & Sensitivity Analysis
- 17.6 Quality Control – Four-Layer Validation Framework
- 17.7 Limitations & Standard Assumptions
- 17.8 Disclaimer
